Identifying nonalcoholic fatty liver disease patients with active fibrosis by measuring extracellular matrix remodeling rates in tissue and blood
Potential conflict of interest: Dr. Hellerstein consults, advises, holds intellectual property rights with, and owns stock in KineMed. Ms. Gatmaitan was employed by KineMed. Dr. Decaris was employed by KineMed. Dr. Li was employed by KineMed. Ms. Wang was employed by KineMed. Dr. Colangelo was employed by KineMed. Dr. Turner was employed by KineMed.
Supported by KineMed, Inc., and the National Institute of Diabetes and Digestive and Kidney Diseases (R01DK106419-01).
Abstract
Excess collagen synthesis (fibrogenesis) in the liver plays a causal role in the progression of nonalcoholic fatty liver disease (NAFLD). Methods are needed to identify patients with more rapidly progressing disease and to demonstrate early response to treatment. We describe here a novel method to quantify hepatic fibrogenesis flux rates both directly in liver tissue and noninvasively in blood. Twenty-one patients with suspected NAFLD ingested heavy water (2H2O, 50-mL aliquots) two to three times daily for 3-5 weeks prior to a clinically indicated liver biopsy. Liver collagen fractional synthesis rate (FSR) and plasma lumican FSR were measured based on 2H labeling using tandem mass spectrometry. Patients were classified by histology for fibrosis stage (F0-F4) and as having nonalcoholic fatty liver or nonalcoholic steatohepatitis (NASH). Magnetic resonance elastography measurements of liver stiffness were also performed. Hepatic collagen FSR in NAFLD increased with advancing disease stage (e.g., higher in NASH than nonalcoholic fatty liver, positive correlation with fibrosis score and liver stiffness) and correlated with hemoglobin A1C. In addition, plasma lumican FSR demonstrated a significant correlation with hepatic collagen FSR. Conclusion: Using a well-characterized cohort of patients with biopsy-proven NAFLD, this study demonstrates that hepatic scar in NASH is actively remodeled even in advanced fibrosis, a disease that is generally regarded as static and slowly progressive. Moreover, hepatic collagen FSR correlates with established risks for fibrotic disease progression in NASH, and plasma lumican FSR correlates with hepatic collagen FSR, suggesting applications as direct or surrogate markers, respectively, of hepatic fibrogenesis in humans. (Hepatology 2017;65:78-88).
Abbreviations
-
- ECM
-
- extracellular matrix
-
- Fib-4
-
- Fibrosis-4
-
- FSR
-
- fractional synthesis rate
-
- HbA1c
-
- hemoglobin A1c
-
- HCV
-
- hepatitis C virus
-
- LC/MS
-
- liquid chromatography–mass spectrometry
-
- MRE
-
- magnetic resonance elastography
-
- NAFL
-
- nonalcoholic fatty liver
-
- NAFLD
-
- nonalcoholic fatty liver disease
-
- NAS
-
- NAFLD activity score
-
- NASH
-
- nonalcoholic steatohepatitis
Nonalcoholic fatty liver disease (NAFLD) represents the most common cause of liver disease in developed countries, affecting an estimated 30% of the US population.1, 2 The NAFLD diagnosis covers a spectrum of disease states ranging from simple steatosis, termed “nonalcoholic fatty liver” (NAFL), to nonalcoholic steatohepatitis (NASH) with severe fibrosis, which can lead to cirrhosis and liver failure. The rate of NAFLD progression from NAFL to NASH or from NASH with mild fibrosis to cirrhosis varies greatly from patient to patient. A recent meta-analysis of paired-biopsy studies in NAFLD found that the one-stage fibrosis progression of NAFL subjects was about half that of NASH subjects (7.1 versus 14.3 years), indicating a correlation between disease severity and progression rate.3 Furthermore, approximately 20% of patients diagnosed with NASH with fibrosis are found to be “fast progressers,” rapidly advancing to cirrhosis in fewer than 10 years.3, 4
Repeat liver biopsies with histopathologic assessment remain the “gold standard” for monitoring fibrosis progression in NAFLD patients. As a result of the well-documented limitations of biopsy (e.g., morbidity from the procedure, anatomic heterogeneity of fibrosis in the liver), several noninvasive methods for assessing liver fibrosis have also gained attention, including the measurement of liver stiffness by transient elastography (FibroScan) or magnetic resonance elastography (MRE) and serum biomarker panels (e.g., FibroTest, Fibrosis-4 [Fib-4]), each of which has been reported to correlate with histological fibrosis stage in clinical studies.2, 5-7 A limitation to these approaches is that they only measure fibrotic disease status at a moment in time, rather than predicting the trajectory of future disease progression. Identification of those patients with fast-progressing fibrotic disease is therefore typically delayed until they already have late-stage fibrosis. In addition, with the slow rate of evolution of liver fibrosis typically requiring at least 1-2 years for changes in large populations of subjects to be reliably detected, drug trials are unable to monitor early clinical response to antifibrotic interventions. Diagnostic approaches that effectively predict individual clinical fibrotic disease progression over shorter periods of time would therefore be extremely valuable.8
Direct quantification of the flux rate of collagen synthesis and degradation (i.e., turnover) in the liver may, in principle, predict the likelihood of rapid advancement of fibrotic liver disease. By monitoring the rate of tracer incorporation into molecules associated with specific disease-related pathways, diagnostic approaches using stable isotope tracers allow for such measurements.9 We have measured the fractional synthesis rate (FSR) of hepatic collagen in patients with hepatitis C virus (HCV) infection by administering heavy water (2H2O) prior to liver biopsy combined with tandem mass spectrometric (MS/MS) analysis of proteins from liver tissue.10 We observed a wide range of FSRs for liver collagen among HCV patients as well as a positive correlation between collagen FSR and histological fibrosis stage, suggesting more extracellular matrix (ECM) remodeling in more advanced disease. Furthermore, shotgun analysis of HCV patient plasma identified the FSR of circulating lumican, a proteoglycan involved in collagen fibril formation shown to be overexpressed by hepatocytes in patients with NASH,11 as having a significant correlation with hepatic collagen FSR, thereby representing a potential minimally invasive surrogate marker of liver collagen remodeling rate.
Here, we present an analysis of hepatic collagen and plasma lumican FSRs measured cross-sectionally in 21 patients diagnosed with NAFLD. Histologic scoring of steatohepatitis and fibrosis, MRE analysis of liver stiffness, Fib-4 scoring, and hemoglobin A1c (HbA1c) levels were also assessed to determine the relationship between hepatic fibrogenesis rate and other factors that have been established to predict clinical progression rate in large NAFLD patient populations. We hypothesized that ECM would be dynamic even in advanced fibrotic disease, that hepatic collagen FSR would correlate with established risks for fibrotic disease progression in NASH, and that plasma lumican FSR would correlate with hepatic collagen FSR, providing a potential minimally invasive approach for quantifying hepatic fibrotic disease activity.
Participants and Methods
STUDY DESIGN: SUBJECT RECRUITMENT, 2H2O LABELING, AND TISSUE COLLECTION
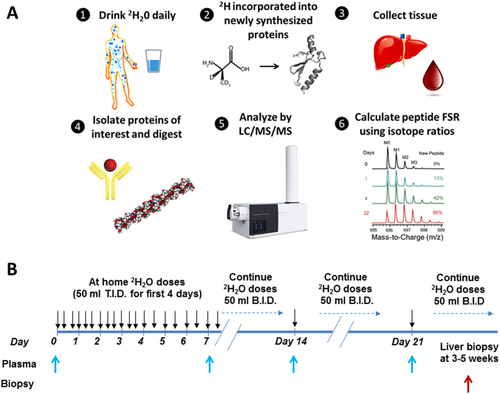
A total of 24 subjects undergoing diagnostic liver biopsy for suspected NAFLD were recruited by the NAFLD Research Center12-15 at the University of California–San Diego. Subjects were carefully screened and excluded for liver diseases other than NAFLD and secondary causes of hepatic steatosis as described (Supporting Information). Subjects drank 50 mL of 70% 2H2O three times per day for 4 days, followed by twice a day until the date of liver biopsy, for a total period of 3-5 weeks. Plasma, urine, and saliva were collected weekly from the start of heavy water labeling until the time of biopsy. Twenty-one subjects completed the study with a confirmed histological diagnosis of NAFLD (1 patient refused biopsy, 2 patients ultimately appeared not to have NAFLD). All procedures used in this study were approved by the University of California–San Diego Human Research Protections Program. Subjects provided written informed consent, and Declaration of Helsinki protocols were followed.
HISTOLOGICAL ASSESSMENT
All patients underwent liver biopsies, which were scored using the Nonalcoholic Steatohepatitis Clinical Research Network histological scoring system.16 Liver biopsies were scored by an experienced hepatopathologist blinded to the patients' clinical and radiological data. Hepatic fibrosis was scored on a five-point scale (0, 1, 2, 3, and 4). Hepatic steatosis and lobular inflammation were scored on a four-point scale (0, 1, 2, and 3), with hepatic ballooning and portal inflammation scored on a three-point scale (0, 1, and 2). The NAFLD activity score (NAS) was calculated as the sum of the steatosis, lobular inflammation, and ballooning scores, ranging 0-8. Patients were classified into NAFL and NASH. Patients with NAFLD who did not meet criteria for NASH were classified as NAFL. NASH was defined as presence of ballooning, steatosis, and lobular inflammation with a pattern consistent with steatohepatitis with or without perisinusoidal fibrosis.
MAGNETIC RESONANCE ELASTOGRAPHY
MRE was performed as described5, 17-20 using commercially available software and hardware from Resoundant Inc. (Rochester, MN). A detailed description of MRE analytical methods is included (Supporting Information).
LIVER TISSUE PREPARATION
Biopsied liver tissue (3-5 mg) was homogenized in water using a Fast Prep-24 bead mill (MP Biomedical, Burlingame, CA), followed by hepatic protein quantification using the BCA Protein Assay Kit (Thermo, Rockford, IL). Liver protein (80 μg) was denatured with urea (4M) in 25 mM ammonium bicarbonate (pH 8). Samples were reduced with 5 mM tris(2-carboxyethyl)phosphine for 20 minutes at room temperature with mixing, followed by incubation with iodoacetamide (10 mM) in the dark for 20 minutes to chemically modify reduced cysteines. Following sample dilution, proteins were digested with trypsin (Promega, Madison, WI) at 37°C overnight. The following day formic acid was added to a total volume of 5%, and peptides were concentrated and desalted prior to liquid chromatography (LC)–MS/MS using a C18 spec tip (Varian, Palo Alto, CA).
IMMUNOPRECIPITATION OF PLASMA PROTEINS
Immunoprecipitation of plasma lumican, transforming growth factor beta–induced protein, tenascin C, and ECM-1 was performed using a combination of streptavidin-coated magnetic beads (88817; Thermo Fisher) and biotinylated antibodies (BAF2846, BAF2935, BAF3358, BAF3937; R&D Systems). Plasma samples (1 mL volume) were spiked with 1.5 μg of each biotinylated antibody, followed by overnight incubation at 4°C with rotation. Samples were then allowed to return to room temperature and transferred to fresh tubes containing streptavidin-coated magnetic beads (2.5 μg beads/μg of antibody). Tubes were incubated at room temperature for 60 minutes, followed by isolation of magnetic beads using a magnetic stand (DynaMag-2; Thermo Fisher). Beads were then rinsed three times with 1 mL 0.1% Tween-20 and three times with phosphate-buffered saline to remove nonspecific proteins and residual surfactant, respectively. Proteins were then eluted twice with 100 μL 33% acetonitrile/0.4% trifluoroacetic acid. Eluents were combined, dried by vacuum centrifugation, and reconstituted in 50 mM NH4HCO3, 50% trifluoroethanol, and 50 mM dithiothreitol, followed by incubation at 60°C for 1 hour. Iodoacetamide (50 mM) was added to samples, followed by incubation in the dark for 20 minutes. Samples were then diluted, digested with trypsin overnight, spiked with 0.15% trifluoroacetic acid, vacuum-centrifuged, and reconstituted in 0.1% formic acid/3% acetonitrile prior to LC-MS/MS analysis.
MEASUREMENT OF PLASMA 2H2O ENRICHMENT
2H2O enrichment in patient plasma was determined from 75 μL of human plasma by gas chromatographic/MS analysis as described.21
LC-MS/MS PEPTIDE ANALYSIS
Trypsin-digested liver and plasma proteins were analyzed on Agilent 6550 quadrupole time-of-flight mass spectrometers fitted with 1260 Chip Cube nano ESI sources (Agilent Technologies, Santa Clara, CA). Peptides were separated chromatographically using a Polaris HR chip (Agilent G4240-62030) consisting of a 360-nL enrichment column and a 0.075 × 150 mm analytical column, each packed with Polaris C18-A stationary phase with 3 μm particle size. Mobile phases were (A) 5% vol/vol acetonitrile and 0.1% formic acid in deionized water and (B) 95% acetonitrile and 0.1% formic acid in deionized water. Peptides were eluted at a flow rate of 350 nL/min with a 27-minute LC gradient. Each sample was initially analyzed for protein/peptide identification in data-dependent MS/MS mode, followed by analysis for peptide quantitative isotope abundance in MS mode. In MS/MS mode, acquisition rates were 6 Hz for MS and 4 Hz for MS/MS with up to 20 precursors per cycle. Acquisition in MS mode was 0.6 Hz.
DETERMINATION OF PROTEIN FSRs AND RELATIVE ABUNDANCES
Protein identification, FSR calculations, and data-filtering criteria were performed as described.10, 22 Acquired MS/MS spectra were extracted and searched using Spectrum Mill Proteomics Workbench software (version B.04.00; Agilent Technologies) and a UniProtKB/Swiss-Prot human protein database (20,265 proteins, UniProt.org, release 2013_05). Fixed modifications (carbamidomethylation of cysteine) and variable modifications (oxidized methionine, pyroglutamic acid, hydroxylation of proline) were enabled with up to two missed cleavages permitted. Search results were autovalidated with a global false discovery rate of 1%. Proteins with scores >11.0 were reported, and a list of peptides with scores >6 and scored peak intensities >50% was exported from Spectrum Mill and condensed to a nonredundant peptide formula database using Excel. This database, containing peptide elemental composition, mass, and retention time was used to extract mass isotopomer abundances (M0-M3) of each peptide from corresponding MS-only acquisition files with the Find-by-Formula algorithm in Mass Hunter (version B.05.00; Agilent Technologies). Software developed at KineMed, Inc., was used to calculate peptide elemental composition and curve-fit parameters for determining peptide isotope enrichment or, more specifically, the change in fractional abundance of the parental 12C M0 mass isotopomer, in newly synthesized proteins during the period of heavy water exposure, based on measured precursor body water enrichment and the number of amino acid C–H positions per peptide that metabolically incorporate hydrogen and deuterium from body water while free amino acids. Subsequent data handling was performed using Microsoft Excel templates, with input of preceding body water enrichment for each subject, calculating the median FSR of peptides analyzed for each protein to yield FSR data at the protein level. Average body water enrichment from the start of 2H2O labeling until the time of tissue collection was used for the calculation of peptide FSRs at each time point. To account for variability in subject labeling times or to combine data from multiple sampling time points, protein FSRs per day were calculated by fitting to a one-phase exponential association: FSR = ln(1 – f)/t, where f is the fraction of the peptide that was newly synthesized at any time point. Kinetic data from hepatic and plasma protein digests were filtered to exclude proteins with fewer than two peptides that had usable isotopic measurements. For individual samples analyzed more than once in MS mode (analytical replicates), the median FSR from multiple observations of unique peptides was used for subsequent calculations of protein FSR. Correction for observed baseline deviation9 in isotopomer abundances was performed using a linear model derived from an unlabeled standard sample. Determination of liver and plasma protein FSRs was blinded from histological scoring, MRE scoring, and blood test results; and all final values for protein FSRs were locked at the analytic facility prior to unblinding the subject identities and clinical results by the clinical team.
STATISTICS
Linear correlation coefficients, significance of non-zero slopes, t tests, and analysis of variance comparing hepatic and plasma protein FSRs, magnetic resonance imaging data, histological scoring, and/or clinical lab data were performed in GraphPad Prism. P < 0.05 was considered significant.
Results
STUDY DESIGN AND ANALYSIS OF PATIENT DISEASE STAGE
An overview of the experimental methods and study design is provided (Fig. 1). Twenty-four subjects with suspected NAFLD consumed heavy water for a period of 3-5 weeks prior to diagnostic liver biopsy to assess hepatic collagen FSR. Plasma was also collected weekly during the labeling period for analysis of FSRs of circulating ECM proteins. Twenty-one subjects completed the study with a confirmed histological diagnosis of NAFLD (10 NAFL, 11 NASH). Patient characteristics are summarized in Table 1. Subject age and body mass index were not significantly different between those diagnosed with NAFL and NASH, and gender differences were minor between groups (4/10 of NAFL and 6/11 of NASH patients were female). NAS and fibrosis scores for subjects with NASH (4.55 ± 1.13 and 2.18 ± 1.17) were significantly higher than those observed in subjects with NAFL (3.14 ± 0.69 and 0.40 ± 0.52). The hepatocyte ballooning subcomponent of NAS scoring was significantly different between NASH and NAFL (P < 0.001), while steatosis and inflammation scores were not. Portal inflammation score, aspartate transaminase level, and HbA1c level were also significantly different between groups (P < 0.05). Noninvasive assessment of liver stiffness performed by MRE was significantly higher in patients with NASH than NAFL (P = 0.03). Fib-4 score was unable to differentiate patients with NAFL versus NASH.
| Subject Group | NAFL (n = 10) | NASH (n = 11) | P |
|---|---|---|---|
| Gender | 6 male, 4 female | 5 male, 6 female | — |
| Age (years) | 54 ± 11 | 51 ± 11 | 0.62 |
| Body mass index (kg/m2) | 32 ± 6 | 33 ± 5 | 0.53 |
| AST (U/L) | 30 ± 7 | 55 ± 30 | <0.05 |
| ALT (U/L) | 46 ± 19 | 69 ± 36 | 0.09 |
| HbA1c (%) | 5.7 ± 0.3 | 7.3 ± 1.7 | <0.01 |
| Platelets (×109/L) | 234 ± 82 | 214 ± 85 | 0.59 |
| AST/ALT ratio | 0.73 ± 0.28 | 0.80 ± 0.16 | 0.50 |
| Fib-4 score | 1.23 ± 0.69 | 2.24 ± 1.95 | 0.14 |
| MRE average (kPa) | 2.57 ± 0.34 | 4.47 ± 2.35 | <0.05 |
| NAS (0-8) | 3.14 ± 0.69 | 4.55 ± 1.13 | <0.01 |
| Steatosis (0-3) | 1.71 ± 0.76 | 1.80 ± 0.63 | 0.80 |
| Lobular inflammation (0-3) | 1.43 ± 0.53 | 1.50 ± 0.53 | 0.79 |
| Ballooning (0-2) | 0.00 ± 0.00 | 1.20 ± 0.63 | <0.001 |
| Fibrosis score (0-4) | 0.40 ± 0.52 | 2.18 ± 1.17 | <0.001 |
| Portal inflammation (0-2) | 0.71 ± 0.49 | 1.30 ± 0.48 | <0.05 |
- NAS, AST/ALT ratio, Fib-4 score, and MRE scores were used to assess disease severity.16
- Abbreviations: ALT, alanine transaminase; AST, aspartate aminotransferase.
RELATIONSHIP OF HEPATIC COLLAGEN FSR WITH FIBROSIS STAGE
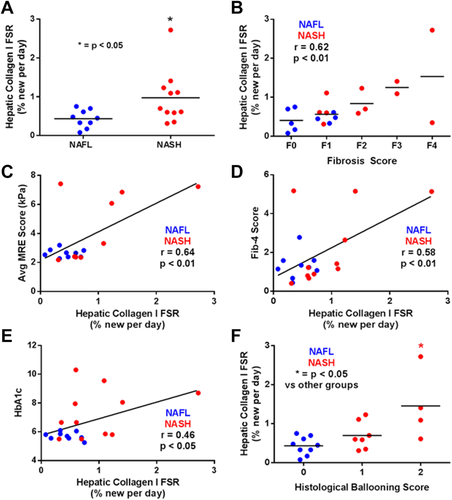
FSR of hepatic collagen (type 1, subunit α1) was significantly higher in patients with NASH compared to NAFL (Fig. 2A; P < 0.05). Collagen FSR in patients with NAFL ranged 0.08%-0.75% per day (mean 0.43 ± 0.23%), while NASH subjects ranged 0.31%-2.72% per day (mean 0.97 ± 0.69%). Of the five NASH subjects having collagen FSRs >1% per day, four had histologic fibrosis scores of F2-F4. Linear regression analysis also demonstrated a significant positive correlation between histological fibrosis score and hepatic collagen FSR (Fig. 2B; r = 0.62, P < 0.01). In addition, hepatic collagen FSR correlated significantly with noninvasive metrics of liver fibrosis stage, including liver stiffness by MRE (Fig. 2C; r = 0.64, P < 0.01) and Fib-4 score (Fig, 2D; r = 0.58, P < 0.01). Hepatic collagen FSR also correlated with HbA1c levels (Fig, 2E; r = 0.46, P < 0.05) and was significantly higher in patients with a histologic ballooning score of 2 (Fig. 2F; P < 0.05).
COMPARISON OF PLASMA LUMICAN FSR TO LIVER COLLAGEN FSR AND FIBROSIS STAGE
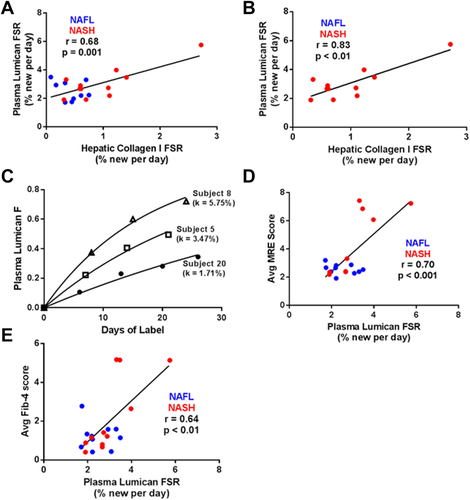
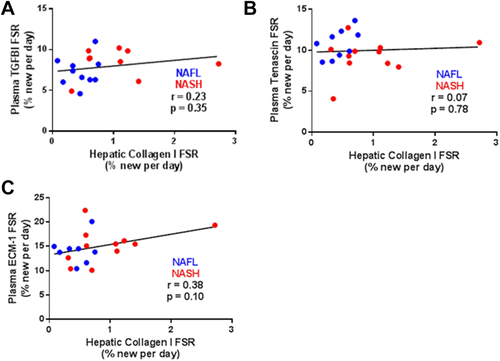
Linear regression analysis revealed a significant correlation between liver collagen FSR and plasma lumican FSR, for all subjects (Fig. 3A; r = 0.68, P < 0.01) as well as for subjects with NASH + fibrosis only (Fig. 3B; r = 0.83, P < 0.01). Turnover rates for plasma lumican ranged from 1.71% to 5.75% per day (Fig. 3C), roughly 3-fold faster than that of hepatic collagen. Similar to hepatic collagen FSR, plasma lumican FSR also correlated with noninvasive metrics of fibrosis stage including liver stiffness (Fig. 3D; r = 0.70, P < 0.001) and Fib-4 score (Fig. 3E; r = 0.64, P < 0.01). FSRs of additional circulating ECM proteins enriched from plasma (transforming growth factor beta–induced protein, tenascin C, and ECM-1) did not significantly correlate with hepatic collagen FSR (Fig. 4A-C).
Discussion
The clinical progression rate of NAFLD is highly variable, with histologic degree of fibrosis representing the strongest current predictor of disease progression. Accordingly, ECM deposition is believed to play a central causal role in disease progression, but there are currently no reliable clinical techniques for quantifying activity or flux of the fibrotic pathway. Using heavy water labeling combined with LC-MS/MS analysis to assess ECM protein remodeling rates and a cross-sectional study design, we evaluated the hypotheses, first, that hepatic fibrogenesis rate can be measured in NAFLD subjects both directly from liver tissue and noninvasively from blood and, second, that the rate of fibrogenesis will correlate with established risk factors for disease progression.
We report the first direct measurements of hepatic collagen FSR in patients with NAFLD. As opposed to traditional approaches that monitor fibrosis progression through serial static measurements over a time period of months or years, the heavy water labeling approach described here measures the integrated rate of hepatic fibrogenic disease activity in a patient over a time period of weeks. As expected, we observed significantly higher hepatic collagen FSR in patients with NASH versus NAFL, consistent with the documented higher rate of fibrotic disease progression in NASH.3 Similar to our previous study in HCV patients,10 we also observed a strong positive correlation between hepatic collagen FSR and histologic fibrosis stage, indicating a general acceleration in fibrotic disease activity with more advanced disease. This conclusion was also supported by the significant correlation of liver collagen FSR with MRE-quantified liver stiffness, another indicator of fibrotic disease severity.
It is important to emphasize that collagen FSR reflects at steady state both synthesis and degradation rates (i.e., collagen remodeling or turnover) in the tissue and that the measured FSR values of ∼1%/day for liver collagen in NASH patients represent a replacement half-life of about 2 months. Because net liver collagen content does not increase at anywhere near a doubling time of 2 months, these results reveal the perhaps surprising conclusion that liver collagen remodeling rates are higher in more advanced fibrotic disease—i.e., that the collagen pool in more fibrotic livers has a shorter half-life than in early disease. This observation is novel in NAFLD and has potentially intriguing therapeutic implications, in that dynamic hepatic scar in NASH may be potentially reversible if ongoing collagen deposition rates can be reduced.
It is also important to point out that fibrogenesis rate is fundamentally different from static content of scar and that the two measurements did not need to correlate. Fibrosis stage is a static measurement and represents total accumulation of collagen or ECM over time, while the FSR is a flux rate and reveals the dynamics of turnover at the present moment and could even be inversely correlated (i.e., the more scar, the longer its life span might be). Our finding that collagen turnover is higher in more advanced stages of liver fibrosis is in our view novel and pathophysiologically interesting but not a criterion for validation of the kinetic measurement.
Hepatic collagen FSR correlated significantly with HbA1c levels, consistent with previous studies reporting a higher prevalence of advanced fibrotic disease in the subpopulation of NAFLD patients with type 2 diabetes.23 A correlation between a single HbA1c value and the cumulative histologic fibrosis stage would not be expected, but what we measured here was fibrogenesis rate at a moment in time, just as HbA1c represents glycemic control at a point in time. Although a causal relationship cannot be inferred, correlating current fibrogenesis rate with current HbA1c is potentially informative. Confirming the nature of this relationship will require larger studies, however.
We next assessed plasma lumican FSR in NAFLD based on our previous finding of a significant correlation between hepatic collagen FSR and plasma lumican FSR in patients with HCV infection.10 We observed in NAFLD a significant correlation between plasma lumican FSR and hepatic collagen FSR, providing a potentially noninvasive approach to identify patients with active fibrotic disease. We recently reported a similar heavy water labeling–based “virtual biopsy” approach for measuring the FSR of skeletal muscle proteins from the turnover of muscle-specific proteins that are found in blood (e.g., creatine kinase-type M and carbonic anhydrase-3).24 Lumican, a proteoglycan involved in collagen fibril formation and the regulation of transforming growth factor-β activity, is not a liver-specific protein but has previously been shown to be overexpressed in hepatic tissue collected from patients with NASH.11 Knockout studies in mice have also demonstrated a requirement for lumican in the development of liver fibrosis.25 Hepatic cell–derived lumican may therefore represent a significant proportion of circulating lumican in NASH subjects with active liver fibrosis, allowing the FSR of lumican in plasma to reflect activity of the fibrogenic pathway in liver. Importantly, plasma lumican exhibits approximately 3 times higher FSR than liver collagen, providing an operational advantage for use as a diagnostic marker (a shorter time is required for measurable clinical labeling).
We used the combined data from weekly plasma lumican FSR measurements made over 3 weeks for calculations here, but a shorter heavy water exposure period (e.g., 1 week) is feasible. Prospective analysis of the FSR of several other circulating ECM proteins associated with the fibrotic pathway did not reveal a significant correlation with hepatic collagen FSR, suggesting that they may not be enriched to the same degree as lumican in the fibrotic ECM associated with NASH or are not released to the same extent into plasma. The present study also did not evaluate the utility of plasma lumican FSR as a prognostic or therapeutic biomarker of fibrogenesis rate in NAFLD patients. Additional longitudinal clinical studies of this type are therefore a priority.
If confirmed in a larger cohort, the findings presented here have potential implications for patient management and disease pathogenesis. Elevated remodeling of hepatic collagen in patients with advanced fibrosis indicates that antifibrotic therapies may be particularly effective in this patient population. Although antifibrogenic treatments have not been proven to slow progression or reverse disease in NAFLD, the ability to measure fibrogenesis rates in human subjects will be helpful in testing this hypothesis, if effective antifibrogenic agents become available. The reversibility of liver fibrosis is supported by recent studies in HCV infection demonstrating the (slow) resolution of hepatic fibrosis in a large percentage of patients who achieved sustained viral response following treatment with antiviral drugs.26, 27 Analysis of additional cirrhosis patients is required to determine whether observed disparities in collagen FSR are indicative of distinct disease progression rates or reflect a deceleration in collagen remodeling in a subset of patients associated with end-stage cirrhotic disease.
An important limitation of the present study is the small number of patients with advanced fibrotic disease. Although this was not unexpected, as patients with advanced fibrotic disease comprise only a small percentage of NAFLD diagnoses, future studies examining rate-based markers of fibrotic disease will require additional patients with advanced disease. It is also important to note that due to extensive posttranslational modification including crosslinking of hydroxylysyl amino acid residues, type 1 collagen is highly insoluble, making LC/MS-based analysis of trypsin-generated collagen peptides inherently difficult. Previous studies have demonstrated differences in the enzymatic digestibility of collagen isolated from tissues at various stages of fibrotic disease.28 We have also demonstrated, in both healthy and fibrotic murine tissue, that subpopulations of collagens defined by acid solubility have distinct FSRs.21 In the present study, we employed the straightforward approach of enzymatically digesting all hepatic proteins following tissue homogenization. Our measurement of hepatic collagen FSR therefore reflects that subset of collagen molecules susceptible to enzymatic digestion following physical disruption of each tissue sample. Increased hepatic collagen FSR observed in patients with advanced fibrotic disease may therefore reflect a combination of the increased synthesis/degradation of the digestible collagen pool, as well as a reduction in the digestibility of more mature collagen fibers.
While the current study provides proof-of-concept for the potential utility of ECM protein FSR measurements in research trials, we recognize that any test involving an in vivo stable isotope labeling procedure in human subjects is more complex than a simple blood draw. Many widely used procedures in clinical medicine, however, do involve in vivo administration of a diagnostic reagent—dye administration in radiology, radionuclides in nuclear medicine, hormone stimulation in endocrinology (thyrotropin-releasing hormone, adrenocorticotropic hormone, dexamethasone, etc.), and oral glucose tolerance tests, to name a few. Because the underlying MS technology advances rapidly—even a decade ago the measurement of peptide labeling ratios that we present here using commercially available mass spectrometers would not have been possible—the labeling method described in this article is unlikely to be the final version or iteration of a method for clinical measurement of fibrogenesis rates. It may therefore be possible in the near future for a subject to ingest one or a few doses of stable isotope label, for example, to measure ECM dynamics.
In summary, the present cross-sectional study demonstrates the dynamicity of liver ECM in NAFLD and serves to generate several testable hypotheses relating hepatic fibrogenesis rate to clinical disease progression. Definitive testing of the predictive value of liver fibrogenesis rates for clinical progression or early response to treatment in NAFLD, particularly when measured by plasma lumican turnover, require additional longitudinal trials.
Acknowledgment
We thank C. Fessler, G. Czerwieniec, and W. Holmes for providing expertise in MS.
REFERENCES
Author names in bold designate shared co-first authorship.


