Mineralocorticoid receptor suppresses cancer progression and the Warburg effect by modulating the miR-338-3p-PKLR axis in hepatocellular carcinoma
Potential conflict of interest: Nothing to report
Supported by grants from the National Natural Science Foundation of China (81301815, 81472678, 81201624), the Shanghai Natural Science Foundation (13ZR1440100), and the State Key Laboratory of Oncogenes and Related Genes (91-14-08).
Abstract
Hormones and their corresponding receptors are vital in controlling metabolism under normal physiologic and pathologic conditions, but less is known about their roles in the metabolism of cancer. Using a small interfering RNA screening approach, we examined the effects of silencing 20 well-known hormone receptors on the Warburg effect, specifically by measuring the production of lactate in four established hepatocellular carcinoma (HCC) cell lines. We found that silencing a variety of hormone receptors had effects on the production of this metabolite. Unexpectedly silencing of mineralocorticoid receptor (MR) significantly increased lactate production in all these HCC cell lines. Subsequent in vitro and in vivo studies showed that gain- and loss-of-function of MR significantly influenced HCC cellular proliferation, cell cycle distribution, and apoptosis. Furthermore, mechanistic studies revealed that MR as a transcriptional factor directly regulated the expression of miR-338-3p, suppressing the Warburg effects of HCC cells by targeting a key enzyme of glycolysis: pyruvate kinase, liver and red blood cells. Moreover, MR expression was significantly down-regulated in 81% of HCC patient tissues, caused by both chromosome deletion and histone deacetylation. Low expression of MR in tumor tissues was associated with poor patient prognosis. The expression level of miR-338-3p was found to positively correlate with the expression of MR in HCC tissues and to inversely correlate with expression of the enzyme pyruvate kinase, liver and red blood cells. Conclusion: MR affects HCC development by modulating the miR-338-3p/pyruvate kinase, liver and red blood cells axis with an ability to suppress the Warburg effect. (Hepatology 2015;62:1145-1159)
Abbreviations
-
- Ald
-
- aldosterone
-
- cDNA
-
- complementary DNA
-
- ChIP
-
- chromatin immunoprecipitation
-
- CNL
-
- corresponding noncancerous liver
-
- GH
-
- growth hormone
-
- HCC
-
- hepatocellular carcinoma
-
- miRNA
-
- microRNA
-
- MR
-
- mineralocorticoid receptor
-
- mRNA
-
- messenger RNA
-
- PCR
-
- polymerase chain reaction
-
- PKLR
-
- pyruvate kinase, liver and red blood cells
-
- siRNA
-
- small interfering RNA
-
- SPI
-
- spironolactone
-
- TH
-
- thyroid hormone
-
- TR
-
- TH receptor
-
- UTR
-
- untranslated region
Altered energy metabolism is regarded as one of the hallmarks of cancer.1 The Warburg effect (i.e., aerobic glycolysis) refers to the phenomenon that cancer cells preferentially utilize glycolysis over oxidative phosphorylation even in the presence of enough O2 that can support mitochondrial respiratory function.2 Aerobic glycolysis promotes the rapid proliferation of tumor cells by supplying raw materials for synthesis of nucleotides, amino acids, and lipids, providing a significant growth advantage over conventional metabolic processes. Additionally, aerobic glycolysis is considered to be a key driver for tumor metastasis and therapeutic resistance.3 Recently, accumulating evidence has indicated that increased glycolysis is associated with the activation of oncogenes and/or mutated tumor suppressor genes.4, 5
Hormones and their corresponding receptors are fundamental in the control of metabolic processes. For example, growth hormone (GH), a pituitary peptide hormone, stimulates pleiotropic effects, including childhood growth, metabolism, and sexual maturation at puberty. Recently, it was found that GH may be involved in cancer development. Naturally occurring or experimentally induced functional deficiency in GH or GH receptor was associated with a dramatic reduction in the incidence of cancer.6, 7 The expression levels of GH and GH receptor are increased in multiple types of human cancer.8 It has been suggested that the GH/insulin-like growth factor-1 axis is involved in the initiation and development of certain cancers.9
Thyroid hormones (THs) and TH receptors (TRs) play crucial roles, primarily in mediating metabolic rate. In addition to their role under normal physiological conditions, it has been shown that THs and TRs are involved in tumor development. Loss of TR genes has been found in many different types of cancer (e.g., lung cancer, breast cancer, and colon carcinoma).10-13 Additionally, somatic mutations of TRs have been reported in renal clear cell carcinoma14 and breast cancer.15 The liver is a typical target organ of thyroid hormones. Hypothyroidism, characterized by the insufficient production of THs and inappropriate TR action, may be a risk factor for primary liver cancer.16
The liver is the primary organ site for the regulation of whole-body metabolism and energy homeostasis. Aberrant energy metabolism is closely related with the pathogenesis of many liver diseases as well as the progression of liver disease to carcinomas. Primary liver cancer is the fifth most common malignancy in men and remains the third leading cause of cancer deaths worldwide. Hepatocellular carcinoma (HCC), the most common liver cancer, accounts for 70%-85% of all liver cancers.17
In the current study, a small interfering RNA (siRNA) screen of 20 well-known hormone receptors was performed to determine which hormones and hormone receptors are involved in glycolytic metabolism of HCC. The results showed that silencing of mineralocorticoid receptor (MR) by siRNA increased lactate production in four separate HCC cell lines. It was also demonstrated that MR affects HCC cell proliferation, cell cycle processes, and apoptosis in vitro and in vivo. Furthermore, it was demonstrated that MR transcriptionally regulates the expression of miR-338-3p, which directly targets the enzyme pyruvate kinase, liver and RBC (PKLR) and suppresses the Warburg effect in HCC cells. Expression of MR was significantly down-regulated in 81% of HCC patient tissues through both genetic and epigenetic mechanisms. Importantly, the down-regulation of MR indicated poor patient prognoses. Taken together, the results reveal a novel role of the hormone receptor MR in HCC development by modulating the miR-338-3p/PKLR axis to suppress glycolytic metabolism.
Materials and Methods
Clinical Samples
In this study, two sets of HCC samples were used. The first set, containing 202 cases of HCC samples, was used for the analysis of MR expression by immunohistochemical staining and its correlation with clinicopathological features. The second set was used for identification of the MR messenger RNA (mRNA) and protein expression levels in HCC. All HCC specimens were obtained from patients who underwent surgical resection of their tumors and signed informed consent before their liver operations in the Department of Transplantation and Hepatic Surgery, Ren Ji Hospital, School of Medicine, Shanghai Jiao Tong University. All protocols were approved by the ethical review committee of the World Health Organization's Collaborating Center for Research in Human Production (authorized by the Shanghai municipal government).
Cell Proliferation Assay, Plate Colony Formation Assay, and In Vivo Tumor Formation Assay
The details for cell proliferation assay and plate colony formation assay are described in the Supporting Information. For in vivo tumor formation, mice were manipulated and housed according to protocols approved by the East China Normal University Animal Care Commission. All animals received humane care according to the criteria outlined in the Guide for the Care and Use of Laboratory Animals prepared by the National Academy of Sciences and published by the National Institutes of Health.
mRNA/microRNA Array
Lenti-vector/SMMC-7721, Lenti-sh-MR/SMMC-7721 cells were collected and homogenized in Trizol (Invitrogen). A complementary DNA (cDNA) and microRNA (miRNA) microarray analysis was performed by Shanghai Biotechnology Corporation. Transcript and miRNA profilings of Lenti-vector/SMMC-7721, Lenti-sh-MR/SMMC-7721 cells were submitted to the National Center for Biotechnology Information's GEO database, and the repository URL and the data accession numbers are GSE64890 and GSE65081.
Chromatin Immunoprecipitation-Polymerase Chain Reaction Assay
A chromatin immunoprecipitation (ChIP) assay kit (EZ-ChIP 17-371; Millipore) was used according to the manufacturer's protocol. The details are described in the Supporting Information.
Fluorescence In Situ Hybridization
Fluorescence in situ hybridization to detect MR deletion was carried out using the BAC clone RP11-269E10. The BAC clone was labeled by nick translation using Spectrum Red-dUTP (Vysis, Inc.). The spectrum green-labeled CEP4 centromere (Vysis, Inc.) was used as control. The details are described in the Supporting Information.
Extracellular Acidification Rate/Oxygen Consumption Rate Measurements
The extracellular acidification rate and oxygen consumption rate were measured using a Seahorse XF24 analyzer (Seahorse Biosciences). The details are described in the Supporting Information.
The details for immunohistochemistry, cell culture, real-time polymerase chain reaction (PCR), western blot, lentivirus production and transduction, cell cycle and apoptosis analysis, and luciferase reporter assays are described in the Supporting Information.
Statistical Analysis
Data are presented as the means ± standard error of the mean. Statistical analyses were done using SPSS 16.0 for windows (IBM). Cumulative survival time was calculated by the Kaplan-Meier method and analyzed by the log-rank test. The chi-squared test and the Student t test were used for comparison between groups. P < 0.05 was considered statistically significant.
Results
Identification of Hormone Receptors Involved in Glycolytic Metabolism of HCC by siRNA Screening
To study the hormone receptors involved in glycolytic metabolism of HCC, an siRNA screening of 20 well-known hormone receptors was initially performed; and the effects of silencing each receptor on lactate production were measured, as an indicator of glycolysis, in four established HCC cell lines (SMMC-7721, SK-Hep1, MHCC-97H, and MHCC-LM3). Messenger RNA expression of these 20 receptors and the grade of silencing of these genes are shown in Supporting Figs. S1 and S2. Silencing of the glucagon receptor, estrogen receptor 1, adrenoceptor alpha 2A, parathyroid hormone 1 receptor, gonadotropin-releasing hormone receptor, MR, and insulin receptor affected the production of lactate in SMMC-7721 cells. In SK-Hep1 cells, silencing of androgen receptor, prostaglandin D2 receptor 2, estrogen receptor 1, adrenoceptor alpha 2A, parathyroid hormone 1 receptor, melanocortin 2 receptor, GH receptor, gonadotropin-releasing hormone receptor, MR, prolactin receptor, and progesterone receptor altered lactate production (Fig. 1A). Silencing of the androgen receptor, glucocorticoid receptor (NR3C1), oxytocin receptor, estrogen receptor 1, MR, prolactin receptor, insulin receptor, and progesterone receptor influenced lactate level in MHCC-97H cells (Fig. 1A). In MHCC-LM3 cells, production of lactate was changed by silencing of the androgen receptor, NR3C2, adrenoceptor alpha 2A, parathyroid hormone 1 receptor, MR, prolactin receptor, and progesterone receptor (Fig. 1A). Interestingly, among the 20 hormone receptors, only silencing of MR increased lactate level in all four HCC cell lines. Therefore, the precise role and mechanism of MR in HCC progression were further investigated.
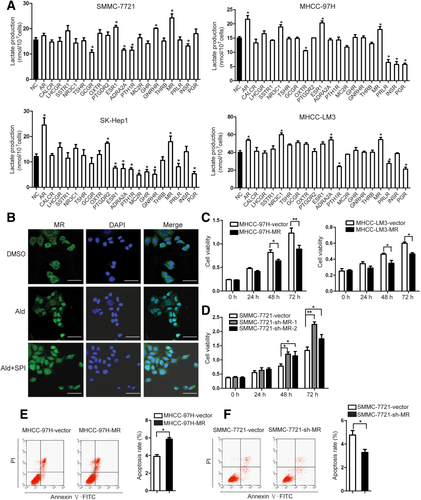
The MR affects HCC cell proliferation, cell cycle, and apoptosis. (A) The siRNA screen of 20 well-known hormone receptors measures the effect of silencing on lactate production. (B) Immunofluorescence staining demonstrating nuclear translocation of MR induced by Ald and partially blocked by antagonist SPI in SMMC-7721 cells. Scale bar = 50 μm. (C,D) Cell viability was measured by Cell Counting Kit-8 assay in MR-overexpressed (MHCC-97H-MR and MHCC-LM3-MR) and MR-silenced (SMMC-7721-sh-MR) cells. (E,F) Flow-cytometric analysis of cell apoptosis in MR-overexpressed (MHCC-97H-MR) and MR-silenced (SMMC-7721-sh-MR) cells. Abbreviations: DAPI, 4′,6-diamidino-2-phenylindole; DMSO, dimethyl sulfoxide.
In addition, the effects of silencing 20 receptors on lactate production in the nontransformed human cell line THLE-2 were examined. The data are shown in Supporting Fig. S3A-C.
MR Affects HCC Cell Proliferation, Cell Cycle, and Apoptosis
Because genetic mutations frequently occur in cancer cells, sometimes leading to changes in the biochemistry of the protein product, the ability of MR to bind its ligand and translocate into the nucleus was confirmed. Immunofluorescence detection in SMMC-7721 cells showed that treatment of 10 nM aldosterone (Ald) causes MR translocation from cytoplasm to nucleus. In addition, the nuclear translocation of MR induced by Ald could be partially blocked by an antagonist, spironolactone (SPI) (Fig. 1B).
To further elucidate the role of MR in HCC, stable cell lines were established that were transduced by the lentivirus carrying either the MR gene or MR-short hairpin RNA in HCC cells (Supporting Fig. S4A,B). We then investigated the effect of MR on HCC cell proliferation. The results showed that overexpression of MR significantly inhibited cell proliferation in MHCC-97H and MHCC-LM3 cell lines, while silencing of MR significantly promoted proliferation of SMMC-7721 cells (Fig. 1C,D).
Because MR significantly suppressed HCC cell proliferation, we next aimed to determine whether MR affects cell cycle progression of HCC cells. Cell cycle distribution analysis showed that overexpression of MR induced G1-phase arrest in both MHCC-97H and MHCC-LM3 cells. Consistent with these results, silencing of MR resulted in a significant decrease in the cellular population in G0/G1 phase with a sharp increase in S phase in SMMC-7721 cells (Supporting Fig. S5A-C).
The effect of MR on cell apoptosis was also investigated. The results showed that overexpression of MR increased apoptosis in MHCC-97H cells (Fig. 1E) and that silencing of MR reduced the apoptosis rate of SMMC-7721 cells (Fig. 1F).
MR Suppresses HCC Cell Colony Formation In Vitro and Xenograft Tumor Growth In Vivo
In plate colony formation assays, overexpression of MR inhibited the plate colony formation ability of MHCC-97H and MHCC-LM3 cells, as measured by the number of clones. Conversely, knockdown of MR increased the plate colony formation ability of SMMC-7721 cells (Fig. 2A; Supporting Fig. S6A-C).
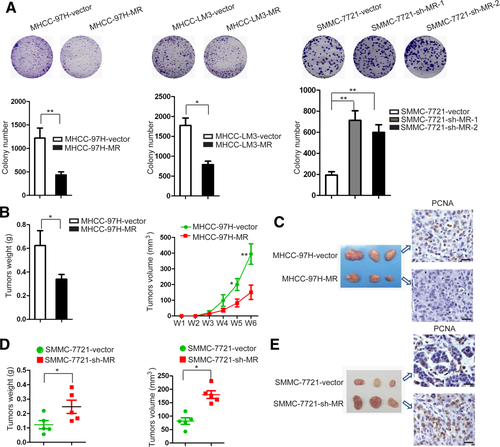
The MR suppresses HCC cell colony formation in vitro and xenograft tumor growth in vivo. (A) The number of clones in the plate colony formation assay was measured by Image-Pro-Plus 6.0 in MR-overexpressed (MHCC-97H and MHCC-LM3) and MR-silenced (SMMC-7721) cells. (B) The size and weight of the xenograft tumors formed by MR-overexpressed (MHCC-97-MR) and control (MHCC-97H-vector) cells. Scale bar = 50 μm. (C) Immunostaining of proliferating cell nuclear antigen in tumors formed by MR-overexpressing (MHCC-97-MR) and control (MHCC-97H-vector) cells. Scale bar = 50 μm. (D) The size and weight of the tumors that developed from MR-silenced (SMMC-7721-sh-MR) and control (SMMC-7721-vector) cells. (E) Immunostaining of proliferating cell nuclear antigen in tumors formed by MR-silenced (SMMC-7721-sh-MR) and control (SMMC-7721-vector) cells. Scale bar = 50 μm. Abbreviation: PCNA, proliferating cell nuclear antigen.
To further explore the effect of MR on tumorigenicity in vivo, we applied two sets of experiments. First, Lenti-MR/MHCC-97H or Lenti-shMR/SMMC-7721 cells were transplanted into nude mice subcutaneously. The weight and size of the tumors formed by Lenti-MR cells were significantly decreased in comparison with the tumors formed by Lenti-vector cells (Fig. 2B), while the parameters of the tumors that developed from Lenti-sh-MR cells were significantly increased (Fig. 2D). Then, we applied lentivirus-mediated gene transfer in developed xenograft tumors to explore the effects of silencing or overexpression of MR on tumor growth. The results showed that MR-silencing lentivirus promotes tumor growth, while MR-overexpression lentivirus inhibits tumor growth (Supporting Fig. S7). Immunohistochemical staining further confirmed that MR expression was improved in xenograft tumor tissues formed by MR-overexpression cells but decreased in tumor tissues developed from MR-silencing cells (Supporting Fig. S8A).
We further performed immunohistochemical staining for proliferating cell nuclear antigen, a marker of cell proliferation, and western blot for CASP9, a marker of cell apoptosis, in xenograft tumor tissues. Compared with the tumors formed by Lenti-vector cells, immunostaining of proliferating cell nuclear antigen was weaker in those formed by Lenti-MR cells (Fig. 2C), while immunostaining of proliferating cell nuclear antigen was stronger in the tumors that developed from Lenti-sh-MR cells than those developed from Lenti-vector cells (Fig. 2E). Furthermore, expression of CASP9 was improved in tumors formed by Lenti-MR cells but decreased in tumors developed from Lenti-vector cells (Supporting Fig. S8B).
Moreover, the lactate level in xenograft tumors was also measured. The results showed that the lactate level of the tumors formed by Lenti-MR cells was significantly decreased in comparison with the tumors formed by Lenti-vector cells, while the lactate level of the tumors that developed from Lenti-sh-MR cells were significantly increased (Supporting Fig. S8C).
Ald, the Native Ligand, Activates MR and Suppresses HCC Growth
The physiological role of the native ligand Ald was further investigated with regard to HCC cell growth. The results demonstrated that Ald significantly suppresses cell proliferation in a dose-dependent manner in SMMC-7721 cells, and this suppression was blocked by the antagonist SPI (Fig. 3A). Analogous results were also obtained using plate colony formation assays. The plate colony formation ability of SMMC-7721 cells was inhibited by Ald dose-dependently, which was effectively reversed by the presence of the pharmacologic antagonist SPI (Fig. 3B; Supporting Fig. S8D). Notably, Ald also induced G1-phase arrest in SMMC-7721 cells (Supporting Fig. S5D).
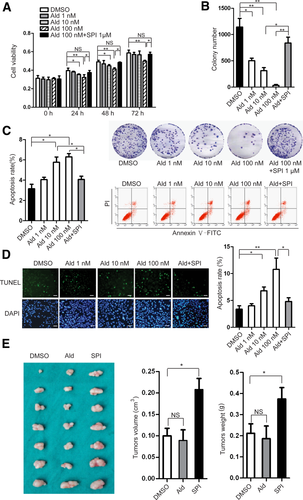
Aldosterone activates MR and suppresses HCC growth. (A) Cell viability of SMMC-7721 cells treated with Ald and SPI as measured by the Cell Counting Kit-8 assay. (B) Plate colony formation of SMMC-7721 cells treated with Ald and SPI was measured by Image-Pro-Plus 6.0. (C) Cell apoptosis of SMMC-7721 cells treated with Ald and SPI was measured by flow-cytometric analysis. (D) Terminal deoxynucleotidyl transferase–mediated deoxyuridine triphosphate nick-end labeling staining of SMMC-7721 cells treated with Ald and SPI. Scale bar = 50 μm. (E) The size and weight of the xenograft tumors treated with Ald and SPI. Abbreviations: DMSO, dimethyl sulfoxide; FITC, fluorescein isothiocyanate.
Using flow cytometry to analyze cells after being treated with Ald for 24 hours, both early apoptosis and late apoptosis of SMMC-7721 cells increased in a dose-dependent manner, which was also blocked by the antagonist SPI (Fig. 3C). Consistent with these results, terminal deoxynucleotidyl transferase–mediated deoxyuridine triphosphate nick-end labeling assays demonstrated that elevated Ald increased apoptosis of SMMC-7721 cells, and the effect was eliminated by SPI (Fig. 3D). These data support the notion that MR activation by the physiological ligand suppresses HCC cell growth.
We then applied Ald and SPI in vivo in a xenograft model. The results showed that SPI (20 μg/tumor) enhances tumor growth; however, Ald (10 μg/tumor) had no effect on tumor growth (Fig. 3E). One possible reason for the ineffectiveness of Ald in vivo might be the existence of endogenous Ald, which is possibly sufficient for MR activation. As antagonist, SPI could competitively bind with MR and inhibit its function.
MR Regulates the Expression of PKLR
To investigate the underlying mechanism by which MR affects HCC cell behaviors, we performed genome-wide cDNA microarrays using SMMC-7721-vector/SMMC-7721-sh-MR cells (Supporting Fig. S9A). Pathway analysis of the results (fold change ≥2 or ≤0.5) showed that the most altered pathway was metabolic (39.1%), particularly glycolysis (Supporting Fig. S10). There were five glycolysis enzyme genes or glucose transporter (HK2, PKM, PKLR, SLC2A11, PFKFB2) that were significantly changed in the cDNA microarrays (Supporting Fig. S11A and Table S1). To validate the microarray data, quantitative real-time PCR was performed on these five genes in SMMC-7721-vector/SMMC-7721-sh-MR cells, which all showed a trend similar to the microarray results (Supporting Fig. S11B). As further confirmation, these five genes were evaluated in MHCC-97H-vector/MHCC-97H-MR cells, which showed that only PKLR among the five genes exhibited a reversed trend from those in SMMC-7721-sh-MR cells (Supporting Fig. S11C).
Additionally, the expression of SLC2A11, HK2, HK4, PFKFB2, PKM, and PKLR in the presence of Ald and SPI was measured by real-time PCR. Except PKLR, expression of these genes was not significantly affected by Ald and SPI (Supporting Fig. S12A). Effects of silence of these genes on lactate production were also detected. Lactate production was decreased by silence of these six genes (Supporting Fig. S12B).
To determine whether PKLR is directly regulated by MR, ChIP-PCR was performed in Ald-treated MHCC-97H-MR cells. The results demonstrated no significant difference in fold-enrichment between dimethyl sulfoxide–treated and Ald-treated MHCC-97H-MR cells (Supporting Fig. S11D). These results suggest that MR, as a transcription factor, does not directly bind to the promoter of PKLR; and because the expression of PKLR was negatively regulated by MR in HCC cells, we hypothesized that certain miRNAs might be the intermediators between MR and PKLR.
We have demonstrated that MR regulates HCC apoptosis, so we further analyzed our microarray data and found that expression of CASP9, a gene linked to the mitochondrial death pathway, is significantly changed. (Supporting Fig. S13A). We further confirmed that MR can directly bind to the promoter of CASP9 by ChIP-PCR assay (Supporting Fig. S13B). In SMMC-7721 cells Lenti-MR enhances and Lenti-sh-MR decreases CASP9 expression (Supporting Fig. S13C).
MR Binds to Promoter of miR-338-3p, and PKLR Is a Novel Target for miR-338-3p
To explore the probable miRNAs involved in MR-mediated regulation of PKLR expression, miRNA microarrays for SMMC-7721-vector/SMMC-7721-sh-MR cells were utilized. The resulting data indicated that expression of 89 miRNAs was altered in SMMC-7721-sh-MR cells (fold change ≥2 or ≤0.5) (Supporting Fig. S9B). A total of five miRNAs involved in tumorigenesis were selected for assessment by real-time PCR (Supporting Table S2). The results demonstrated that the five miRNAs—miRNA-95, miRNA-210, miRNA-338-3p, miRNA-101-3p, and miRNA-186-5p—showed a similar trend in expression as detected by the microarray (Fig. 4A). Then, ChIP-PCR was performed to verify whether MR could directly bind the promoters of these five miRNAs. The results showed that miRNA-186-5p, miRNA-95, and miRNA-338-3p were significantly enriched in Ald-treated MHCC-97H-MR-HA cells compared to dimethyl sulfoxide–treated MHCC-97H-MR-HA cells (Fig. 4B). Similar results were obtained in Ald-treated SMMC-7721-MR-HA cells (Fig. 4C). These data provide evidence that MR directly binds with the promoters of these three miRNAs and regulates their expression at the transcriptional level.

The MR binds to the promoter of miR-338-3p, and PKLR is a novel target for miR-338-3p. (A) Expression of five miRNAs selected according to miRNA microarray verified by probe quantitative real-time PCR in SMMC-7721-vector/SMMC-7721-sh-MR cells. (B,C) We performed ChIP-PCR using hemagglutinin antibody to detect direct binding of MR to the promoter of miRNAs in MHCC-97H-MR-HA and SMMC-7721-MR-HA cells. (D) Direct binding of miR-338-3p to the 3′-UTR of PKLR as shown by luciferase reporter assay. (E) Western blot analysis verifying that PKLR expression is regulated by the MR-miR-338-3p axis. Abbreviations: DMSO, dimethyl sulfoxide; HA, hemagglutinin.
To determine whether these miRNAs modulate the expression of PKLR, target prediction of miRNA-186-5p, miRNA-95, and miRNA-338-3p was performed. It was found that PKLR is a predicted target gene of miRNA-338-3p in three individual databases (TargetScan, miRanda, PITA). TargetScan analysis indicated three putative binding sites for miR-338-3p in the PKLR 3′-untranslated region (UTR). The wild-type 3′-UTR of PKLR or a mutant version was fused to a firefly luciferase reporter gene to create a real-time reporter for analyzing miR-338-3p gene expression. The plasmid (containing either mutant or wild-type PKLR 3′-UTR) was cotransfected with a Renilla reporter vector into 293T cells transiently transfected with mimics of either miR-338-3p or pre-mir-338 in pcDNA3.1(+). As shown in Fig. 4D, mimics of miR-338-3p and pre-mir-338 clearly reduced the luciferase activity of the wild-type PKLR reporter, but these did not affect the mutant PKLR reporter, suggesting that miR-338-3p binds directly to the PKLR 3′-UTR.
To further verify that PKLR is regulated by the MR/miR-338-3p axis, the expression of PKLR protein was detected by Western blot analysis. The PKLR protein level was up-regulated by sh-MR. Furthermore, PKLR protein levels were significantly down-regulated by miR-338-3p, overexpression of MR, or treatment with Ald (Fig. 4E; Supporting Fig. S14A). These data offer further confirmation that PKLR is regulated by the MR/miR-338-3p axis.
MR Suppresses the Warburg Effect and Tumor Growth Through the miR-338-3p/PKLR Axis in HCC
The Warburg effect (or aerobic glycolysis) is a well-characterized metabolic alteration that ubiquitously occurs in neoplastic cells. To investigate the effect of the MR-miR-338-3p/PKLR axis on the Warburg effect, the levels of pyruvate production and lactate production and the glycolytic rate were measured in HCC cell lines. The results showed that a much higher level of lactate production was observed in SMMC-7721 cells after silencing of MR (Fig. 5A). On the other hand, overexpression of MR or miR-338-3p or treatment with Ald significantly decreased the production level of lactate (Fig. 5A,B) and pyruvate (Fig. 5C) in SMMC-7721 cells. To further verify the impact of the MR-miR-338-3p/PKLR axis on HCC glycolysis, extracellular acidification rates were measured using the XF24 Extracellular Flux analyzer (Seahorse). The rate of glycolysis and the total glycolytic capacity can be ascertained by the extracellular acidification rate data. Overexpression of MR or miR-338-3p significantly reduced the rate of glycolysis and the glycolytic capacity of SMMC-7721 cells, while sh-MR and overexpression of PKLR significantly elevated both (Fig. 5D,E). These results support the notion that activation of the MR-miR-338-3p/PKLR axis suppresses the Warburg effect in HCC cells.
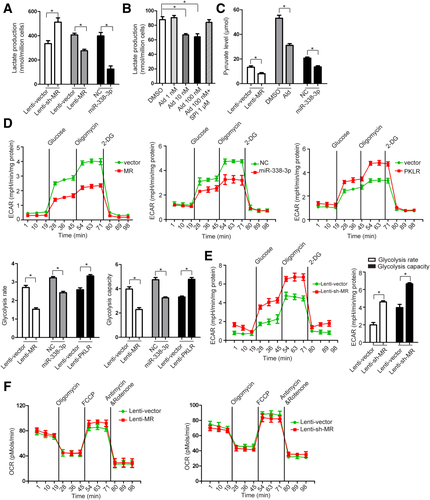
The MR suppresses the Warburg effect through the miR-338-3p-PKLR axis in HCC. (A) Alterations of lactate production in SMMC-7721 cells after MR silencing, MR overexpression, or treatment with mimics of miR-338-3p. (B) Lactate production in SMMC-7721 cells treated with aldosterone and SPI. (C) Pyruvate level in SMMC-7721 cells after MR overexpression, aldosterone treatment, or treatment with mimics of miR-338-3p. (D) Extracellular acidification rate analysis of SMMC-7721 cells after MR overexpression shows that miR-338-3p mimics treatment or PKLR overexpression. The extracellular acidification rate after glucose treatment indicates glycolysis rate. The extracellular acidification rate after oligomycin treatment indicates glycolysis capacity. (E) Extracellular acidification rate analysis of SMMC-7721 cells after MR knockdown. (F) Oxygen consumption rate analysis of SMMC-7721 cells after MR overexpression and MR knockdown. Abbreviations: 2-DG, 2-deoxy-d-glucose; DMSO, dimethyl sulfoxide; ECAR, extracellular acidification rate; OCR, oxygen consumption rate.
To investigate whether MR has any effects on oxidative phosphorylation, we further examined the oxygen consumption rate, which is an indicator of mitochondrial respiration and oxidative phosphorylation. The results showed that MR has no effect on oxidative phosphorylation (Fig. 5F).
Because MR exhibited a suppressive role in HCC growth in these experiments, the functional roles of miRNA-338-3p and PKLR on HCC growth were investigated. As expected, miRNA-338-3p significantly suppressed HCC cell viability (Supporting Fig. S14B), both inducing a G1-phase cell cycle arrest (Supporting Fig. S14C) and promoting cell apoptosis in SMMC-7721 cells (Supporting Fig. S14D). Additionally, the results showed that silencing of PKLR using an siRNA approach led to clearly repressed cellular proliferation in MHCC-97H cells (Supporting Fig. S15A). Notably, overexpression of PKLR significantly enhanced cell viability in SMMC-7721 cells (Supporting Fig. S15B). In these experiments, overexpression of PKLR was also found to induce a significant decrease in the population of G0/G1-phase cells with a concomitant increase in S-phase SMMC-7721 cells (Supporting Fig. S15C).
Genetic and Epigenetic Silencing of MR in HCC
The expression of MR was evaluated in HCC tissues, corresponding noncancerous liver (CNL), and human liver cancer cell lines. Expression levels of MR in HCC tissues and their CNL tissues were compared using quantitative real-time PCR for 24 pairs of HCC/CNL tissues and by western blot for 15 pairs of HCC/CNL tissues. The results showed that the expression level of MR was significantly lower in HCC tissues than in CNL tissues (Fig. 6A,B). We then evaluated the expression of MR in 202 paired HCC and CNL tissues by immunohistochemical staining. The results showed that the expression of MR protein was down-regulated in 81.1% (164/202) of HCC patients (Fig. 6C). Furthermore, the mRNA expression level in 15 HCC cell lines and the immortalized human liver cell line THLE-2 was measured by quantitative real-time PCR. The results revealed that, except for PLC/PRF/5 and C3A, mRNA expression in most tested HCC cells was lower than that in THLE-2 cells (Fig. 6D).
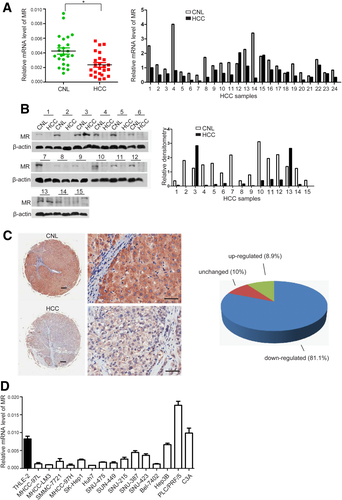
Expression of MR is down-regulated in HCC. Expression levels of MR in HCC tissues and CNL tissues by quantitative real-time PCR for 24 pairs of HCC/CNL tissues (A) and Western blot of 15 pairs of HCC/CNL tissues (B). (C) Immunohistochemical staining of MR in 202 paired HCC and CNL tissues. Scale bars: left panel = 100 μm, right panel = 50 μm. (D) Level of mRNA expression in 15 HCC cell lines and immortalized human liver cell line THLE2 as measured by quantitative real-time PCR.
Dysregulation of gene expression in cancer may be caused by genetic or epigenetic mechanisms or both. Because MR is located at chromosome 4q31.1, a region that is frequently lost in HCC,18 we investigated whether genetic aberrations were present near the MR locus in HCC specimens. Fluorescent in situ hybridization was performed for this purpose, using the BAC clone RP11-58A19, which spans one-half of the MR locus at 4q31.1 (Fig. 7A), as the region-specific probe (red). The deletion was detected by hybridizing the probe to interphase chromosomes from 45 paired samples of HCC tissue and adjacent noncancerous tissue. As a control, a probe specific to the centromere of chromosome 4 (CEP4, green) was used. A total of 100 cells per sample were sampled to observe positive-MR (red) and positive-CEP4 (green) in every cell. The results showed that there was approximately 60% MR loss in HCC tissues (27 out of 45). Among these samples, 37.8% contained a hemizygous deletion (17 out of 45), 2.2% were homozygous (1 out of 45), and 20% had monosomy (9 out of 45). However, there was only 6.1% MR deletion in adjacent noncancerous tissue (2 out of 33) (Supporting Table S3). Figure 7B shows representative fluorescence in situ hybridization data.
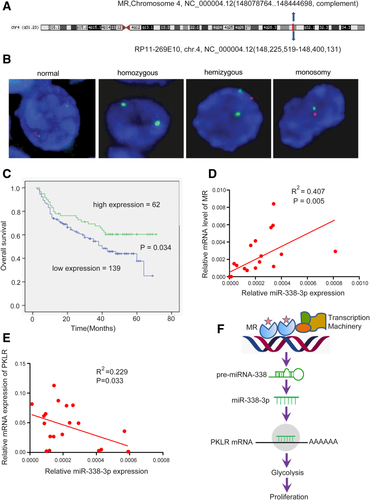
Genetic silencing of MR in HCC and the MR-miR-338-3p-PKLR axis in patient clinical outcomes. (A) The BAC clone RP11-58A19 in 4q31.1. (B) Representative image of fluorescence in situ hybridization of MR (red) and CEP4 (green) in HCC tissue. (C) Association of MR expression with overall survival calculated by the Kaplan-Meier method and analyzed by the log-rank test. (D) The relationship between MR and miR-338-3p expression. (E) The correlation of miR-338-3p expression with PKLR expression. (F) Schematic presentation illustrating suppression of the Warburg effect by the MR-miR-338-3p-PKLR axis in HCC.
Epigenetic mechanisms were also investigated in the silencing of MR in HCC. The HCC cell lines were treated with 5-aza-2′-deoxycytidine, a specific methyltransferase inhibitor, and trichostatin A and sodium butyrate, two histone deacetylase inhibitors. The results indicated that methylation did not occur in two of the HCC cell lines tested (MHCC-97H, Huh7; Supporting Fig. S16A). However, histone deacetylation was present in four of the tested HCC cell lines (MHCC-97H, Huh7, Bel-7402, SNU-449; Supporting Fig. S16B-D). Cell viability with inhibitors of acetylation (trichostatin A, sodium butyrate) and methylation (5-aza-2′-deoxycytidine) was tested. The results indicated that cell viability was inhibited by trichostatin A, sodium butyrate, and 5-aza-2′-deoxycytidine in both MHCC-97H and Huh7 cells (Supporting Fig. S17). These data suggest that histone deacetylation may contribute to the down-regulation of MR in HCC. Together, these data support a model of HCC where MR is down-regulated through both genetic and epigenetic mechanisms.
Clinical Outcomes for Patients Stratified According to the MR-miR-338-3p/PKLR Axis
To investigate the clinical significance of MR in HCC, the expression status of MR along with other clinical parameters were assessed in 202 HCC patients. To estimate the association of MR with tumor biological behaviors, comparisons of the clinical pathological features with MR expression were made. The results demonstrated that MR expression correlated with satellite tumor, tumor size, the presence of complete tumor encapsulation, and tumor-node-metastasis stage (Table 1). Patients were then stratified into two groups: (1) with low expression of MR, given a score of 0, and (2) with high expression of MR, given a score of 1. There were significant survival differences between the two groups. In general, a high expression level of MR was associated with improved overall survival (P < 0.001) (Fig. 7C). It has been shown that miR-338-3p is down-regulated in HCC and that its expression is associated with increased clinical aggressiveness.19 The relationship among MR, miR-338-3p, and PKLR was evaluated in clinical samples. Levels of miR-338-3p both in HCC tissues and in HCC cell lines were found to be positively correlated with MR expression and inversely correlated with PKLR expression (Fig. 7D,E; Supporting Fig. S18A,B). These data show that MR may act as an indicator for HCC progression and prognosis and that the MR-miR-338-3p/PKLR axis may play an important role in HCC progression.
| Variable | MR | ||
|---|---|---|---|
| High | Low | P | |
| Age (years) | |||
| ≤50 | 27 | 74 | 0.086 |
| >50 | 37 | 64 | |
| Gender | |||
| Female | 58 | 117 | 0.251 |
| Male | 6 | 21 | |
| Alpha-fetoprotein (ng/mL) | |||
| ≤25 | 26 | 39 | 0.064 |
| >25 | 38 | 99 | |
| Gamma-glutamyltransferase (U/L) | |||
| ≤50 | 20 | 46 | 0.461 |
| >50 | 44 | 92 | |
| Liver cirrhosis | |||
| Yes | 8 | 18 | 0.561 |
| No | 56 | 120 | |
| Tumor multiplicity | |||
| Single | 54 | 114 | 0.835 |
| Multiple | 10 | 24 | |
| Tumor satellite | |||
| Yes | 38 | 107 | 0.017 |
| No | 26 | 31 | |
| Tumor encapsulation | |||
| Incomplete | 57 | 84 | 0.042 |
| Complete | 9 | 52 | |
| Tumor thrombus | |||
| Yes | 55 | 105 | 0.053 |
| No | 7 | 35 | |
| Tumor differentiation | |||
| I | 0 | 3 | 0.561 |
| II | 19 | 39 | |
| III | 44 | 97 | |
| Vascular invasion | |||
| Yes | 9 | 48 | 0.075 |
| No | 54 | 91 | |
| Tumor size (cm) | |||
| ≤5 | 43 | 62 | 0.002 |
| >5 | 21 | 86 | |
| TNM stage | |||
| I | 18 | 71 | 0.010 |
| II | 15 | 13 | |
| III | 11 | 14 |
- The expression status of MR along with other clinical parameters was assessed in 202 HCC patients. To estimate the association of MR with tumor biological behaviors, comparisons of the clinical pathological features with MR expression were made. The results demonstrated that MR expression correlated with satellite tumor, tumor size, presence of complete tumor encapsulation, and TNM stage.
- Abbreviation: TNM, tumor-node-metastasis.
Discussion
Mineralocorticoid receptor (locus symbol NR3C2) is a cytoplasmic steroid-responsive receptor that localizes to the nucleus upon activation. After binding its physiologic ligands (e.g., Ald), MR translocates to the nucleus to activate the expression of multiple target genes (including GILZ, SGK-1, and CNKSR3).20, 21 Classically it regulates water and electrolyte homeostasis and controls blood pressure.22 Recently, a new exciting era of MR biology began with identification of MR in different nonepithelial tissues such as brain, heart, vessels, macrophages/monocytes, and adipose tissue. The distribution of MR in such a wide variety of tissues suggests novel and unexpected roles of MR in other biochemical processes, such as in energy metabolism and inflammation.23 It has also been well established that MR plays important roles in many pathophysiological conditions, including fibrosis, hypertension, renal disease, and remodeling processes in the cardiovascular system.24, 25
Many novel biological functions of MR were only recently appreciated, and little is known about its potential role in cancer development and progression. Dysregulation of MR expression has been described in colorectal and lung cancers.26, 27 The decreased expression of MR is closely correlated with decreased patient survival and increases tumor angiogenesis in colorectal carcinoma, but the underlying mechanism is unclear.
In the present study, we demonstrated that the MR-miR-338-3p/PKLR axis played an important role in HCC progression. By analyzing 202 HCC tissues, we found that expression of MR was down-regulated in 81% of HCC samples and closely associated with patient prognosis. It was reported that the expression of miR-338-3p was also down-regulated in HCC.28 Our further study revealed that the expression of miR-338-3p was positively correlated with MR expression and inversely correlated with PKLR expression. The expression of MR correlated with clinicopathological features of HCC, such as tumor size, satellite tumor, the presence of complete tumor encapsulation, and tumor-node-metastasis stage. In vitro and in vivo functional studies showed that MR suppresses HCC cell proliferation. Further studies revealed that MR could directly regulate transcription of miRNA-338, which also plays a suppressive role in HCC cell proliferation. Silencing of PKLR was also found to inhibit cell proliferation in vitro in our study. It has been reported that miR-338-3p is a tumor suppressor in multiple types of human cancers, including non-small-cell lung carcinoma,29 hepatocellular carcinoma,28 neuroblastoma,30 and gastric cancer,31 by directly targeting RAB14, SMO, P-Rex2a, and SSX2IP, respectively. Here, we found that PKLR, an isozyme of pyruvate kinase, is a direct target of miR-338-3p in HCC. Although PKLR has been known for several decades, there are only a few reports concerning its role in cancer. Silencing of PKLR suppresses autophagosome formation in MCF-7 human breast cancer cells under optimal growth conditions.32
Our further mechanistic studies revealed that MR exerts its tumor-suppressive roles by modulating cancer metabolism. Excess Ald exhibited a detrimental effect on normal metabolism.22 Disturbances of glucose metabolism, in particular, have been seen due to inappropriate activation of MR; and these are frequently observed in patients with primary aldosteronism as well as in obese subjects. In this study, we demonstrated that MR suppressed aerobic glycolysis by modulating the miR-338-3p/PKLR axis in HCC.
Previous studies have indicated that miR-338-3p might be a key player in energy metabolism. It has been reported that miR-338-3p plays a crucial role in compensatory β-cell mass expansion occurring under different insulin resistance states, such as pregnancy and obesity. It has also been identified as one of the miRNAs involved in the regulation of β-cell function in obesity models of type 2 diabetes.33 Also, miR-338-3p was found to be a circulating miRNA that arises in response to acute aerobic exercise and endurance training.34
It has been widely accepted that steroid hormone receptors play very important roles in cancer, mainly by functioning as transcriptional factors, inducing or suppressing expression of certain oncogenes (e.g., extracellular signal–regulated kinase, bcl-2, p53) or tumor suppressor genes (e.g., nuclear factor κB, Fas).35 Sometimes steroid hormone receptors exert their functions through nongenomic pathways by crosstalking with growth factors (e.g., insulin-like growth factor, transforming growth factor, vascular endothelial growth factor),36 membrane receptors (e.g., insulin-like growth factor receptor, epidermal growth factor receptor, platelet-derived growth factor receptor),24 or even key signaling molecules (e.g., phosphoinositide 3-kinase, protein kinase C, mitogen-activated protein kinase).37
In this study, we have unveiled, for the first time, that MR exerts a suppressive role in HCC progression by regulating the expression of miRNA-338-3p, which directly targets PKLR and suppresses the Warburg effect. These data provide evidence that the MR-miR-338-3p/PKLR axis plays an important role in cancer progression by modulating glycolytic metabolism in HCC.
References
Author names in bold designate shared co-first authorship.


