Machine learning in neurological disorders: A multivariate LSTM and AdaBoost approach to Alzheimer's disease time series analysis
Abstract
Introduction
Alzheimer's disease (AD) is a progressive brain disorder that impairs cognitive functions, behavior, and memory. Early detection is crucial as it can slow down the progression of AD. However, early diagnosis and monitoring of AD's advancement pose significant challenges due to the necessity for complex cognitive assessments and medical tests.
Methods
This study introduces a data acquisition technique and a preprocessing pipeline, combined with multivariate long short-term memory (M-LSTM) and AdaBoost models. These models utilize biomarkers from cognitive assessments and neuroimaging scans to detect the progression of AD in patients, using The AD Prediction of Longitudinal Evolution challenge cohort from the Alzheimer's Disease Neuroimaging Initiative database.
Results
The methodology proposed in this study significantly improved performance metrics. The testing accuracy reached 80% with the AdaBoost model, while the M-LSTM model achieved an accuracy of 82%. This represents a 20% increase in accuracy compared to a recent similar study.
Discussion
The findings indicate that the multivariate model, specifically the M-LSTM, is more effective in identifying the progression of AD compared to the AdaBoost model and methodologies used in recent research.
Abbreviations
-
- AD
-
- Alzheimer's disease
-
- ADNI
-
- Alzheimer's disease neuroimaging initiative
-
- AI
-
- artificial intelligence
-
- ANN
-
- artificial neural Network
-
- AUC
-
- area under the ROC curve
-
- BiPro
-
- bidirectional progressive recurrent network with imputation
-
- CNN
-
- convolutional neural network
-
- CSF
-
- cerebrospinal fluid
-
- CN
-
- cognitively normal
-
- DL
-
- deep learning
-
- EEG
-
- electroencephalogram
-
- F1
-
- F1 score
-
- FP
-
- false positive
-
- FN
-
- false negative
-
- GRUs
-
- gated recurrent units
-
- MCI
-
- mild cognitive impairment
-
- ML
-
- machine learning
-
- MMSE
-
- mini-mental state examination
-
- MRI
-
- magnetic resonance imaging
-
- M-LSTM
-
- multivariate long short-term memory
-
- PET
-
- positron emission tomography
-
- PICU
-
- pediatric intensive care unit
-
- RF
-
- random forest
-
- ROC
-
- receiver operating characteristic
-
- RNN
-
- recurrent neural network
-
- SMA
-
- simple moving average
-
- SVM
-
- support vector machine
-
- TADPOLE
-
- the Alzheimer's disease prediction of longitudinal evolution
-
- TP
-
- true positive
-
- TN
-
- True negative
1 INTRODUCTION
Alzheimer's disease (AD) is an irreversible neurological condition that impairs patients' memory, cognition, and behavior [1]. The complexity of analyzing AD biomarkers and the variability of measures obtained from different imaging modalities challenges the effective early identification and treatment of AD [2]. Given the lack of significant advancements in developing modalities to treat AD, previous research has looked at providing feasible and affordable options to offer AD patients the care and treatment they need. For instance, the studies reported in Gavidia-Bovadilla and colleagues [3-5] aim at helping AD patients in their day-to-day activities and offer some forms of neural training.
However, detecting how AD is gradually progressing in a patient is crucial to implement early intervention plans [6]. Traditional time series-based methods and machine learning (ML) algorithms have been widely employed in the literature to categorize and predict AD severity, such as the works described in Gavidia-Bovadilla and colleagues [3, 4, 7-11]. Despite these encouraging developments, several complex modeling issues remain unexplored [12]. Most of the literature has focused on modeling the course of diseases rather than predicting their progression. This entails estimating the state of disease progression at known times based on the data available or in the event of limited observations, concentrating primarily on identifying the stages of its progression.
Various ML approaches have been used in the literature to find biomarkers for AD progression and optimize detection performance. A widely used approach to address image classification problems is the support vector machine (SVM). SVM was used in several studies to predict AD progression, such as in Zhang and colleagues [13-18]. In Zhang et al. [13], a multitask learning approach combined with SVM was employed to detect AD progression with 73.9% accuracy and 68.6% sensitivity. The study reported in Cheng et al. [14] achieved an accuracy of 79.4% and a sensitivity of 84.5%.
A linear discriminant analysis based on the cortex thickness data was utilized, which showed 63% sensitivity and 76% specificity [19]—the results for AD progression detection improved by integrating multimodality data and removing redundant AD-related biomarkers from modalities. Using a combination of cerebral spinal fluid, magnetic resonance imaging (MRI), and cognitive performance biomarkers, 68.5% accuracy, 53.4% sensitivity, and 77% specificity were noted in the studies reported in Ewers et al. [20] and Kim et al. [21]. These studies also used deep convolutional autoencoders to examine the data analysis process of AD progression using MRI data. While previous studies have investigated modeling AD, the AD progression issues using recurrent models remain unexplored. Given that AD is a progressive and irreversible disease, it is challenging to detect its progression over time using only the cognitive features of a patient. However, the timely structural changes from cognitive normal (CN) to mild cognitive impairment (MCI) and from MCI to AD can help trace the features affecting the progression of the disease [22].
To this end, as far as our knowledge is concerned, a single study has worked on the detection of patients with a progressive nature [23], which has utilized a univariate recurrent neural network (RNN). In contrast, our study proposes a multivariate long short-term memory (M-LSTM) for the detection of AD subjects with a progressive nature. The study has focused on two types of experiments. The first experiment involves patients who are in a state of progressive disease. Detection is then carried out by confirming their progressive and nonprogressive states. In the second experiment, the study involved only patients whose disease status was updated with time. It then observes the spread of the disease over some time. The performance of the proposed M-LSTM model is evaluated using The AD Prediction of Longitudinal Evolution (TADPOLE) challenge [24]. The results show that the proposed model outperformed the competing models (BiPro and AdaBoost) regarding detection.
The remainder of this paper is structured as follows. Section 2, 2 briefly describes the related studies on predictive modeling. Section 3, 3 presents the details of the proposed methodology. Sections 4, 4 and 5 report the experiments that compare the proposed model's performance with other published approaches. Lastly, Section 6 presents the conclusions of this study.
2 BACKGROUND
RNNs have been widely used in the literature to identify patterns in time series data [25]. Recent studies have shown the success of RNNs in disease detection and prediction. Examples include using gated recurrent units (GRUs) as a diagnostic tool [26]. Moreover, GRU was also used to predict the medication needed for patients' subsequent visits in the early onset of cardiac failure [27]. LSTM models are also used to predict multiple conditions' onset [28]. In addition, LSTM is used for the diagnostic classification of patients in the pediatric intensive care unit (PICU) [29]. The relevant studies have applied different RNN models for medical detection by using longitudinal data on a patient over time.
Research into the detection of AD progression can be classified into three subareas: AD progression categorization [30], AD progression modeling [31, 32], and AD progression estimation [33]. In the categorization framework, studies strive to determine the patient's status regarding non-conversion or conversion over time. Those with progressive MCI are distinguished from patients with stable MCI by learning deep nonlinear representations of the neuroimaging data as the output of a convolutional neural network [34]. In terms of the modeling, a study used a many-to-one extended RNN architecture to facilitate the temporal shift to mimic AD progression in patients on successive visits [35]. The method covered a variety of visit periods of AD subjects. In addition, the Bayesian progression score model is suggested to predict the biomarker trends from normal to MCI and AD [31]. In the context of estimation, a study presented a multisource multitask learner to estimate cognitive scores, such as mini-mental state examination (MMSE) and AD assessment scale-cognitive subscale [2]. These scores may be used to measure the degree and progression of cognitive impairment caused by AD. With the help of recurrent components, valid observations, and static relations considered, the temporal relation for imputation for AD [36].
Contrary to a standard bidirectional RNN, the timing of the inputs to the salient layers is reversed in a forward-and-backward direction. These imputed values were dynamically updated during training until they were optimal (dynamic relation). The study used an RNN for missing value imputation in time series data and then fed the imputed values to an LSTM cell to forecast both the diagnosis of AD and MRI biomarkers [37]. The model inspects the temporal and multivariate relations of measurements (dynamic relations) for missing value imputation (and is called LSTM-I in our comparisons below). Another study proposed a minimal RNN called MinRNN to predict patients' clinical diagnoses, cognition, and ventricular volume [38]. Their model has fewer parameters than other RNN models, such as the LSTM, and therefore is less prone to overfitting [38]. A study modified the LSTM cell by using a progressive module to compute the progression score of each biomarker between the given time point and the baseline through a negative exponential function [39].
- (a)
The proposal of an end-to-end approach uses missing value restoration, data filtration, and normalization to model AD disease progression in a patient.
- (b)
A novel M-LSTM is utilized with the proposed preprocessing. The model detects the patients in a progressive disease state and classifies whether their AD is in a progression or nonprogression state. In addition, the progression of the disease was examined only in patients whose disease state was updated.
- (c)
The performance of the model was evaluated using a public data set. The proposed model was also generalized by testing it using cross-validation. The model encompassed several new methods to analyze the disease progression, utilizing cognitive and neuroimaging data. Compared to the state-of-the-art literature [23], our proposed method has almost 20% better classification accuracy.
3 METHODS
This study examined the detection of AD progression using AdaBoost, an ensemble ML model, and M-LSTM, a deep recurrent network. Two experiments are performed on the TADPOLE challenge data set [24] cohort from the Alzheimer's Disease Neuroimaging Initiative (ADNI) database, which contains ADNI-1, ADNI-2, and ADNI-GO. The first experiment involved patients with AD progression and detected their progressive or nonprogressive states with the help of AdaBoost. In the second experiment, the study considered only the patients whose disease status was updated with time and observed the disease's progression over time. The data set is prepared and preprocessed, followed by progressive nature detection using M-LSTM. Finally, the performance of the proposed methodology is evaluated on the data set, and the results are compared with the state-of-the-art literature.
3.1 Materials and settings
This study used a data set called the TADPOLE challenge, which includes information from 13,915 visits made by 2155 patients. Of these patients, 409 had just one visit, while the remaining 1746 had multiple visits, totaling 13,506 visits with an average of 7.74 per patient. We observed 535 patients whose disease progressed over time, that is, from CN to MCI or from MCI to AD. These 535 patients were labeled as having progressive disease, and together, they made 5254 visits, averaging 9.8 visits per patient. For the remaining 1211 patients, their disease state stayed the same as it was during their first visit, and they were classified as nonprogressive, meaning their disease did not get worse. Only 142 patients had consulted a doctor in a year.
In comparison, 1069 subjects with a nonprogressive nature have seen a consultant physician in 1 year. In more than 2 years, 894 patients with a nonprogressive nature have seen a consultant. The number of patients with a nonprogressive nature who have visited a specialist doctor in over 3 years is 554. Patients' visits are summarized in Table 1. Given that AD takes about 3 years to develop, a research study has considered nonprogressive patients who have seen a consultant for over 3 years [35]. A patient is deemed nonprogressive if their disease status has not changed during the 3 years of the study. Table 2 shows some comprehensive statistics about the patients with and without AD. TADPOLE data has been preprocessed and sorted based on the patients' visits. The TADPOLE data set contains vital information such as a patient's initial status, the number of visits per month, the updated status after each visit, and all the cognitive and neuroimaging indicators. Unfortunately, the labels for some visits are missing.
| Patient group | Number of patients | Number of visits | Average visits per patient | Disease progression |
|---|---|---|---|---|
| Progressive | 535 | 5254 | 9.8 | Yes |
| Nonprogressive | 1211 | 8252 | 6.8 | No |
| One visit | 409 | 409 | 1 | N/A |
| Total | 2155 | 13,915 | 6.5 | N/A |
- Abbreviation: TADPOLE, The Alzheimer's Disease Prediction of Longitudinal Evolution; N/A, not applicable.
| Features | Progressive patients | Nonprogressive patients |
|---|---|---|
| Total | 535 | 554 |
| Gender | ||
| Male | 315 | 307 |
| Female | 220 | 247 |
| Marital status | ||
| Married | 424 | 396 |
| Never married | 13 | 20 |
| Widowed/divorced | 98 | 132 |
| Race | ||
| Asian | 8 | 10 |
| Black | 17 | 21 |
| White | 505 | 517 |
| Ethnicity | ||
| Hispanic | 14 | 15 |
| Not Hispanic | 518 | 536 |
| Age average | 76.06 | 70.64 |
- Abbreviation: AD, Alzheimer's disease.
Additionally, some patients' visits had no record, such as no cognitive scores or neuroimaging information were recorded. Discarding the missing data is one of the techniques used to address the problem of missing records. Moving average filling is an alternative technique used to address this problem. This is where missing data is filled from previously labeled data. The moving average filling method has been used in this research to address the missing data problem.
3.2 Data preprocessing for Experiment 1
The TADPOLE data set contains missing information, necessitating a series of preprocessing steps. Initially, a data filtration process was employed to eliminate less informative entries. Subsequently, a missing data handling technique was applied to impute values for the absent labels, ensuring a comprehensive data set. Lastly, data normalization procedures were executed to standardize the information, facilitating consistent and comparable features across the data set.
3.2.1 Filtration
Some neuroimaging or cognitive features had several missing values. Therefore, features with more than 50% missing values were removed from the first experiment. Additionally, the records collected from some patients did not provide conclusive neuroimaging or cognitive traits. Hence, visits without a record were removed from the data to prevent the model from overfitting.
3.2.2 Handle missing data
3.2.3 Data normalization
3.2.4 Model training for Experiment 1
In the first experiment, an ensembled ML classifier, AdaBoost, was trained on the preprocessed data. To improve the classifier accuracy, AdaBoost combines other classifiers. The cleaned, filtered, and preprocessed data were split into 80:20, and fivefold cross-validation was performed during the model training and testing.
3.3 Methodology for Experiment 2
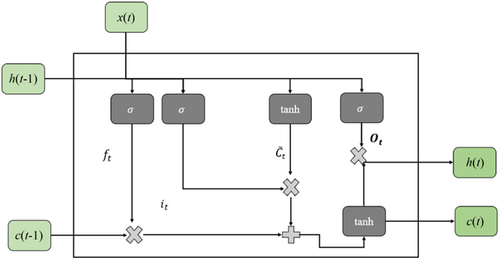
According to Equation (6), the moving average filter can be formulated quickly on real-time data using a circular or first in, first out (FIFO) buffer with three arithmetic operations. First, the sampling window is equal to the size of the data set at the first filling of the FIFO or circular buffer. Thus k = n, and the average calculation is done as a cumulative moving average. An M-LSTM is trained on the cleaned data set after data preprocessing. The LSTM structure is provided in the following section.
3.3.1 M-LSTM
3.3.2 Data processing for Experiment 2
Experiment 2 studies the patients who have visited the consultants for over 3 years. The total number of these patients is 1030, who have made 10545 visits to the specialists. On average, each of the 476 patients with a progressive nature has made 10.56 visits to the consultants. The number of patients with a nonprogressive nature was 554, who consulted 5519 times, averaging 9.96 visits per patient. The numbers of patients with more than 3 years of visits are given in Table 3. After applying the SMA, the total number of visits increased from 10,545 to 14,420. The data preprocessing follows the settings described in Experiment 1.
| Processing | Type (nature) | Patient | Visits | Average | Standard deviation |
|---|---|---|---|---|---|
| Before data preparation | Total | 1030 | 10,545 | 10.23 | 3.67 |
| Progressive | 476 | 5026 | 10.56 | 3.98 | |
| Nonprogressive | 554 | 5519 | 9.96 | 3.36 | |
| After data preparation | Total | 1030 | 14,420 | 10.23 | 3.67 |
| Progressive | 476 | 6664 | 14 | – | |
| Nonprogressive | 554 | 7756 | 14 | – |
- Note: Represents not taking standard deviation.
The data set is preprocessed for Experiment 2 with filtration, missing data handling, and normalization like the processes conducted in Experiment 1. Then, the data set was fed to the M-LSTM model using the process detailed in Section 3.3.1. Finally, the M-LSTM model is trained as a classification problem on the preprocessed data set. The model architecture used in this study is given in Table 4.
| Layer type | Output shape | Parameters |
|---|---|---|
| M-LSTM | (None, 256) | 278,528 |
| Fully connected | (None, 128) | 32,896 |
| Dropout | (None, 128) | 0 |
| Fully connected | (None, 2) | 258 |
| Total parameters: 311,682 | ||
| Trainable parameters: 311,682 | ||
| Nontrainable parameters: 0 | ||
- Abbreviation: M-LSTM, multivariate long short-term memory.
4 RESULTS
4.1 Experiment 1
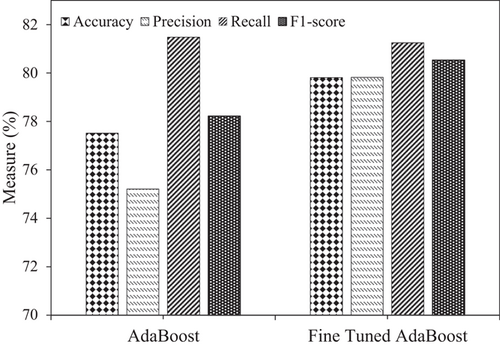
After five-cross validation, the AdaBoost model reported an average accuracy, precision, recall, and F1 score of 77.52%, 75.21%, 81.48%, and 78.22%, respectively. After tuning the model's parameters, the accuracy improved to ∼80%. Previously, the best accuracy to classify AD as progressive or nonprogressive was 58.47% [23]. The achieved accuracy with AdaBoost with effective preprocessing has improved by 21.34% compared to the literature, reaching 80%. Figure 2 demonstrates the model's performance in Experiment 1 regarding accuracy, precision, recall, and F1 score. AdaBoost models have performed well and better after fine-tuning.
To demonstrate the effectiveness of the proposed model with the baseline work presented in Ho et al. [23], Table 5 provides the accuracy, precision, and recall of both models for AD progression and nonprogression classification, respectively. There is a significant increase in the observed accuracy with AdaBoost. The accuracy and precision of 58.47% and 59.25%, respectively, are increased with the BiPro [23] to 77.52% and 75.21% with AdaBoost. A significant increase in accuracy of 21.34% and precision of 20.57% is achieved with our proposed methodology. The confusion matrix for AD progression and nonprogression is illustrated in Figure 3.
| Model | Accuracy (%) | Precision (%) | Recall (%) |
|---|---|---|---|
| BiPro [23] | 58.47 | 59.25 | 57.78 |
| AdaBoost | 77.52 | 75.21 | 81.48 |
| Fine Tuned AdaBoost | 79.81 | 79.82 | 81.25 |
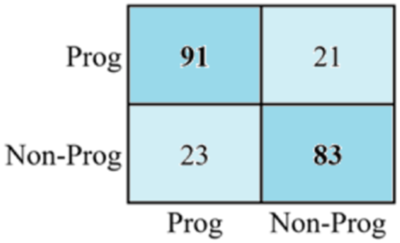
The first-row cell in the first column represents true positives. It indicates that 91 positive instances have been classified correctly. Similarly, the first-row cell in the second column indicates a false positive, meaning 21 negative values were confused with positive labels. The value of the second-row cell in the first column represents a false negative, meaning that 23 of the positive labels were identified as negative. Finally, the values of the second-row cell of the second column show true positives, which means that 83 of the positive samples were correctly classified.
4.2 Experiment 2
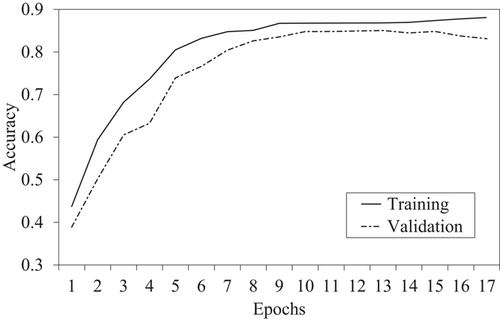
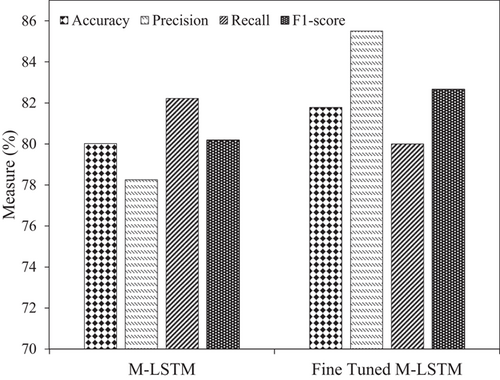
The M-LSTM model for detecting AD progression state is trained and tested on the data set with a split ratio of 80:20, that is, 80% data for training and 20% for testing. Initially, the model achieved an accuracy of ∼80%. However, after fine-tuning the parameters and hyperparameters of the M-LSTM model, the model accuracy increased to ∼82%. The training and validation accuracy of the proposed model is plotted in Figure 4.
The M-LSTM model in this study reported an average accuracy, precision, recall, and F1 score of 80.02%, 78.25%, 82.21%, and 80.18%, respectively. After tuning the model's parameters, the accuracy improved to ∼82%. Previously in Experiment 1, the best accuracy to classify the AD as progressive or nonprogressive was 79.81% with AdaBoost and 58.47% with BiPro [23]. However, the achieved accuracy with M-LSTM and excellent preprocessing was improved to ∼82%. M-LSTM improved accuracy by 23.53% over BiPro and 2.18% with AdaBoost, respectively. In addition, the precision and recall with M-LSTM increased from 78.25% and 82.21% with AdaBoost to 85.5% and 82.66%, respectively. Figure 5 shows the performance of the M-LSTM model for AD progression in Experiment 2 using accuracy, precision, recall, and F1 score, respectively.
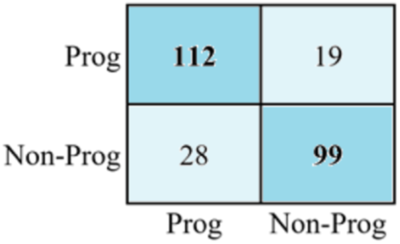
The confusion matrix for AD progression and nonprogression is illustrated in Figure 6. According to the matrix computed, 112 of the positive values were classified correctly. Similarly, the value of the first-row cell and the second column indicates a false positive which means that 19 negative values are confused with positive labels. Likewise, the number of false negatives is 28, meaning the positive labels are identified as negative. Finally, a total of 99 positive samples are correctly classified.
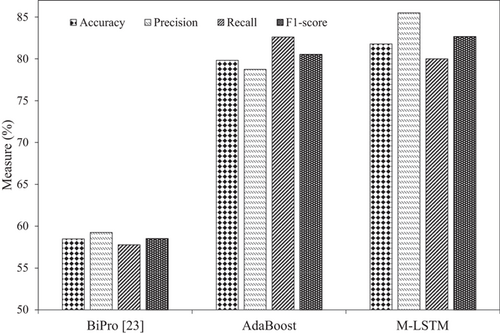
To demonstrate the effectiveness of the M-LSTM model over AdaBoost, Table 6 summarizes the accuracy, precision, recall, and F1 score. Better AD progression detection is achieved with M-LSTM compared to AdaBoost with efficient data engineering. Figure 7 demonstrates the achieved performance with both experiments and the baseline to predict AD progression. There is a 2.18% accuracy improvement with M-LSTM, the best classification accuracy for AD progression. The precision and F1 scores of 78.25% and 80.53% with the AdaBoost classifier have increased to 85.5% and 82.66%, achieving 7.25% and 2.13% gains, respectively.
| Model | Experiment | Accuracy | Precision | Recall | F1 score (%) |
|---|---|---|---|---|---|
| M-LSTM | 2 | 81.78 | 85.50 | 80.00 | 82.66 |
| AdaBoost | 1 | 79.81 | 79.82 | 81.25 | 80.53 |
- Abbreviation: M-LSTM, multivariate long short-term memory.
5 DISCUSSION
This study aimed to develop and evaluate two different models, that is, AdaBoost and M-LSTM, for classifying the nature of AD subjects as progressive or nonprogressive. In this study, we conducted two experiments to evaluate the performance of the selected models to classify patients with AD progression. The results of both experiments demonstrate significant improvements in accuracy, precision, recall, and F1 score compared to previous literature and baseline models.
In Experiment 1, the AdaBoost model achieved an average accuracy of 77.52%, precision of 75.21%, recall of 81.48%, and F1 score of 78.22% after five cross-validations. After fine-tuning the model's parameters, the accuracy improved to approximately 80%. This improvement is substantial compared to the best accuracy reported in the literature, which was 58.47% [23]. The achieved accuracy with AdaBoost, coupled with effective preprocessing, represents a remarkable 21.34% improvement over the previous best result, reaching 80%. The performance of the AdaBoost model is further visualized in Figure 2, illustrating its accuracy, precision, recall, and F1 score.
In Experiment 2, the M-LSTM model was trained and tested on the data set. The initial average performance measures achieved by the M-LSTM model were accuracy of 80.02%, precision of 78.25%, recall of 82.21%, and F1 score of 80.18%. After parameter tuning, the accuracy further improved to approximately 82%. Compared to Experiment 1, where the best accuracy was achieved with AdaBoost (79.81%) and the baseline BiPro model (58.47%) [23], the M-LSTM model demonstrated superior performance with an accuracy of approximately 82%. This improvement in accuracy corresponds to a 23.53% gain over the BiPro model and a 2.18% gain over the AdaBoost model. Additionally, the precision and recall of the M-LSTM model increased from 78.25% and 82.21% with AdaBoost to 85.5% and 82.66%, respectively. The performance of the M-LSTM model for AD progression is visualized in Figure 5, showcasing accuracy, precision, recall, and F1 score.
Our findings indicate that the M-LSTM model outperforms AdaBoost in detecting AD progression. The superiority can be attributed to the M-LSTM's ability to effectively process time series data, capturing temporal dependencies crucial in understanding disease progression dynamics. Unlike AdaBoost, which may struggle with the sequential nature of cognitive and neuroimaging indicators, M-LSTM's memory gates enable a more nuanced analysis. The broader implications of these findings in clinical settings are significant. Improved accuracy in classifying AD progression, as demonstrated by M-LSTM, holds promise for enhancing early diagnosis and treatment planning. The ability to capture temporal nuances in patient data opens avenues for more personalized and timely interventions, ultimately improving patient outcomes.
Overall, the results obtained from both experiments highlight the effectiveness of the proposed models, AdaBoost and M-LSTM, in accurately classifying AD progression. The improvements achieved in accuracy, precision, recall, and F1 score compared to the literature and baseline models demonstrate the potential of these models for clinical applications. These findings have important implications for the early diagnosis and treatment of AD, as accurate classification of disease progression can aid in implementing appropriate interventions.
6 CONCLUSIONS
AD is an irreversible neurological condition that impairs memory, cognition, and behavior. Therefore, early detection is crucial to halt its progression. Timely identification of structural changes from CN to MCI and MCI to AD can aid in detecting progression factors to halt AD progression. Various ML and deep learning models are used for the detection process. This study performed two experiments, that is, one using an ensemble ML model, AdaBoost, and the other using the deep learning model, M-LSTM. First, an efficient preprocessing pipeline for the TADPOLE data set is introduced before digging into the detection part of the progression state. AdaBoost is applied to the prepared data set and results in the detection of subjects involved in AD progression. Different performance measures show better results than a recent state-of-the-art method, BiPro. Furthermore, the second experiment observed the disease's spreading over time using M-LSTM, detected the subject's progressive nature regarding AD, and outperformed the AdaBoost.
AdaBoost is an ensemble ML model that trains the classifier iteratively on the prepared samples, which results in better performance than other classical ML methods. Similarly, M-LSTM is a powerful DL model that uses memory gates to process time series data. However, training the M-LSTM for a classification problem is more challenging and time-consuming than training AdaBoost. But the results achieved on the prepared data set from M-LSTM are more convincing than AdaBoost and a recent literature method. This research has preprocessed an already existing data set, which is collected for stages detection rather than the detection of AD progressive nature. Furthermore, the preprocessing data pipeline used in this research can be further enhanced by applying custom preprocessing steps rather than standard steps.
Deep learning models are powerful but require excessive computational power and time to process time series data. Most of the datasets have limited information and are unlabeled. Preprocessing the data set and labeling could be useful to avoid the model's overfitting and underfitting problems because the more data available, the better the detection of the AD progression state will be.
AUTHOR CONTRIBUTIONS
Muhammad Irfan: Conceptualization; software, formal analysis; investigation; data curation; writing—original draft preparation; visualization. Muhammad Irfan and Seyed Shahrestani: Methodology. Muhammad Irfan, Seyed Shahrestani, and Mahmoud Elkhodr: Validation. Seyed Shahrestani and Mahmoud Elkhodr: Resources; project administration; supervision; writing—review and editing; funding acquisition.
ACKNOWLEDGMENTS
The authors would like to express their sincere gratitude to the Alzheimer's Disease Neuroimaging Initiative (ADNI) for providing access to the TADPOLE challenge data set. ADNI is funded by the National Institute on Aging, the National Institute of Biomedical Imaging and Bioengineering, and through generous contributions from the following: AbbVie, Alzheimer's Association; Alzheimer's Drug Discovery Foundation; Araclon Biotech; BioClinica, Inc.; Biogen; Bristol-Myers Squibb Company; CereSpir Inc.; Cogstate; Eisai Inc.; Elan Pharmaceuticals Inc.; Eli Lilly and Company; EuroImmun; F. Hoffmann-La Roche Ltd. and its affiliated company Genentech Inc.; Fujirebio; GE Healthcare; IXICO Ltd.; Janssen Alzheimer Immunotherapy Research and Development LLC; Johnson and Johnson Pharmaceutical Research and Development LLC; Lumosity; Lundbeck; Merck and Co., Inc.; Meso Scale Diagnostics LLC; NeuroRx Research; Neurotrack Technologies; Novartis Pharmaceuticals Corporation; Pfizer Inc.; Piramal Imaging; Servier; Takeda Pharmaceutical Company; and Transition Therapeutics. The Canadian Institutes of Health Research are providing funds to support ADNI clinical sites in Canada. Private sector contributions are facilitated by the Foundation for the National Institutes of Health (www.fnih.org accessed on March 2023). The grantee organization is the Northern California Institute for Research and Education, and this study is coordinated by the Alzheimer's Therapeutic Research Institute at the University of Southern California. ADNI data are disseminated by the Laboratory for Neuroimaging at the University of Southern California.
CONFLICT OF INTEREST STATEMENT
The authors declare no conflict of interest.
ETHICS STATEMENT
This study exclusively utilized data from the Alzheimer's Disease Neuroimaging Initiative (ADNI) database. The ADNI was launched in 2003 as a public–private partnership, led by Principal Investigator Michael W. Weiner, MD. The primary goal of ADNI has been to test whether serial magnetic resonance imaging, positron emission tomography, other biological markers, and clinical and neuropsychological assessment can be combined to measure the progression of mild cognitive impairment and early Alzheimer's disease. For the use of ADNI data, this study adhered to all guidelines and policies set forth by the ADNI and complied with the ethical standards of the relevant institutional and national research committees. Please refer to the acknowledgment statement provided by ADNI. This research involved the use of existing, publicly available data from the ADNI. The ADNI obtained informed consent from all participants involved in the original data collection.
INFORMED CONSENT
Not applicable to this study. This research involved the use of existing, publicly available data from the Alzheimer's Disease Neuroimaging Initiative (ADNI). The ADNI obtained informed consent from all participants involved in the original data collection.
Open Research
DATA AVAILABILITY STATEMENT
The data set utilized in this study are derived from the TADPOLE challenge, which is available through the Alzheimer's Disease Neuroimaging Initiative, funded by the National Institute of Biomedical Imaging and Bioengineering. The specific data used in this paper can be made available upon reasonable request, subject to the completion of the corresponding PhD student's (Muhammad Irfan) work and in accordance with the conditions and policies governing his PhD program. Requests for access to this data should be directed to the principal supervisor, Seyed Shahrestani.


