CardioLabelNet: An uncertainty estimation using fuzzy for abnormalities detection in ECG
Abstract
Electrocardiography (ECG) abnormalities are evaluated through several automatic detection methods. Primarily, real-world ECG data are digital signals those are stored in the form of images in hospitals. Also, the existing automated detection technique eliminates the cardiac pattern that is abnormal and it is difficult to multiple abnormalities at some instances. To address those issues in this paper conventional ECG image automated techniques CardioLabelNet model is proposed. The proposed model incorporates two stages for image abnormality detection. At first fuzzy membership is performed in the image for computation of uncertainty. In second stage, classification is performed for computation of abnormal activity. The proposed CardioLabelNet collect ECG image data set for the uncertainty estimation while taking the account of various image classes which includes the global and local entropy of image pixels. For each waveform, uncertainties are calculated on the basis of global entropy. The computation of uncertainty in the images is performed with the fuzzy membership function. The spatial likelihood estimation of a fuzzy weighted membership function is used to calculate local entropy. Upon completion of fuzzification, classification is performed for the detection of normal and abnormal patterns in the ECG signal images. Through integration of stacked architecture model classification is performed for ECG images. The proffered algorithm performance is calculated in terms of accuracy for segmentation, Dice similarity coefficient, and partition entropy. Additionally, classification parameters accuracy sensitivity, specificity, and AUC are evaluated. The proposed approach outperforms the existing methodology, according to the results of a comparative analysis.
Abbreviations
-
- DNN
-
- deep neural network
-
- DSC or Dice coefficient
-
- dice similarity coefficient
-
- ECG
-
- electrocardiography
-
- FN
-
- false negative
-
- FP
-
- false positive
-
- HOS
-
- higher-order statistics
-
- KNN
-
- K-nearest neighbor
-
- ML
-
- machine learning
-
- MLP
-
- multilayer perceptron
-
- ROC
-
- receiver operating characteristics
-
- SA
-
- segmentation accuracy
-
- SVM
-
- support vector machine
-
- TN
-
- true negative
-
- TP
-
- true positive
-
- Vpc
-
- partition coefficient
-
- Vpe
-
- partition entropy
1 INTRODUCTION
Electrocardiogram (ECG) is noninvasive medical testing for evaluating the heart condition through electrical activity of the heart. ECG provides a vast range of information that reflects the cardiac physiology based on features such as morphological and temporal based on generated electrical and variation in structure [1]. The well-experienced cardiologist was able to distinguish the categorization of abnormalities in cardiology through visualization of ECG pattern waveform. Machine Learning (ML) is an effective approach for diagnostic and long-term monitoring of patients in hospitals [2]. Therefore, different ML methods have been developed for automatic detection of abnormalities type in ECG. Specifically, existing ML techniques can be categorized as feature-based methods, wavelet transform features, and higher-order statistics (HOS) [3]. With ML-based methods different classification techniques are developed such as Support Vector Machine (SVM), Decision Tree and neural network for training and anomaly detection in ECG waveform [4-6].
Another developed ML technique is the deep neural network (DNN) based technique those actively involved in the processing of medical data [7]. Those techniques are involved in the detection of abnormalities using high-level feature extraction in ECG data [8]. They rely on the representation of data through observed architecture utilized for learning. Although exiting methods provides competitive results in the available data set it is exceptionally challenged in a real clinical environment [9]. Initially, almost several existing methods rely on ECG data in real-time and store images. In ECG signal sample is observed for digital ECG which comprises of multiple clean and well-separated ECG images integrated with fuzzy. In observed ECG waveform overlapping in the waveform is observed due to the presence of different leads and auxiliary axes of the image [10]. In ECG image processing extraction of accurate information is highly challenging due to variation in the poses. Additionally, the drop in sampling rate and digital signal length below 10 leads to a drastic loss of information. In that scenario, it is essential to perform hand-crafted features and DNN based techniques [11]. In the case of hand-crafted feature methods are based on feature extraction, it involved in the conversion of the image in digital format. However, the conversion of the image in digital format leads to high time consuming and quality and recognized also limited [12]. Further, noise generated directly affects the model performance which demands strong DNN learning capabilities-based techniques. Even with strong DNN mechanism discriminative parts are presented due to noise within the images [13].
The clinical diagnosis of ECG is highly complex due to the presence of tiny and subtle variations with the categorization of abnormalities based on the categorization of change in ECG signal as P wave, Q wave, R wave, S wave, T wave, and U wave [14]. To evaluate the abnormalities it is necessary to capture parts that are critical and discriminative accurately this is challenging for image data processing with DNN methods [15]. Additionally, the existing technique concentrated on the classification of ECG signals based on the single label to perform the task in which determination is performed whether the detected abnormalities belong to a particular class or not [16]. However, in clinical ECG records indicators are based on consideration of multiple abnormalities to estimate concurrently. In those cases, the conversion of fitting the single-label classification model within a multilabel task is effective rather than the single-label classification tasks [17]. However, those techniques are not effective in an examination of the relationship that exists between those labels and the predicted label that grows exponentially with an increase in the number of categories.
Usually, in ECG waveform co-occurrence is observed with Left ventricular hypertrophy and changes in ST-T changes [18]. However, those correlations observed between labels in ECG signals are not concentrated in the existing literature. To withstand those challenges, it is necessary to consider multilabel classification issues associated with ECG waveform [19]. The developed mechanism needs to provide multilabel assign of images based on the displayed waveform to resolve multilabel classification.
An essential process in an ECG monitoring and alarm system is the early detection and warning of abrupt abnormal ECGs. However, the nonlinearity and the complexity of the abnormal ECG signals make it very difficult to detect its characteristics. This work proposed a CardioLabelNet model for ECG abnormality detection in the images. The proposed model performs image segmentation and classification. Initially, image segmentation of ECG signal is performed with the estimation of local and global entropy of signal using fuzzy membership function. In the next step, classification is performed for the classification of the normal and abnormal waveform in the ECG. The segmentation process incorporates a fuzzification process for training the data set. The training is performed with estimated global and local entropy of ECG image uncertainty. Finally, classification is performed for those extracted image data sets.
This paper is organized as follows: In Section 2 presented the related works adopted in automated ECG image classification. In Section 3 detailed view of the proposed CardioLabelNet segmentation and classification is presented. The evaluation parameters for the proposed CardioLabelNet are presented in Section 4. In Section 5 comparative analysis of the proposed CardioLabelNet with the existing technique is presented. Finally, the overall conclusion about the proposed CardioLabelNet is presented in Section 6.
2 RELATED WORKS
This section presents the review of related works in terms of image classification, mechanism and recognition. Over several years, several research concentrated on hand-crafted based ECG feature extraction with consideration of frequency domain, higher order statistics (HOS) and wavelet transforms [6]. Through extracted waveform different machine learning methods are incorporated for detection of anomaly such as SVM, Multilayer perceptron (MLP) and K-nearest neighbor (KNN) [20]. While few researcher, adopts hybrid methods for achieving significant performance measures. Additionally, application of MLP methods over images in the classification. However, that method performance over ECG is highly relies on extraction of features in ECG signals [21]. With complex feature extraction techniques and higher sampling are limited in case of ECG signals. As stated, ECG image sampling rate are minimal than that of the digital value.
In those cases, certain techniques are developed for transformation of recorded waveform from image in to digital form [22]. However, those techniques are utilizes heuristics based approach for estimation of time—consuming steps for estimation of accuracy for achieving limited output [23]. Generally, the limitations related to hand-crafted methods are high range of dependent features for data set training. Also, the performance is inadequate due to over-fitting within the ECG records. Moreover, that technique is highly complex and time-consuming for extraction of features in testing and training [24].
With application of DNNs over ECG automated interpretation technique various domains are derived for learning complex functionality with direct input mapping and output is based on hand-engineered features. Over several years, the ECG analysis is performed based on the deep learning models. In [25] developed a patient-specific ECG monitoring system with 3-layer CNN architecture. The developed technique exhibits good accuracy performance in detection of abnormalities associated with arrhythmia. In [26] implemented RNN bases model for feature learning with ECG signal based on consideration of temporal and morphological information. Similarly, [6] proposed a model for detection of arrhythmia using CNN based model. The developed model incorporates 11-layer deep learning model. In [20] developed a transformation of signal of ECG beat in to 2-D grayscale image with 2-D CNN applications. In [27] constructed a 33-layer neural network model for classification of heart rhythms under 14 groups. ECG signal is transformed based on conversion of signal from 1-D to 2-D image. However, those technique lead to separate data storage in those values are learned independently and specific criteria. Even though, general image architecture is subtle with discriminative elimination with classification of ECG signal.
Recently, with advancement of supervised based approach part-level annotations are not incorporated. In [19] constructed a spatial transformation technique for extraction of representation from images based on identification locations on the image. In [28] developed a Bilinear CNN model with feature extraction based on second-order information for discriminative convolution features based on AlexNet or VGGNet. In [29] constructed a bilinear method with representation of compact bilinear through kernel method. The analysis expressed that the computation time and learning parameters are reduced dramatically. In [30] adopted part-level approach based on top-down and domain-specific approach. Also, [31] is the representation of feature and extraction of image with concentration of information order. Generally, information feature extraction comprises of two parts involved in determination of area for estimation of features. In [32] developed a neural network-based model for effective visualization of input image. With developed model prediction accuracy is increased through gradual increase in area. In [33] developed a SENet for estimation of relationship between channels. It effectively involved in estimation of different channel weights is considered as more importance.
Real-world ECG data are primarily digital impulses that are kept in hospitals as pictures. Additionally, the current automated identification method eliminates the abnormal cardiac pattern, and in some cases it is challenging to identify several problems. The CardioLabelNet model is suggested in this research to overcome those problems using conventional ECG image automation approaches. The suggested methodology includes two steps for detecting visual abnormalities. To calculate uncertainty, fuzzy membership is first done in the image. The classification process is carried out in the second stage to calculate aberrant activity.
3 CARDIOLABELNET MODEL FOR SEGMENTATION
In this section presented about entire architecture of the proffered CardioLabelNet algorithm is presented. The suggested CardioLabelNet is employed in the image volume segmentation of the input image. The ECG images are compared in a distributed manner for global factor similarity evaluation. Image regions are segmented according to variations in signal and through the occurrences evaluation. Because it utilizes global feature assessment rather than measuring pixel-by-pixel information, the proffered CardioLabelNet system does not require any additional learning process, as does the existing technique. The proffered algorithm's performance can be determined using entropy computation and a fuzzy estimation technique.
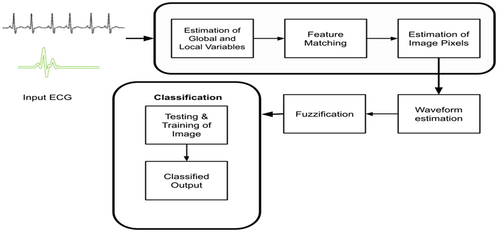
The proposed CardioLabelNet algorithm aimed to segment ECG image in to volume with elimination of high noise level and IIH. Second, it involved in 2 membership function estimation like local and global membership. At last phase, it involved in local entropy and global entropy estimation for segmentation of image using with fuzzifier. Once the fuzzy membership function is created, weights are applied to estimate the images uncertainty for waveform classification. Eventually, CardioLabelNet employed in the regularization process to eliminate trade-off in ECG images between local and global variables. Waveform intensity distribution fluctuates across ECG volumes due to the presence of noise and IIH, resulting in estimating irregular waveform uncertainty of images in ECG are produced and falls within each waveform classes and leads to reduce un-sharpness and maximal uncertainty. Through estimation of waveform entropy uncertainty is evaluated. In Figure 1 presented about entire architecture of proffered CardioLabelNet for the segmentation of Input ECG.
3.1 Uncertainty computation in fuzzy membership function
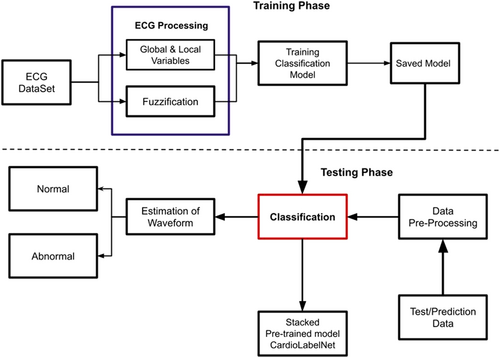
Originally, the suggested CardioLabelNet model utilized for estimating uncertainty using two entropies: local entropy and global entropy. The fuzzifier is used to measure global entropy, while spatial constrained likelihood estimation is used to estimate local entropy. After the global and local estimation fuzzy membership functions are estimated. Images local entropy is measured employing images neighborhood values and the global entropy employed in calculating image volume uncertainty. This section includes, image uncertainty calculation depending on the neighborhood and uncertainty estimating methods. With the calculation of local entropy and global entropy membership function for fuzzy are used to sort out the trade-off of images volumes parameters. The developed fuzzy technique entailed the estimation of local and global membership functions, as well as the reduction of the image volume's objective function. In the construction of clustered image waveform, the global and local membership functions produced for image volumes are regarded as unrelated independent parameters. Therefore, the final membership function is examined for weighted parameters with integration of two membership function. The ECG image volumes are segmented utilizing membership function. Figure 1 presented about entire architecture of proffered CardioLabelNet algorithm and segmentation is performed. In Supporting Information: Figure S1 overall process involved in fuzzy is presented (Figure 2).
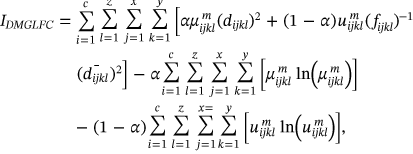 ()
()The above (1) equation presents the uncertainty of the images with the computation of global and local entropy.

 is expressed as local membership values and
  portrayed as global membership images values.
The waveform parameters  for the image i-th Cluster are taken into account while determining membership. The Fuzzy parameter m can be selected optimally which is defined as m > 1.0./it has been discovered thorough comparative examination of existing literature that the optimal value of m is used for regularization those values are between
For ECG images, the waveform Euclidean distance is expressed as  and waveform distances are measures as
  . The image with i-th cluster center is shown as
  ,
,  which defines the mean of Euclidean distance lies between neighboring waveforms stated as
  with consideration of image i-th cluster
  ,
,  for likelihood estimation of i-th cluster of ECG image waveform
  constrained local neighborhood estimation.
 and
and  are presented as follows from Equations (2)–(4).
 ()
() ()
() ()
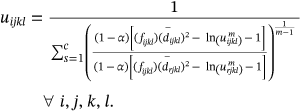
()In above equations, N and Njkl denotes total neighboring waveform volume and constrained neighborhood respectively, computed for the waveform center ajkl. The neighboring waveform that corresponds is designated as xjkl. For this weighted fuzzifier and Euclidean distance of images to be determined, products relating to local and global membership estimation need to be discarded to reduce the time consumption. The estimation of the inverse proportional membership function underlies the performance. The local membership estimate is influenced by the assessment of the likelihood for spatially constrained local neighborhood estimation.
3.2 Global and local features approximation
 ()
() ()
() ()
() ()
() ()
()According to the above Equation (9), the weighted parameters as (1 ≤ p, q ≤ 3) are taken into consideration, which have an effect on both global and local membership values.
The ECG waveform components are categorized in the methodology's last step taking into account different waveform features. The waveform at different categories is taken into consideration while creating the fuzzy rule. The image regions are calculated depending on taking into account the various levels of images intensities. Depending upon the gained statistical information images is classifies the waveform of the image. This paper segment the waveform of image, the smoothness and local and global entropies of nonparametric distributions are computed for small and isolated regions depending upon the image intensity distribution matching.


In above rule, for the estimated membership function the image I belongs to I: I ⊂ DI ⊂ Rn(n ∈ {2, 3}) → ZI for the fixed image domain I with ZI space as intensity values of image. A section of the image with abnormalities is segmented based on the estimated segmented image. If the image entropy value is greater than the membership function, it is deemed abnormal; if the image section becomes equal to membership function that can be considered as distortion in the signal; and the waveform is stated as normal if the segmented part is less than the membership function. ECG waveforms are segmented and categorized in accordance of global and local entropy of ECG image measured on the basis of considered parameters.
| Algorithm 1: CardioLabelNet |
| Begin |
| Select all elements of image Co to 0 except o which is set to 1 |
| Examine all waveforms of image c ∈ Co such that µκ(o, c) > 0 to Q |
| while Q = ∅ do |
| remove a waveform c from Q |
| fval ← maxd∈Co [min(fo (d), µκ(c, d))] |
| if fval > fo (c) then |
| fo (c) ← fval |
| Estimate the image waveform e such that µκ(c, e) > 0 fval > fo (e) fval > fo (e) and µκ(c, e) > fo (e) |
| end if |
| end while |
| end |
| Select elements of image Co to 0 except o which is set to 1 |
| push o to Q |
| while Q = ∅ do |
| Eliminate the waveform Q for which fo(c) is maximal |
| for every waveform µκ(c, e) > 0 do |
| fval ← min(fo(c), µκ(c, e)) |
| if fval > fo(e) then |
| fo(e) ← fval |
| Generate the waveform e in Q (or push if not yet in) |
| end if |
| end for |
| end while |
| end |
Assignment of Labeling is done to the segmented component of the waveform to classify it, and the notation is described as—
 . Optimized labeling can be obtained for the proffered algorithm as
  and it can be expressed from Equation (10) as follows:
 ()
()4 CLASSIFICATION WITH MACHINE LEARNING
Building blocks offered with Inception modules helps in reduction computational complexity in Inception V3. For dimensionality reduction, a deep neural network is employed in a significant computations being performed by the inception module. Reduced computing cost and over-fitting are the 2 factors that are explored for Inception V3. It includes numerous filters of varied sizes that are used in parallel computation. To compute effectively and for robustness, the Inception layer applies a 1 × 1 auxiliary convolution layer. ECG datasets are incorporated along with a (128 × 1) dense layer for classification in the Inception V3 pretrained mode. To reduce computational costs, the Inception V3 model is pretrained with effective feature extraction from images with dimensions of 224 × 224 × 3. Adam Optimizer is used for both forward and backward image classification through various iteration processes. In machine learning multi label classification is also possible to perform the process of classification for the cases that multiple nonexclusive labels are used to used at each instant of time. It is one among the generalized process of multiclass classification which greatly helps to solve the issues of the single label problem that is the categorization of the instance. In multilabel problem several classes are used in the instance in the nonexclusive form. In Supporting Information: Figure S3 presented the overall process involved in machine learning for estimation of abnormality in ECG images.
NASNet is a deep learning architecture classification system that uses a search method to govern neural networks. The NASNet is used to train data sets of collected image data. For model categorization, the network is pretrained with a 128 × 1 dense layer architecture. With an input image size of 224 × 224 × 3, the NASNet pretrained model is adjusted for image feature extraction and reduction. The Xception model with a dense layer of 128 × 1 dense layer architecture is included into the StackAlexNet-19. A binary and ternary classification layer of 128 × 1 and 2 × 1, respectively, are also included in Xception. The 224 × 224 × 3 images are supplied as input into the Xception layer has several separate layers for categorization. In addition, CardioLabelNet contains the MobileNet and ResNet models. MobileNet and ResNet both contains a 3 × 1 input layer, a 128 × 1 binary and ternary layer, and CardioLabelNet consist of a 2 × 1 layer. ResNet is a deep neural network input layer with 101 levels that processes information. Image features are performed employing dense layer of StackAlexNet-19 with optimization of Adam optimization in backward propagation.
In algorithm 1 CardioLabelNet is presented as follows:
| Algorithm 1: CardioLabelNet classification model |
| Input: ECG image data set |
| Output: ECG waveform classification based on labels |
| Steps: |
|
 with averaging of pooling layer. The outputs of each model are stacked to optimize and classify the images. The following is how the extracted features are processed using the 128 Relu function, taking into account the activation function described below in equation (11):
 ()
() ()
() ()
() ()
()
 ()
()In following of (15) equation, class probability is here represented by  .
.
5 PERFORMANCE METRICS
This section presented about the CardioLabelNet model performance measures that are considered for analysis.
5.1 Data set description
In this study, The ECG image data set is taken from the Kaggle data set that includes of different waveforms such as P, Q, R, S, T, and U. Different forms of pathologies for preprocessing of jpg format are included in the publicly available data set. The ECG image data set differs with the different dimensions which range in between 152 and 1853. The analysis expressed that the value of Image average height is 491, and the value of average width lies in 124–383. Over all, the average width is computed as 1485. The data set is classified with lesion with consideration of different waveform. The analysis is taken into account of image lesions along with the consideration of various labels given as P, Q, R, S, T, and U waveform. The normalized image pixels intensity lies in between the range of 0 and 1. Table 1 presented about classification of data set for training, testing and validation.
| P | Q | R | S | T | U | |
|---|---|---|---|---|---|---|
| Train | 746 | 649 | 695 | 727 | 969 | 845 |
| Validation | 50 | 50 | 50 | 50 | 50 | 50 |
| Test | 50 | 50 | 50 | 50 | 50 | 50 |
| Total | 725 | 649 | 695 | 612 | 986 | 873 |
To estimate the performance of ECG classification, the performance metrics are provided which depends upon confusion matrix. Confusion metric considered for evaluation is depends on the evaluation of other parameters like accuracy, precision, recall, and F1-Score. Stated parameters are evaluated by calculation FP (false positive), FN (false negative), TN (true negative), and TP (true positive).
 ()
() ()
() ()
() ()
() ()
() ()
()Here, TP implies the True Positive, which forecast values and anticipated as positive in AI model.
FP implies for false positive, it is defined as forecast value which is estimated as negative initially and later anticipated as positive in AI model.
TN demonstrated forecast value as negative and anticipated as unfavorable for AI model.
FN is stated as forecast value which is estimated as positive initially and later anticipated as negative in AI model.
For obtained ECG image data, the performance of the proffered CardioLabelNet algorithm is analyzed. The ECG images data are made up of image volumes which can also be segmented to identify waveform variations. The suggested CardioLabelNet performance relies on image volume segmentation in to 3 × 3 × 3 window sizes that must be empirically selected. The ECG image waveform cluster are determined depending upon the mean waveform ajkl, Euclidean distance dijkl, and the metric of possibility factor fijkl. The measures of performance metrics used in the proffered CardioLabelNet analysis relies on the of (i) segmentation accuracy (SA), (ii) Dice similarity coefficient (DSC) or Dice coefficient, (iii) partition coefficient (Vpc), and (iv) partition entropy (Vpe).
 ()
()In above equation Ai represented correctly classified waveform for the ith cluster and Bi denotes the number of waveform located in ground truth.
 ()
()In above Equation (23), C is stated as total cluster count, segmented image volume Ai is defined as set of waveform cluster and Bi represents truth image. For ideal algorithm DSC value is obtained as 1.0 and DSC algorithm provides closer value of 1.0.
 ()
() ()
()In Table 1 presented the simulation environment constructed for proposed CardioLabelNet architecture.
6 ANALYSIS OF CARDIOLABELNET
In this section presented about results obtained for proposed CardioLabelNet algorithm performance. The analysis of results are presented as follows:
In Supporting Information: Figures S4–S9 different type of ECG waveform are illustrated. While segmenting six volumes of ECG simulated image data, the accuracy of various algorithms is measured. The noise level and IIH range are varied from 5% to 9% and 20% to 40%, respectively, to test the algorithms' robustness with the occurrence of high levels of noise and IIH.
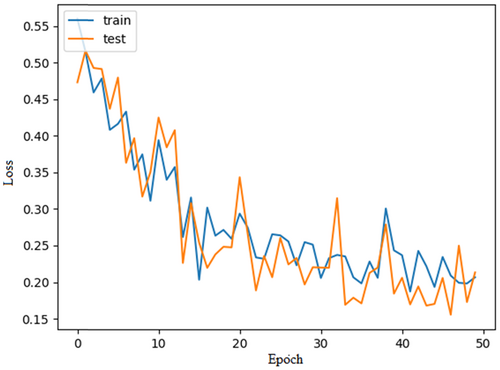
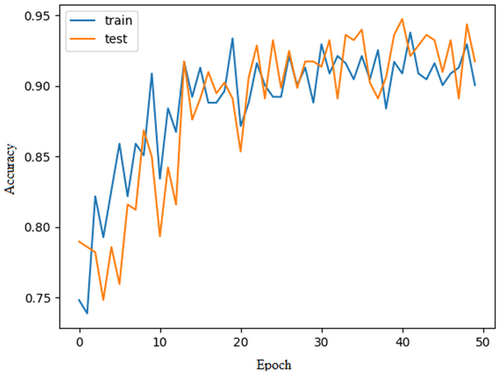
The proposed CardioLabelNet model is evaluated using the above-mentioned parameters. This evaluation is carried out with the consideration that the CardioLabelNet trained with 500 epochs. The network stopping criterion has been set to a value of 10. CardioLabelNet initially uses preprocessing to data set training and testing. In Figure 3 training model loss estimated for CardioLabelNet is presented. In Figure 4 model accuracy estimated using CardioLabelNet is presented.
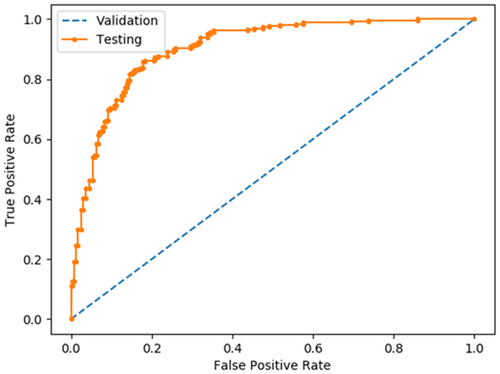
Receiver Operating Characteristics (ROC) is used to analyse the obtained results. CardioLabelNet AUC is calculated and compared to existing approaches based on the predicted ROC. Here, Figure 5 depicts ROC plot in comparison with existing technique is presented.
The data set relies on collected ECG which consists of different waveform type for estimation of normal and abnormal signal.
In Table 2 dice coefficient for the proposed CardioLabelNet with existing technique are presented. In Table 3, entropy coefficient of proposed CardioLabelNet with existing techniques is presented. In Figure 6, dice coefficient for proposed approach is comparatively illustrated.
| Dice metrics | Fuzzy | Fuzzy + classifier | CardioLabelNet |
|---|---|---|---|
| 1 | 0.74 | 0.82 | 0.89 |
| 2 | 0.67 | 0.74 | 0.86 |
| 3 | 0.76 | 0.84 | 0.91 |
| 4 | 0.83 | 0.87 | 0.96 |
| 5 | 0.79 | 0.85 | 0.88 |
| Volumes | Segmentation technique | Vpc | Vpe |
|---|---|---|---|
| 1 | Fuzzy clustering | 0.786 | 0.245 |
| Fuzzy + classifier | 0.774 | 0.023 | |
| CardioLabelNet | 0.865 | 0.034 | |
| 2 | Fuzzy clustering | 0.845 | 0.167 |
| Fuzzy + classifier | 0.945 | 0.176 | |
| CardioLabelNet | 0.986 | 0.146 | |
| 3 | Fuzzy clustering | 0.745 | 0.084 |
| Fuzzy + classifier | 0.826 | 0.175 | |
| CardioLabelNet | 0.924 | 0.226 | |
| 4 | Fuzzy clustering | 0.812 | 0.168 |
| Fuzzy + classifier | 0.794 | 0.145 | |
| CardioLabelNet | 0.945 | 0.178 | |
| 5 | Fuzzy clustering | 0.745 | 0.045 |
| Fuzzy + classifier | 0.675 | 0.097 | |
| CardioLabelNet | 0.945 | 0.152 |
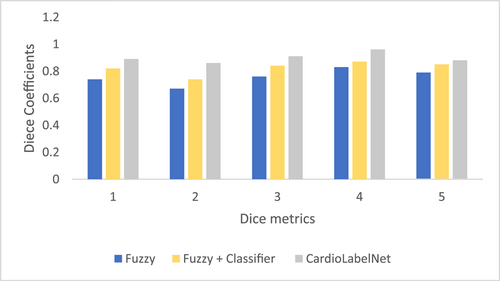
The comparative analysis of proposed CardioLabelNet with conventional fuzzy and classifier-based approach is comparatively examined. The analysis of results stated that proposed CardioLabelNet provides significant performance rather than conventional techniques fuzzy clustering and classifier technique. The entropy value measured for proposed CardioLabelNet is significantly higher than that of conventional technique. However, because these are made up of actual medical data, unlike the earlier simulated ECG image volumes, the ground truths are not available. The Dice coefficient parameters and SA are therefore not advantageous among the four performance indicators. In Table 4 classification performance of proposed CardioLabelNet is presented.
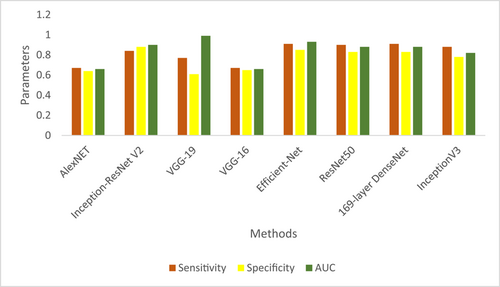
| Methods | Accuracy | Sensitivity | Specificity | AUC |
|---|---|---|---|---|
| AlexNET | 56.67 | 0.67 | 0.64 | 0.66 |
| Inception ResNet V2 | 85.33 | 0.84 | 0.88 | 0.90 |
| VGG-19 | 66.14 | 0.77 | 0.61 | 0.99 |
| VGG-16 | 62.67 | 0.67 | 0.65 | 0.66 |
| Efficient-Net | 90.67 | 0.91 | 0.85 | 0.93 |
| ResNet50 | 86.67 | 0.9 | 0.83 | 0.88 |
| 169-layer DenseNet | 83.33 | 0.91 | 0.83 | 0.88 |
| InceptionV3 | 82.67 | 0.88 | 0.78 | 0.82 |
| CNN 8-layers | 74.67 | 0.8 | 0.70 | 0.78 |
| Encoder-Dense | 70.04 | 0.75 | 0.61 | 0.72 |
| CardioLabelNet | 93.67 | 0.93 | 0.97 | 0.97 |
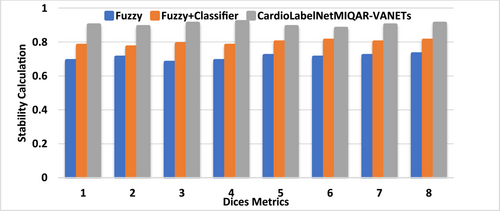
In Figure 7 presented the comparison of sensitivity, specificity and AUC of proposed CardioLabelNet with other existing technique. The results of the investigation revealed that the proffered CardioLabelNet outperforms conventional approaches. In the Figure 8 the stability of the proffered CardioLabelNet is compared with the earlier works. When compare with existing method, the proposed method CardioLabelNet has stability of 0.85–0.9 whereas other method Fuzzy, Fuzzy + classifier has the stability in the value from 0.6 to 0.8. After analysis, it can be determined that CardioLabelNet's performance as suggested is important for classifying abnormalities in ECG images.
7 CONCLUSION
An essential process in an ECG monitoring and alarm system is the early detection and warning of abrupt abnormal ECGs. The framework suggested in this study could effectively identify abnormal ECG images and perform better on several of our tests' indicators. In this work entropy based fuzzy classification method is developed for fuzzy classification. The proposed CardioLabelNet approach entails uncertainties estimation in local and global entropy. The image's entropy is assessed to calculate weighted parameters using fuzzy membership function estimation. Weights are incorporated in fuzzy for the identifying optical image values in accordance of membership function identification. The local entropy is calculated using likelihood estimation, while the global entropy is computed using the fuzzy technique. They are classified in accordance of the fuzzy membership function. The findings of the comparative research revealed that the suggested CardioLabelNet approach outperforms traditional techniques by a wide margin.
AUTHOR CONTRIBUTIONS
Jyoti Mishra: Conceptualization (equal); formal analysis (equal); software (equal); writing – original draft (equal). Mahendra Tiwari: Project administration (equal); supervision (equal).
ACKNOWLEDGMENTS
None.
CONFLICT OF INTEREST
The authors declare no conflict of interest.
ETHICS STATEMENT
No human subject was directly involved in the present study.
INFORMED CONSENT
Not applicable.
Open Research
DATA AVAILABILITY STATEMENT
The data that support the findings of this study are available from the corresponding author upon reasonable request.


 ) with zero(0) epoch.
 .
. .
.
