Cerebello-cerebral resting-state functional connectivity in spinocerebellar ataxia type 3
Funding information: Key Project of Research and Development of Ministry of Science and Technology, Grant/Award Number: 2018AAA0100705; National Natural Science Foundation of China, Grant/Award Numbers: 62036003, 81601478, 82071910, 82121003, U1808204
Abstract
Spinocerebellar ataxia type 3 (SCA3) is a neurodegenerative disorder characterized by progressive motor and nonmotor deficits concomitant with degenerative pathophysiological changes within the cerebellum. The cerebellum is topographically organized into cerebello-cerebral circuits that create distinct functional networks regulating movement, cognition, and affect. SCA3-associated motor and nonmotor symptoms are possibly related not only to intracerebellar changes but also to disruption of the connectivity within these cerebello-cerebral circuits. However, to date, no comprehensive investigation of cerebello-cerebral connectivity in SCA3 has been conducted. The present study aimed to identify cerebello-cerebral functional connectivity alterations and associations with downstream clinical phenotypes and upstream topographic markers of cerebellar neurodegeneration in patients with SCA3. This study included 45 patients with SCA3 and 49 healthy controls. Voxel-based morphometry and resting-state functional magnetic resonance imaging (MRI) were performed to characterize the cerebellar atrophy and to examine the cerebello-cerebral functional connectivity patterns. Structural MRI confirmed widespread gray matter atrophy in the motor and cognitive cerebellum of patients with SCA3. We found reduced functional connectivity between the cerebellum and the cerebral cortical networks, including the somatomotor, frontoparietal, and default networks; however, increased connectivity was observed between the cerebellum and the dorsal attention network. These abnormal patterns correlated with the CAG repeat expansion and deficits in global cognition. Our results indicate the contribution of cerebello-cerebral networks to the motor and cognitive impairments in patients with SCA3 and reveal that such alterations occur in association with cerebellar atrophy. These findings add important insights into our understanding of the role of the cerebellum in SCA3.
1 INTRODUCTION
Spinocerebellar ataxia type 3 (SCA3) is a rare neurodegenerative disease resulting from CAG repeat expansion in the ATXN3 gene, which leads to a primary dysfunction of the cerebellum and its connectivity (Klockgether et al., 2019). The cerebellar impairment leads to ataxia, the clinical hallmark of SCA3; however, the phenotypic spectrum of SCA3 is highly variable and can include nonmotor features (Pedroso et al., 2013). The cerebellum exerts a far-reaching influence on behaviors, given its anatomical and functional connections with the basal ganglia and cortical mantle. Furthermore, it is known to be involved in motor control and complex cognition, including social and emotional functions (Quartarone et al., 2020).
Although originally regarded as a critical sensorimotor structure, the cerebellum has been recognized more recently for its role in complex cognition, including social and emotional functions (Leiner et al., 1993; Schmahmann, 2004). During mammalian evolution, the cerebellum expanded both structurally and functionally in parallel with the cerebral cortex and basal ganglia (Sathyanesan et al., 2019), thus providing neural substrates for cerebellar involvement in motor, cognitive, and emotional domains (Klein et al., 2016; Wild & Williams, 2000). Cerebellar-cortical connections are topographically organized to form an integrated, brain-wide network that operates over multiple functional domains (Buckner et al., 2011). Functional connectivity magnetic resonance imaging (MRI) studies have shown modular segregation of cerebellar functions in humans (Buckner et al., 2011; Habas et al., 2009; Klein et al., 2016), and this functional segregation has been extended to the cellular level in a mouse model (Giovannucci et al., 2017). Highly focal cerebellar lesions due to stroke, tumor, or traumatic brain injury can also cause more widespread connectivity disturbances and result in cognitive impairments in addition to motor deficits (Hoche et al., 2018; Levisohn et al., 2000). Thus, disruption in one cerebellar node can percolate throughout the network and lead to network-wide effects that alter functions at other nodes. Given the dense reciprocal connections between the cerebellum and telencephalic structures, the secondary rearrangement of these pathways may result in various impairments depending on the location (Pedroso et al., 2013; Sathyanesan et al., 2019).
Recent consensus research studies have provided strong evidence of cerebellar structural abnormalities in SCA3. Structural MRI offers an invaluable tool to assess SCA3 neuropathology in vivo (Schols et al., 2004). Gray matter atrophy is an objective biological readout of progressive neurodegeneration and precedes the onset of overt clinical syndromes (Guo et al., 2020; Jacobi et al., 2013; Reetz, et al., 2013). Within this temporal window, the pathogenesis of cerebellar neurodegeneration may underlie the functional vulnerability of the cerebellum circuitry. Resting-state functional MRI is a powerful tool to delineate the brain's intrinsic functional wiring architecture and has been successfully applied to study various neurodegenerative diseases (Pievani et al., 2014). By using resting-state functional MRI, evidence of functional connectivity abnormalities between the cerebellum and both neocortex and basal ganglia has been provided in other types of SCAs (Cocozza et al., 2015; Hernandez-Castillo et al., 2013; Hernandez-Castillo et al., 2015). In SCA2, impaired cerebellar-cerebral connectivities correlate with motor deficits and other neuropsychological impairments (Hernandez-Castillo et al., 2015). In SCA7, which is caused by CAG repeat expansion in the ATXN7 gene, reduced cerebellum-anchored functional connectivity patterns are moderately associated with repeat number and disease duration (Hernandez-Castillo et al., 2013). MRI studies of SCAs combined with morphological and functional analyses indicate that cerebellar-cerebral functional connectivity abnormalities are explained, at least in part, by cerebellar atrophy (Cocozza et al., 2015; Hernandez-Castillo et al., 2015; Reetz et al., 2012). Thus, cerebellar GM loss in SCAs may be related to interactions among cerebellar-cerebral cortical networks, leading to diaschisis syndromes. However, limited research has been conducted regarding the whole-brain functional changes that occur in relation to the cerebellar neurodegenerative process in SCA3.
The present study aimed to identify cerebellar-cerebral functional connectivity alterations and associations with downstream clinical phenotypes and upstream topographic markers of cerebellar neurodegeneration in SCA3. For this purpose, we mapped cerebellar anatomical and connectivity patterns. We further performed correlation analyses to elucidate the association between cerebellum-anchored connectivity changes and the clinical manifestations in SCA3. We hypothesized that the patterns of cerebellar-cerebral connectivity alterations may, at least in part, be explained by the neurodegeneration of the cerebellum which is the main affected region in SCA3. We also expected altered cerebellar circuitry contributes to reasonable clinical parameters in SCA3.
2 METHODS
2.1 Subjects
A total of 47 symptomatic genetically confirmed SCA3 patients were recruited. Forty-nine demographically matched healthy controls (HCs) were also included (Table 1). All the participants underwent MRI scans and clinical evaluations. All HCs were confirmed to be negative for SCA3 mutations. None of the HCs had histories of neurological diseases, psychiatric disorders, or neuropharmacological treatment.
| SCA3 (n = 45) | HC (n = 49) | |
|---|---|---|
| Mean ± SD | ||
| Sex (male/female) | 26/19 | 25/24 |
| Age (mean ± SD) | 39.87 ± 12.00 | 40.75 ± 11.80 |
| Duration (mean ± SD) | 6.73 ± 4.37 | - |
| CAG (mediation) | 66 (range, 57–72) | - |
| SARA (mediation) | 10 (range, 0–40) | - |
| MMSE | 27.39 ± 3.32 | - |
| HAMD-24 | 7.15 ± 6.85 | - |
- Abbreviations: HAMD-24, 24-item Hamilton Rating Scale for Depression; MMSE, Mini-Mental State Examination; SARA, Scale for Assessing and Rating Ataxia.
The study was approved by the local ethics committee and written informed consent was obtained from all participants. The study was also registered with the Chinese Clinical Trial Registry (ChiCTR, http://chictr.org.cn) under registration number ChiCTR1800019901.
2.2 Clinical evaluations
Clinical evaluations were performed on the same day as MRI scans. The severity of ataxia was assessed semiquantitatively using the Scale for Assessing and Rating Ataxia (SARA) (Schmitz-Hubsch et al., 2006). The Mini-Mental State Examination (MMSE) was administered as a global measure of cognitive function. The severity of depression was quantified using the 24-item Hamilton Rating Scale for Depression (HAMD-24). Four patients were unable to complete all sections of clinical evaluations due to severe motor dysfunction. These four participants were excluded from the subsequent clinical correlation analysis.
2.3 MRI scanning
MRI was performed using a Siemens 3 T TIM Trio MRI scanner (Erlangen, Germany) equipped with the standard Siemens eight-channel head coil. In addition to conventional diagnostic sequences, a high-resolution sagittal structural T1-weighted anatomical sequence was acquired using a 3D magnetization-prepared rapid-acquisition gradient echo. The following imaging parameters were used: repetition time = 1900 ms, echo time = 2.52 ms, inversion time = 900 ms, flip angle = 9°, slice thickness = 1 mm, field of view = 256 × 256 mm2, matrix = 256 × 256, voxel size = 1 × 1 × 1 mm3, slices = 176, and no gap. We also applied T2-weighted sequences to exclude unrelated preexisting neurological and medical disorders. The following parameters were used for T2-weighted images: repetition time = 6000 ms, echo time = 89 ms, flip angle = 120°, field of view = 230 × 230 mm2, slices = 20, slice thickness = 5.0 mm, matrix = 448 × 448, and voxel size = 0.5 × 0.5 × 5.0 mm3. Resting-state functional MRI images were collected using an echo planar imaging sequence as follows: repetition time = 2000 ms, echo time = 30 ms, flip angle = 90°, field of view = 192 × 192 mm2, slices = 36, slice thickness = 3 mm, matrix = 64 × 64, volumes = 240, and voxel size = 3 × 3 × 3 mm3. All participants were instructed to remain motionless but awake with eyes closed during the scan (confirmed by all participants immediately after the scanning). The procedures were evaluated by two experienced radiologists (C.L. and J.W.).
2.4 Voxel-based morphometry analysis
For cerebellar voxel-based morphometry, we used the spatially unbiased infratentorial (SUIT) toolbox (http://www.diedrichsenlab.org/imaging/suit.htm) (Diedrichsen, 2006). The cerebellum was first isolated from the surrounding tissue with isolate function in the SUIT toolbox. The SUIT toolbox uses an automatic algorithm (published as a SPM toolbox (Diedrichsen, 2006)) to isolate the cerebellum from the surrounding tissue. This algorithm is based on a segmentation of voxels according to tissue types (white matter, gray matter, and cerebrospinal fluid) by using a probabilistic segmentation method (Ashburner & Friston, 2005). Subsequently, cerebellar gray and white matter is separated from the cerebral gray and white matter using Bayesian inference. The p value was set to .2 as default. The cropped images were then normalized into the SUIT atlas template by using Diffeomorphic Anatomical Registration using Exponentiated Lie algebra to deform individual cerebellum to find the best correspondence with the SUIT template. The GM maps were finally smoothed with a Gaussian kernel (full-width at half-maximum [FWHM] = 4 mm). All isolated images were visually examined by two experienced radiologists (C.L. and J.W.) by double-blind method to ensure that the quality of each image was acceptable for subsequent analysis.
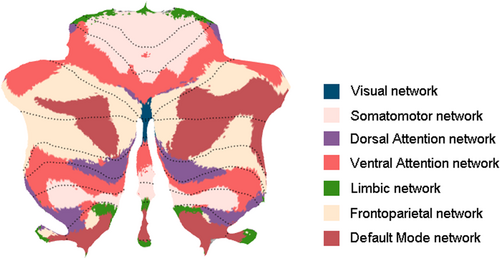
As functionally defined parcellation can help to reveal dysfunction in specific cerebellar regions and cerebello-cerebral circuits (King et al., 2019; Xue et al., 2021), the cerebellar region of interest (ROI) parcellation was defined by Buckner's seven-network atlas (Buckner et al., 2011). The seven cerebellar networks included the visual network, the somatomotor network (cSMN), the dorsal attention network (cDAN), the ventral attention network (cVAN), the limbic network, the frontoparietal network (cFPN), and the default mode network (cDMN) (Figure 1). However, because we were principally interested in investigating motor and cognitive functions, the visual and limbic networks were excluded. The gray matter volume of each network was extracted for each subject. Gray matter volume differences were compared between the SCA3 and HC groups by two-sample t tests. Total intracranial volume, age, sex, and years of education were regressed out as covariates. Statistical analyses were conducted using the statistical software Prism (GraphPad). False discovery rate (FDR) was also determined for multiple comparison correction. FDR-corrected p values are reported. Differences were considered to be significant at p < .05 for the five cerebellar networks.
2.5 Functional connectivity analysis
Preprocessing of functional MRI images was conducted using the DPABI toolbox (http://rfmri.org/dpabi). The processing pipeline included the following: (1) removal of the first 10 time points (leaving 230 volumes); (2) slice timing; (3) realignment, during which two SCA3 subjects exhibiting head motion ≥2.0 mm translation and 2.0° rotation in any orientation were excluded, and the remaining 45 SCA3 participants were considered for the subsequent analysis; (4) co-registration to individual T1 images, with spatial normalization to the Montreal Neurological Institute template; (5) temporal low-pass filtering (0.01–0.08 Hz); (6) spatial smoothing (FWHM = 4 mm); and (7) regression of nuisance covariates. Several nuisance covariates including Friston-36 parameters and global signal and averaged signals from the cerebrospinal fluid and white matter were regressed out. The mean frame-wise displacement (FD) of each subject was also calculated, and the participants whose FD value exceeded the 0.5 mm were excluded from the analysis. Here, no subjects were excluded.
Spatial independent component analysis (ICA) was conducted at the group level by using the GIFT software (http://icatb.sourceforge.net/) (Calhoun et al., 2001). Dimension estimation for the group data sets was performed using the minimum description length criteria. The data temporal dimension was reduced by principal component analysis. Twenty-four independent components were extracted using the Infomax algorithm. Individual-subject time courses and spatial maps were reconstructed using the aggregated components and the results from the data reduction step. Five networks of interest were selected by visual inspection based on previous studies of network changes in SCAs: the DMN, DAN, sensorimotor network (SMN), and bilateral FPN (L_FPN and R_FPN) (Cocozza et al., 2015; Falcon et al., 2016; Hernandez-Castillo et al., 2013). For each subject, network-specific mean time courses were extracted. Each network was then subjected to a random-effects analysis using one-sample t tests across the group with the threshold set at FDR-corrected p < .01.
Functional connectivity was investigated by calculating temporal correlations between the smoothed images. The blood oxygen level-dependent time courses of the five cerebellar networks (cSMN, cDAN, cVAN, cFPN, and cDMN) and the five cerebral cortical networks (SMN, DMN, DAN, L_FPN, and R_FPN) were extracted and averaged from each participant. For each cerebellar ROI, five time series from the cerebellar networks were extracted. Likewise, for each cerebral ROI, five time series from the ICA networks were also extracted. The cerebello-cerebral connectivity was measured as Pearson correlation between the average time series of each network. For each participant, a 5 × 5 functional connectivity matrix between cerebellum and cerebrum was constructed. The resulting correlation coefficients were normalized using Fisher's r-to-Z' transformation to improve the Gaussianity of the distributions (Liu et al., 2017). A two-sample t test was performed to detect significant differences in functional connectivity between the SCA3 and HC groups. Age, sex, years of education, and head motion parameters were regressed out to exclude potential sources of variance. The statistical threshold was set at p < .05 after correction for multiple comparisons using FDR in each cerebello-cerebral connectivity.
2.6 Relationship between cerebellar gray matter atrophy and functional connectivity
To estimate the relationship between structural alterations in cerebellar gray matter and its cerebello-cerebral FC, we calculated correlations of each cerebellar ROI atrophy score with its FC values between the cerebellum ROI and for each of the five cerebral networks. We defined the atrophy score of each cerebellar network as the proportion of cerebellar volume ([volume of cerebellar network/volume of total cerebellum × 100%]). The correlation coefficients between the cerebellar atrophy score and FC in HCs were defined as the baseline. The Z-scores of the SCA3 group were directly compared with those of the HC group. Negative differences implied a loss of FC in relation to cerebellar atrophy, while a positive difference implied a gain of connectivity.
2.7 Correlation with clinical features
To establish the relationships among altered clinical variables, we calculated Pearson's correlation coefficients (Z score) between the extracted cerebello-cerebral functional connectivity and CAG repeat expansion, age, MMSE score, and HAMD-24 score, with gender and years of education as covariates. CAG repeat expansion is a subjective metric and provides a good indicator of the strength of the disease in each patient. The logic behind using the CAG expansion is that both motor symptoms (SARA) and when they become visible (disease onset) directly depend on the gene mutation (CAG expansion) and how long the gene has been on the patient (age of the subject). The p value of correlation analysis was adjusted by FDR. Results with a corrected p value <.05 were considered to be statistically significant.
3 RESULTS
3.1 Cerebellar morphometry
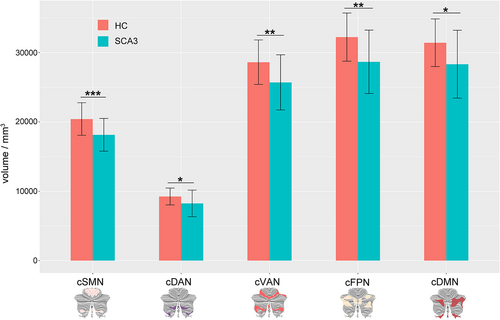
Morphometric analysis revealed significant widespread gray matter atrophy in cerebellar networks among SCA3 patients relative to HCs (Figure 2). The cSMN volume of SCA3 patients (mean ± SD: 18145.66 ± 2332.91 mm3) was significantly smaller (p < .0001) by 11.14% than those of HC (20,421.18 ± 2324.387 mm3). The volumes of the cDAN (−10.76%, p = .009) and cVAN (−10.18%, p = .0001) networks were also atrophied in SCA3 patients as compared to those in HC. This atrophy was also present in the cFPN (vs. HCs: −11.04%, p = .0002) and cDMN (vs. HCs: −9.85%, p = .002).
3.2 Functional connectivity analysis
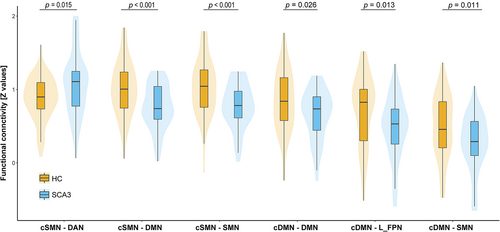
Functional connectivity analysis indicated abnormalities on either of the cDMN and cSMN seed to the cerebral cortex. A comparison of the SCA3 group with the HC group revealed significant abnormalities in six cerebello-cerebral connectivity, including both hyper- and hypo-connectivity alterations (Figure 3). For the cSMN seed, SCA3 patients showed increased functional connectivity between the cSMN and the DAN as compared to HCs (p = .015, t = 2.48). SCA3 patients also demonstrated reduced FC strength between the cSMN and both the DMN (p < .001; t = −3.52) and SMN (p < .001; t = −3.46). For the cDMN as seed, SCA3 patients exhibited decreased FC strength between the cDMN and the cerebral DMN (p = .026; t = −2.26), LFPN (p = .013; t = −2.54), and SMN (p = .011; t = −2.60). No significant differences between SCA3 patients and HCs were observed with respect to the cerebello-cerebral connectivity when seeded at the cDAN, cVAN, and cFPN (all p > .05, FDR corrected). Moreover, no significant differences in mean FD were observed between the two groups by using a two-sample t test (p = .94).
The extent of atrophy within the cSMN and cDMN was negatively correlated with the alterations in FC between these two cerebellar seeds and the cerebral resting-state networks in SCA3 patients (all p < .05, FDR corrected) as compared to that in the HC group.
3.3 Clinical correlations
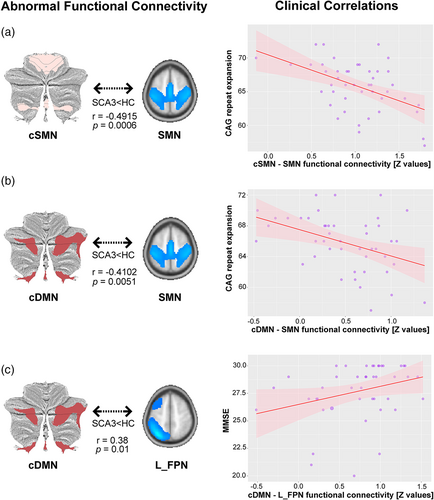
Clinical correlation analysis showed three significant correlations between the clinical scores and the cerebello-cerebral connectivity alterations in the SCA3 group (Figure 4). An inverse correlation was noted between the CAG repeat expansion and impaired connectivity between the cSMN and the cerebral SMN network (p = .0006, r = −.4915) and between the cSMN and the cerebral DMN network (p = .0051, r = −.4102). A significant correlation was also found in decreased connectivity between the cDMN and the cerebral L_FPN network, which was positively associated with MMSE score (p = .01, r = .38). No other correlations between clinical scores and connectivity were found (all p > .05).
4 DISCUSSION
To the best of our knowledge, the present study is the first comprehensive investigation of functional connectivity abnormalities associated with structural deficits in the cerebellum in patients with SCA3. The following three main findings were obtained: (1) structural analysis demonstrated atrophy across the cerebellum; (2) functional connectivity analyses showed bidirectional alterations between the cerebellar networks and large-scale cerebral cortical networks; and (3) correlation analyses showed that alterations in connectivity between cerebello-cerebral networks correlated with disease burden and cognitive impairments.
SCA3 patients showed widespread functional connectivity abnormalities in the cerebellar-anchored circuitry. The cerebellum contributes to both motor and nonmotor functions and receives inputs from a wide variety of sources, including neocortical areas. It is thought that the cerebellum contains repeating processing modules, the function of which is driven by the input the module receives (Schmahmann, 1991). Although previous studies have focused on neurodegeneration in the cerebellum, potential functional integrity abnormalities remain unknown. In the present study, we delineate for the first time functional interaction abnormalities associated with cerebellar atrophy in patients with SCA3. We found that cerebellar atrophy in SCA3 was associated with bidirectional changes in the cerebello-cerebral connectivity, suggesting that local cerebellar pathology is related to connectivity alterations in functional networks. As expected, the volume of the cerebellum was markedly reduced in SCA3. Our finding is also in line with the hypothesis that neurodegeneration in large-scale distributed networks is initiated by disease-specific vulnerable regions (Seeley et al., 2009). In particular, Hernandez-Castillo et al. revealed that disrupted functional interaction could be explained very well by atrophy of the structures in which they occurred in SCA7 (Hernandez-Castillo et al., 2013). Local cerebellar neurodegeneration and the subsequent disruption of the cerebellar-cerebral connectivity might be the main drivers of SCA3 manifestations. Polyglutamine proteinopathy may damage or destroy Purkinje cells, the sole output of the cerebellar cortex, thereby altering the firing dynamics and disrupting the excitatory/inhibitory balance. This could subsequently perturb cerebellar output signals and impair modulatory inputs to the cortex, which is responsible for motor control, cognition, and affective modulation.
In patients with SCA3, both the cSMN and cDMN presented decreased functional connectivity with the DMN, suggesting that the DMN serves as an important hub in the brain. The hub characteristics of the DMN, such as dense anatomical connectivity, multiple functional dependencies, and high energy consumption, may explain its vulnerability to cerebellar dysregulation (Raichle, 2015). Gray matter loss in the mesial frontal and parietal cortical structures overlapping with the DMN was also prominent and correlated with disease progression in SCA17 (Lasek et al., 2006). Previous functional MRI studies on SCA2 also showed functional connectivity abnormalities of the DMN (Cocozza et al., 2015; Hernandez-Castillo et al., 2015).
Functional connectivity analysis showed that intrinsic connectivity between the cerebellum and cerebrum was overall significantly decreased in the SCA3 group for each of the five cerebral seeds. An inverse effect (SCA3 > HC) was, however, detected in the connectivity between the cSMN and DAN. The cSMN also showed significant gray matter atrophy associated with SCA3. Previous research on other neurodegenerative diseases has shown that increments in functional connectivity may allow regions with structural atrophy to remain functionally normal (Liang et al., 2011; Rytsar et al., 2011), this increased connectivity between the cSMN and DAN may reflect a compensatory mechanism. In a healthy brain, the DMN and DAN show antagonistic suppression. In the current study, however, SCA3 patients exhibited contrasting patterns of decrement in the cCBM-DMN connectivity and enhancement in the cCBM-DAN connectivity, thus suggesting a possible impairment in the ability to coordinate switching between these two competing networks. This finding also resembles the disruption of the connectivity between the cerebellum and the DMN in SCA2 (Cocozza et al., 2015). It remains unclear whether these diverging network profiles influence behavior or are only nonspecific effects of antagonist. Divergent profiles in reciprocal inhibitory networks are associated with clinical deficits in the behavioral variant of frontotemporal dementia and in Alzheimer's disease (Zhou et al., 2010). The impairment in the DAN may also explain the observed disruption of attention and executive functions in Huntington's disease, which is another CAG repeat (polyglutamine) disease (Poudel et al., 2014). If the DAN is functionally engaged by an externally oriented stimulus, patients with enhanced DAN connectivity may experience an anxiogenic effect (Corbetta & Shulman, 2002). Conversely, an impairment in the DMN may disinhibit DAN responses, resulting in stimulus oversensitivity. These maladaptive shifts between the DMN and DAN network activities may explain, at least in part, the anxiety and irritability observed in SCA3 patients (Pedroso et al., 2013). Another possibility is that individuals with SCA3 attempt to compensate for impaired motor behavior by increasing their reliance on attention. Future studies should include anxiety ratings from both patients and caregivers to determine the physiological role of the DAN in SCA3.
Clinical correlation analyses found a significant negative correlation between the CAG repeat expansion and impaired functional connectivity between the cSMN and the cerebral SMN network as well as between the cSMN and the cerebral DMN network. These results suggest that the CAG repeat expansion plays a role of deteriorating cerebello-cerebral integration of motor function. Both the characterized motor systems and disease onset directly depend on the gene mutation burden (Abe et al., 1998). Although cerebellar degeneration contributes to ataxia in SCA3 patients, our correlation results, together with previous whole-brain structural findings (de Rezende et al., 2015), suggest that damage to the cerebello-cerebral functional integration of the motor pathway may also contribute significantly to ataxia. The reduced cerebellar-SMN connectivity in SCA3 resembles the disrupted integration between the motor cerebellum and cortical motor-related areas observed in other SCAs (Cocozza et al., 2015; Hernandez-Castillo et al., 2015; Reetz et al., 2012), as these connectivity changes are also related to cerebellar structural abnormalities and may be related to a wide range of cerebellar and extracerebellar deficits. CAG repeat length in the responsible gene strongly influences the age of onset and the rate of development of atrophy in the cerebellum and brainstem in SCA3 (Abe et al., 1998). A previous study has also reported the association between gene mutation and functional connectivity in other CAG repeat (polyglutamine) diseases. For example, Hermandez-Castillo et al. found that CAG repeat expansion negatively affects functional connectivity between the anterior cerebellum and the superior frontal gyrus and between the cerebellum and the parahippocampal gyrus (Hernandez-Castillo et al., 2013). Moreover, impaired functional connectivity within the DMN associated with depressive symptoms could be modulated by CAG repeat length of the mutated Huntington allele in prodromal Huntington's disease (Unschuld et al., 2012). These findings suggest that disruptions of information flow, which are affected in CAG repeat (polyglutamine) diseases, strongly depend on the size of CAG repeat.
We also found that the disruption of functional connectivity between the cDMN and the L_FPN positively correlated with the MMSE score in the SCA3 group, thus showing a close relationship between cerebellar connectivity disruption and cognitive impairment. This result highlights the fact that cerebellar abnormalities in SCA3 are likely to have far-reaching effects not only on movement but also on cognition. The cerebellar cognitive affective syndrome is characterized by cognitive impairment in the executive and visuospatial domains, language deficits, and personality changes (Schmahmann, 2004). Specific deficits in verbal and visual memory, verbal fluency, and visual attention have been noted in patients with SCA3 (Kawai et al., 2004; Maruff et al., 1996; Pedroso et al., 2013). It is thought to represent a dysfunction of the cerebro-cerebellar-cerebral loops (Schmahmann & Caplan, 2006). A recent longitudinal structural neuroimaging study in patients with SCA3 also confirmed neocortical involvement that affects the frontal, parietal, and temporal lobes (D'Abreu et al., 2012). A single-photon emission computed tomography imaging study in patients with SCA3 reported hypoperfusion of the cerebellum and temporal, limbic, and occipital lobes and showed visuospatial correlation with these areas (Braga-Neto et al., 2012). Thus, it is implicit that the disruption of the cerebello-cerebral connectivity by atrophy of the cognitive cerebellum may underlie the cognitive deficits observed in patients with SCA3.
This study used functional connectivity analysis to investigate the interactions of the cerebellar seeds with large-scale cortical networks associated with cerebellar structural deficits in patients with SCA3. During functional connectivity preprocessing, the white matter signal was regressed out as a covariate. Currently, the BOLD signal in white matter function has been demonstrated to be a psychological measure (Ji et al., 2017). In patients with Alzheimer's disease, the resting-state white matter function was associated with regional glucose metabolism and correlated with memory function (Makedonov et al., 2016). Altered regional and network functioning of white matter was also noted in patients with Parkinson's disease (PD) (Ji et al., 2019). The white-matter functional connectome showed fair performance in discriminating patients with PD from HCs (Ji et al., 2019). Disruption of widespread white matter structural integrity in SCA3 is strongly related to the clinical severity of ataxia symptoms (Kang et al., 2014). It is possible that white matter functional alteration may mediate the relationship between cerebellar atrophy and clinical parameters. When interpreting our findings, it is important to remember that the patients included in the present study covered the entire range of disease severity. Further longitudinal studies on the trajectory of functional connections over time may reconcile heterogeneous and could be evaluated in other neurodegenerative disorders.
5 CONCLUSION
The present study involving combined structural and functional analyses of SCA3 revealed abnormalities in the functional interactions between the cerebellar, default, sensorimotor, and frontoparietal cortical networks. These abnormal patterns show reasonable association with gene mutation severity and cognitive deficits. These results provide new insights into the understanding of the potential role of the cerebellum in SCA3.
ACKNOWLEDGMENTS
This work was supported by the Natural Science Foundation of China (grant Nos. 82071910, 81601478, 82121003, 62036003, U1808204), and the Key Project of Research and Development of Ministry of Science and Technology (No. 2018AAA0100705).
CONFLICT OF INTEREST
The authors declare no conflict of interest.
Open Research
DATA AVAILABILITY STATEMENT
The raw anonymized imaging data set used in this article will be shared only for research purposes.


