Functional expression of electrogenic sodium bicarbonate cotransporter 1 (NBCe1) in mouse cortical astrocytes is dependent on S255-257 and regulated by mTOR
Present address: Shokoufeh Khakipoor, Molecular Brain Development, Hertie Institute for Clinical Brain Research, 72076 Tuebingen, Germany.
Present address: Shefeeq M. Theparambil, Centre for Cardiovascular and Metabolic Neuroscience, Neuroscience, Physiology & Pharmacology, University College London, London, WC1E 6BT, United Kingdom.
Abstract
The electrogenic sodium bicarbonate cotransporter 1, NBCe1 (SLC4A4), is the major bicarbonate transporter expressed in astrocytes. It is highly sensitive for bicarbonate and the main regulator of intracellular, extracellular, and synaptic pH, thereby modulating neuronal excitability. However, despite these essential functions, the molecular mechanisms underlying NBCe1-mediated astrocytic response to extracellular pH changes are mostly unknown. Using primary mouse cortical astrocyte cultures, we investigated the effect of long-term extracellular metabolic alkalosis on regulation of NBCe1 and elucidated the underlying molecular mechanisms by immunoblotting, biotinylation of surface proteins, intracellular H+ recording using the H+-sensitive dye 2′,7′-bis-(carboxyethyl)-5-(and-6)-carboxyfluorescein, and phosphoproteomic analysis. The results showed significant downregulation of NBCe1 activity following metabolic alkalosis without influencing protein abundance or surface expression of NBCe1. During alkalosis, the rate of intracellular H+ changes upon challenging NBCe1 was decreased in wild-type astrocytes, but not in cortical astrocytes from NBCe1-deficient mice. Alkalosis-induced decrease of NBCe1 activity was rescued after activation of mTOR signaling. Moreover, mass spectrometry revealed constitutively phosphorylated S255-257 and mutational analysis uncovered these residues being crucial for NBCe1 transport activity. Our results demonstrate a novel mTOR-regulated mechanism by which NBCe1 functional expression is regulated. Such mechanism likely applies not only for NBCe1 in astrocytes, but in epithelial cells as well.
1 INTRODUCTION
The electrogenic Na+/HCO3− cotransporter 1 (NBCe1) belongs to the cellular equipment for regulation of intracellular pH and is widely expressed in neural and nonneural cells (reviewed by Parker & Boron, 2013; Rickmann, Orlowski, Heupel, & Roussa, 2007; Roussa, Nastainczyk, & Thévenod, 2004; Thévenod, Roussa, Schmitt, & Romero, 1999; Deitmer, 1991). In cortical astrocytes, NBCe1 is highly sensitive to bicarbonate (Theparambil, Ruminot, Schneider, Shull, & Deitmer, 2014), operates with a stoichiometry 1Na+:2HCO3−, can shuttle base equivalents inward or outward, and is a key molecular component in modulating intracellular, extracellular, and synaptic pH (reviewed in Deitmer & Rose, 2010; Nedergaard & Verkhratsky, 2012). Recently, the mode of action of NBCe1 after short-term acid–base changes has been elucidated and has contributed to a better understanding of the functional role of NBCe1 in astrocytes. During extracellular acid/base disturbances, intracellular pH (pHi) of mouse astrocytes is primarily influenced by changes in HCO3− gradients across the plasma membrane rather than by changes in extracellular [CO2] or pH (Theparambil et al., 2017). Acute intracellular alkalosis reverses NBCe1 and, by acting as an acid loader, NBCe1 contributes to the recovery from alkalosis by HCO3− extrusion (Theparambil, Naoshin, Thyssen, & Deitmer, 2015). Surprisingly, despite the importance of astrocyte-dependent and pH-mediated modulation of neuronal excitability (Chesler, 2003), the molecular mechanisms underlying regulation of astrocytic NBCe1 activity after acid–base changes have not been elucidated. Such knowledge would be of particular importance because many pathophysiological conditions in the brain are associated and/or accompanied by pH shifts. Whereas the intracellular or extracellular pH falls during cerebral ischemia (Lipton, 1999; Yao & Haddad, 2004) and tumor, a rise in brain pH is known to enhance neuronal excitability. Furthermore, carbonic anhydrase inhibitors, such as acetazolamide, are known to exert anticonvulsant effects. Although the link between brain alkalosis and epilepsy has been appreciated, and changes of NBCe1 expression have been observed following spontaneous seizures (Kang et al., 2002), a putative NBCe1-dependent astrocytic response to sustained, chronic alkalosis has not yet been addressed. We have previously used an in vitro model of epilepsy and shown that the K+-channel blocker 4 aminopyridine (4AP) regulates transcription, surface expression, and activity of NBCe1 in astrocytes (Schrödl-Häußel, Theparambil, Deitmer, & Roussa, 2015), a process that requires TGF-β (Khakipoor et al., 2017).
Phosphorylation of NBCe1 has been identified as crucial determinant for regulation of NBCe1 trafficking and functional expression. In epithelial cells, phosphorylation of S1026 mediates the cAMP-dependent shift in the stoichiometry of NBCe1-B (Gross et al., 2003), SPAK-dependent phosphorylation at S65 leads to internalization of NBCe1 and decreased membrane expression (Hong et al., 2013; Yang et al., 2011), and individual phosphorylation of S12, S65, and S232–235 results in various NBCe1-B conformations with distinct transport properties (Vachel et al., 2018). Phosphoproteomic analysis in mice with conditional deletion of mTORC1 signaling from renal proximal tubule showed decreased phosphorylation of T3, S1060, and S232 of NBCe1 (Grahammer et al., 2017), but the functional significance of these phosphorylation sites on transporter activity has not been addressed.
In the present study, we have investigated regulation of NBCe1 after long-term metabolic alkalosis in mouse cortical astrocytes. We show that alkalosis downregulates NBCe1 activity without affecting protein abundance or surface expression of NBCe1, an effect that was rescued after activation of mTOR. In mutational analyses, we also unravel the functional significance of the S255-257, a sequence patch that was found to be constitutively phosphorylated in NBCe1. Moreover, we identify mTOR-signaling pathway as a regulator of NBCe1 function.
2 MATERIAL AND METHODS
2.1 Antibodies and reagents/chemicals
Following antibodies were used as primary antibodies: anti-SLC4A4 rabbit polyclonal from Alomone Labs (Cat# ANT-075, RRID:AB_2341019), and Abcam (Cat# ab30323) for western blots; anti-SLC4A4 from Atlas Antibodies (Cat# HPA035628, RRID:AB_2674708) for immunocytochemistry; anti-GAPDH mouse monoclonal from Abcam (Cat# ab8245, RRID:AB_2107448), anti-Vinculin rabbit polyclonal from Cell Signaling Technology, (Cat# 4650, RRID:AB_10559207), anti-Na+/K+-ATPase mouse monoclonal from DSHB, (Cat# a6F, RRID:AB_528092), anti-GFAP mouse monoclonal from Merck Millipore (Cat# MAB360, RRID:AB_11212597), anti-mTOR rabbit monoclonal from Cell Signaling Technology (Cat# 2983, RRID:AB_2105622), and anti-p-mTOR rabbit monoclonal from Cell Signaling Technology, (Cat# 5536, RRID:AB_10691552). Following antibodies were used as secondary antibodies for immunofluorescence: goat anti-rabbit or anti-mouse IgG coupled to AlexaFluor488 or AlexaFluor568, from Santa Cruz Biotechnology, (Cat# sc-2005, RRID:AB_631736), or from Cell Signaling Technology (Cat# 7074, RRID:AB_2099233). For western blots, goat-anti-mouse or anti-rabbit IgG coupled to horseradish peroxidase from Jackson ImmunoResearch Labs (Cat# 715-475-151, RRID:AB_2340840) or from Thermo Fisher Scientific (Cat# A10042, RRID:AB_2534017) were used as secondary antibodies. Ethylisopropyl amiloride (EIPA), and 4,4′-Diisothiocyano-2,2′-stilbenedisulfonic acid (DIDS) were purchased from Tocris Bioscience (Cat# 3378, and Cat# 4523, Bristol, UK), BCFEF from ThermoFisher Scientific, (Cat# B8806, IL), and 3-Benzyl-5-((2-nitrophenoxy)methyl)-dihydrofuran-2(3H)-one (3BDO) from Sigma (Cat# SML1687, Darmstadt, Germany).
2.2 Animals
All protocols were carried out in accordance with German ethical guidelines for laboratory animals and approved by the Institutional Animal Care and Use Committee of the University of Freiburg (authorizations: X-14/16H and X-15/06H). Adult C57BL/6N mice (strain code 027) of either sex were maintained on a 12 hr dark/light cycle with food and water ad libitum. Mice were sacrificed by cervical dislocation, and all efforts were made to minimize suffering. Slc4a4 deficient mice have been described earlier (Gawenis et al., 2007).
2.3 Cell culture
2.3.1 Mouse primary cortical astrocyte cultures
For primary culture of mixed glia, mouse pups aged P2/P3 were used, according to McCarthy and de Vellis (1980) with minor modifications (Khakipoor et al., 2017). Cortices were dissected and immediately collected in cold HBSS on ice. After application of trypsin and incubation at 37°C for 30 min, probes were centrifuged for 5 min at 1,300 rpm and supernatant was removed. Pellets were resuspended in plating medium (DMEM) and vigorously pipetted (20–30 times) to obtain single cell suspensions. Single cells were then plated on poly-d-Lysine coated 25 cm2 flasks or coverslips in petri dishes. Culture medium was changed every second day and experiments were carried out after 15–21 days in vitro. Culture medium was replaced by medium adjusted to pH 7.4, or 7.8 with 26 mM, or 60.1 mM NaHCO3, respectively, in the presence or absence of 60 μM 3BDO for 6 hr at 37°C in a 5% CO2 incubator. Subsequently, cultures were processed for immunoblotting, surface biotinylation of proteins, intracellular H+ recordings, or immunofluorescence.
2.3.2 Immunocytochemistry
Immunofluorescence of cultures has been performed as previously described (Khakipoor et al., 2017). Primary antibodies (NBCe1 1:200, GFAP 1:1,000) were diluted in PBS. Cells were incubated with secondary antibodies goat anti-mouse IgG coupled Alexa 488 (1:400) and goat anti-rabbit IgG coupled to Alexa 568 (1:400) for 1 hr at RT and viewed with a Leica TCS SP8 confocal microscope (Wetzlar, Germany).
2.3.3 Immunoblotting
Primary cortical astrocytes were harvested and homogenized, and protein concentration was determined by Thermo Scientific NanoDrop 2000 spectrophotometer. Electrophoresis and blotting procedures were performed as described (Khakipoor et al., 2017). Primary antibodies were diluted as follows: NBCe1 1:5,000, GAPDH 1:10,000, Na+/K+-ATPase 1:1,000, Vinculin 1:2,000, and mTOR 1:1,000, p-mTOR1 1:1,000. Blots were developed in enhanced chemiluminescence reagents and signals were visualized on X-ray films. Subsequently, films were scanned and the signal ratio NBCe1: GAPDH, NBCe1: Na+/K+-ATPase, mTOR: Vinculin, and p-mTOR: Vinculin was quantified densitometrically. Differences in signal ratio were tested for significance using unpaired Student's t test or one-way ANOVA and Bonferroni post hoc test. Results with levels of *p < .05 were considered significant.
2.3.4 Cell surface biotinylation
Primary cortical astrocytes were subjected to control or extracellular alkalosis in presence or absence of 3BDO for 6 hr and then kept on ice. Isolation of cell surface proteins was performed using the Pierce® cell surface protein isolation kit following the manufacturer's instructions. Proteins were then processed for immunoblotting with antibodies against NBCe1, Na+/K+-ATPase, and Vinculin, as described above.
2.3.5 MTT assay
Controls and alkalosis-exposed astrocytes were incubated with 1 mg/mL 3-(4,5-dimethylthiazol-2-yl)-2,5-diphenyl-tetrazolium bromide, MTT (Cat# M6494, ThermoFisher Scientific, MA), for 4 hr at 37°C in a 5% CO2 incubator, according to the manufacturer's protocol. Color intensity of the produced formazan was measured using a Vector microplate reader (PerkinElmer, MA), (Liu, Peterson, Kimura, & Schubert, 1997). All treatments were performed in triplicate.
2.3.6 Intracellular H+ imaging in cortical astrocytes
To measure intracellular H+ concentration ([H+]i) changes in cultured cortical astrocytes in the presence or absence of 3BDO, we used a Visitron imaging system (http://www.visitron.de/) and the acetoxymethyl ester of a proton-sensitive dye, 2′,7′-bis-(carboxyethyl)-5-(and-6)-carboxyfluorescein (BCECF-AM, Cat# B8806), as described previously (Theparambil et al., 2014). Cells were incubated with 3 μM BCECF-AM in bicarbonate-buffered saline solution for 15 min at room temperature. Cells were then mounted on a chamber of the Nikon ECLIPSE TE200 microscope and perfused continuously at room temperature with CO2/HCO3− -buffered saline solutions (in mM): NaCl 116, KCl 3, NaH2PO4 0.5, α-D-glucose 2, NaHCO3 26, MgCl2 1, and CaCl2 2, pH 7.4 or NaCl 82.1, KCl 3, NaH2PO4 0.5, α-D-glucose 2, NaHCO3 26, MgCl2 1, and CaCl2 2, pH 7.8. BCECF was excited consecutively at 488 nm (proton-sensitive wavelength) and 440 nm (close to isosbestic point), and the changes in fluorescence emission were monitored at >505 nm (using ET540/40 m filter). Images were obtained every 10 s with a ×20 objective. The fluorescence emission intensity of 488 nm excitation changes inversely with a change in [H+]i, whereas the fluorescence emission intensity of 440 nm excitation is largely pH insensitive. The changes in [H+]i were monitored using the ratio F(440)/F(488). The ratio was converted into pH and absolute intracellular proton concentrations ([H+]i) by using the nigericin-based (4 μM) calibration technique (Khakipoor et al., 2017; Theparambil et al., 2014). Cells were perfused with calibration solution containing (in mM): KCl 145, NaH2PO4 0.4, Na2HPO4 1.6, Glucose 5, MgCl2 6H2O 1, Ca-DiGluconat H2O 1.3, adjusted at pH 6.5, 7.0, 7.5, and 8.0.
2.3.7 Constructs and transfection of HeLa cells
Wild type (WT) and mutant (Mut) constructs from NBCe1 (Slc4a4) sequence (NM_018760) were designed with Geneious version 10.0 (created by Bio matters, www.geneious.com). To generate the mutant constructs, the coding sequence for aa 255, 256, 257 of the wild-type NBCe1 was altered from TCC, TCC, and AGT, each coding for a serine, to GCC, GCC, and GCT in Mut-NBCe1-B-1, each coding for an alanine, mimicking the dephosphorylated status, and to GAC, GAC, GAT in Mut-NBCe1-B-2, each coding for an aspartate, mimicking the phosphorylated status. The sequences of wild type and the two mutants were introduced to a backbone of the pEGFP-C1 vector (Clontech, CA), respectively, according to Yang et al. (2009; Figure S1). Constructs were synthesized by GeneCust (Luxembourg).
HeLa cells grown on coverslips were transfected with 500 ng/mL of WT-NBCe1, Mut-NBCe1-B-1 or Mut-NBCe1-B-2 constructs using Lipofectamine P3000 (ThermoFisher Scientific, MA), following the manufacturer's instructions. Culture medium was replaced by medium adjusted to pH 7.4 (containing 26 mM NaHCO3) after 24 hr of transfection. Intracellular H+ imaging was performed 48 hr after transfection. In order to identify the transfected cells, images were taken using a ×20 air objective before loading the cells with BCECF dye. For quantification of mean GFP intensity in the experimental conditions, regions of interest were defined and intensity was compared using the Visitron imaging software. Background subtraction was applied to all the images.
2.3.8 Intracellular pH measurements in HeLa cells
Intracellular pH measurements in HeLa cells were performed essentially as described above. However, cells were perfused continuously at room temperature with CO2/HCO3−-buffered solution (in mM): NaCl 115, KCl 5, α-d-glucose 10, NaHCO3 25, MgCl2 1, and CaCl2 1, pH 7.4. For intracellular acidification, cells were perfused with 20 mM NH4Cl in a Na+-free bath solution. NBCe1 cotransporter activity was initiated by perfusing HeLa cells with HCO3−-buffered solution containing 140 mM Na+. In Na+-free HCO3−-buffered solutions, NaCl, and/or Na+HCO3− were replaced with equimolar concentrations of N-methyl-d-glucamine-Cl, and choline bicarbonate, respectively. All solutions were adjusted to pH 7.4. NBCe1 cotransporter activity was calculated from the slope of change in pHi/min (pHi recovery rate after acidification). Further, NBCe1 cotransporter activity was measured by applying 10 μM EIPA to inhibit all Na+–H+ exchangers, and in the presence or absence of 500 μM DIDS (Namkoong et al., 2015) or 3BDO. Only cells with the same GFP intensity were considered.
2.3.9 Phosphoproteomic analysis of NBCe1

3 RESULTS
Previous studies have shown NBCe1-dependent bicarbonate sensing and regulation of its activity during hypocapnic alkalosis and acute intracellular alkalosis in cortical astrocytes (Theparambil et al., 2015, 2017; Theparambil, Weber, Schmälzle, Ruminot, & Deitmer, 2016). We have asked whether long-term metabolic alkalosis might affect expression of the electrogenic Na+/HCO3− cotransporter (NBCe1). Therefore, primary cortical astrocytes were exposed to extracellular alkalosis (pHo 7.8; 60.1 mM HCO3−) from 30 min to 6 hr and subsequently NBCe1 protein abundance was determined by immunoblot analysis. Using an antibody raised against NBCe1, immunoreactive bands at ~110 kDa, ~130 kDa, and ~150 kDa were detected in controls (Figure 1a). By immunoblot analysis of cortical astrocytes from Nbce1 +/+ and Nbce1 −/− mice, the ~130 kDa and ~110 kDa bands were revealed to be specific for NBCe1 (Figure 1b). At the time points investigated, protein expression was comparable in cells that have been exposed to metabolic alkalosis, compared to the untreated controls (Figure 1a,c; 1.02 ± 0.04 fold, 0.95 ± 0.01 fold, 0.98 ± 0.03 fold, 0.94 ± 0.007 fold, 0.96 ± 0.02 fold, and 0.94 ± 0.02 fold for exposure to alkalosis for 30 min, 1 hr, 2 hr, 3 hr, 4 hr, and 6 hr, respectively, not significant using two-tailed unpaired Student's t test, n = 3).
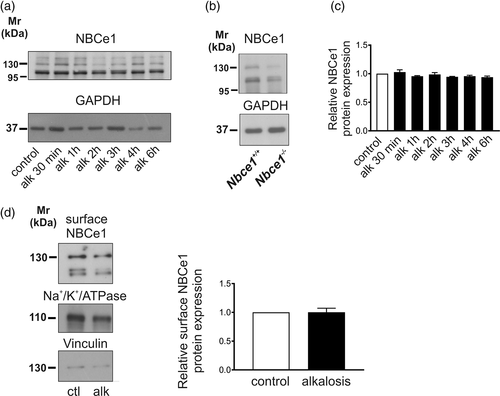
Since exposure of cells to extracellular acid–base changes for 6 hr has been shown to induce incorporation or retrieval of acid–base transporters, including NBCe1, to/from the cell membrane in other cells paradigms (Oehlke, Martin, Osterberg, & Roussa, 2011; Oehlke, Schlosshardt, Feuerstein, & Roussa, 2012; Oehlke, Speer, & Roussa, 2013), we have performed biotinylation of surface proteins and enrichment. Subsequent immunoblotting (Figure 1d) revealed that NBCe1 membrane expression was comparable between control and alkalotic astrocytes (1.00 ± 0.07 fold, not significant, using the two-tailed unpaired Student's t test, n = 6). These data suggest that metabolic alkalosis does not regulate NBCe1 surface or total protein expression.
3.1 Extracellular alkalosis regulates NBCe1 transport activity in cortical astrocytes
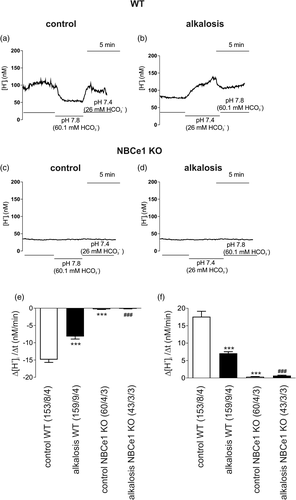
Previous studies have highlighted that cortical astrocytes reveal a particular high bicarbonate sensitivity that is mediated by NBCe1 (Theparambil et al., 2014). We asked whether increased extracellular [HCO3−] for 6 hr would regulate NBCe1 transport activity. Intracellular [H+] recordings have been performed and [H+]i was monitored in cultured wild type (WT) (Figure 2a,b) and Slc4a4 deficient (Figure 2c,d; NBCe1 KO) cortical control (not treated) astrocytes and in alkalosis-treated astrocytes loaded with the H+-selective dye BCECF. NBCe1 activity was challenged by increasing the pH value and [HCO3−] of the external solution from 7.4 and 26.0 mM to 7.8 and 60.1 mM, respectively. This activates NBCe1 to transport Na+-HCO3− into the cells, which results in a decrease of [H+]i. This decrease in [H+]i, was determined in control (not treated) and in alkalosis-treated astrocytes (Figure 2b). Using this experimental design, the rate of alkalinisation in pH 7.8 (Figure 2a,e) and the rate of acidification upon returning from pH 7.8 to pH 7.4 (Figure 2a,f) was measured. A significant decrease in both parameters was induced after extracellular alkalosis for 6 hr (−8.18 ± 0.74 nM/min and 7.07 ± 0.47 nM/min) compared to control (−14.87 ± 0.82 nM/min and 17.6 ± 1.55 nM/min) (Figure 2e,f). In control, as well as in alkalotic NBCe1-KO astrocytes, rate of alkalinisation (−0.297 ± 0.068 nM/min and − 0.147 ± 0.048 nM/min, respectively) and rate of acidification (0.34 ± 0.076 nM/min and 0.66 ± 0.146 nM/min, respectively) were almost abolished as compared to WT cells.
3.2 Survival of astrocytes is not compromised following long-term extracellular alkalosis
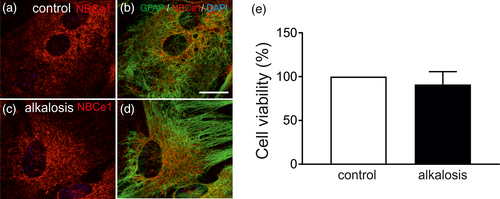
Having shown that NBCe1 activity is dramatically decreased in alkalosis-exposed mouse astrocytes, we asked whether such reduction might be a consequence of increased cell death. For this, double immunofluorescence for NBCe1 (red) and GFAP (green) in control cortical astrocytes and in those exposed to extracellular metabolic alkalosis for 6 hr was performed. NBCe1 immunoreactivity in cortical astrocytes was of moderate intensity, and predominantly distributed in the cell soma, confirming previous observations (Figure 3a,b). Following exposure to extracellular alkalosis (Figure 3c,d) no differences in labeling intensity and distribution pattern could be observed, confirming the immunoblot data in Figure 1. In addition, no morphological alterations could be detected that could be indicative signs of cell death following alkalosis. Viability of control and alkalotic astrocytes was additionally tested by MTT assays (Figure 3e). Alkalotic astrocytes revealed a viability of 91.11 ± 14.59% (n = 3), thus showed no significant differences compared to the untreated controls. These data suggest that the observed decrease of NBCe1 transport activity following extracellular metabolic alkalosis cannot be attributed to increased cell death.
3.3 Regulation of mTOR signaling during extracellular alkalosis
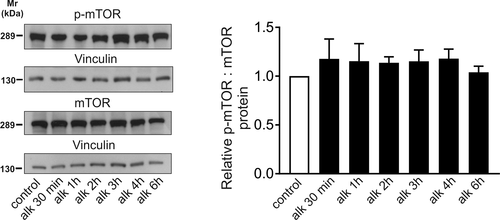
It has been shown in renal proximal tubule cells that mTORC1 regulates endocytosis and transport processes and its conditional deletion leads to significantly decreased phosphorylation of several serine residues of NBCe1 (Grahammer et al., 2017). We investigated protein abundance of total mTOR and of phosphorylated (p-mTOR) in control cortical astrocytes and in astrocytes that had been exposed to extracellular metabolic alkalosis for different time periods, ranging from 30 min to 6 hr. Figure 4 illustrates immunoblot analysis of homogenates from controls and alkalotic astrocytes using mTOR and p-mTOR antibodies. Using the anti-mTOR antibody a prominent immunoreactive band at ~289 kDa could be detected in homogenates of controls corresponding to the molecular mass of mTOR full-length protein. Following exposure to alkalosis from 30 min to 6 hr, no differences in both total mTOR and p-mTOR abundance could be observed. Quantification of the relative amount (p-mTOR: Vinculin): (mTOR: Vinculin) of protein indeed revealed comparable values for control astrocytes and alkalotic astrocytes (after 30 min [1.17 ± 0.20 fold], 1 hr [1.15 ± 0.18 fold], 2 hr [1.13 ± 0.06 fold], 3 hr [1.15 ± 0.11 fold], 4 hr [1.17 ± 0.09 fold], and 6 hr [1.03 ± 0.06 fold], not significant, using one-way ANOVA and Bonferroni post hoc test, n = 3–4).
3.4 Activation of mTOR signaling prevents alkalosis-induced decreased NBCe1 transport activity
Taken into consideration that the results in Figure 4 derive from whole cell homogenates from cultures of mixed glia, we investigated whether further activation of mTOR might be able to rescue alkalosis-induced reduced NBCe1 transport activity in astrocytes (shown in Figure 2). To that end, cultures were exposed to extracellular metabolic alkalosis for 6 hr in the presence or absence of 60 μM 3BDO, an activator of mTOR signaling (Ge et al., 2014). NBCe1 activity in astrocytes was challenged by increasing the pH value and [HCO3−] of the external solution from 7.4 and 26.0 mM to 7.8 and 60.1 mM, respectively, and intracellular [H+] was measured (Figure 5a–c). Subsequently, the rate of alkalinisation in pH 7.8 and the rate of acidification upon returning from pH 7.8 to pH 7.4 were determined. Following activation of mTOR, astrocytes exposed to alkalosis revealed significantly increased rate of acidification (54.14 ± 2.88 nM/min) compared to alkalotic astrocytes without activated mTOR (29.47 ± 2.45 nM/min), and comparable values to that of controls (56.39 ± 4.56 nM/min, Figure 5d). The rate of alkalinisation after activation of mTOR was also significantly increased (−49.26 ± 4.22 nM/min), compared to alkalotic astrocytes in the absence of 3BDO (−23.76 ± 3.10 nM/min), and comparable to control astrocytes (−58.91 ± 7.38 nM/min, Figure 5d). In contrast to alkalotic astrocytes, exposure of control astrocytes to 3BDO did not further increase NBCe1 activity (Figure S2).
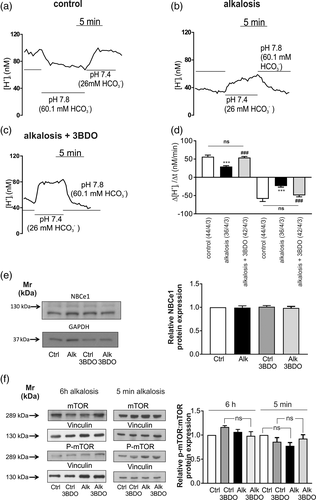
We next tested whether 3BDO might have influenced NBCe1 protein expression in cortical astrocytes. As shown in Figure 5e, NBCe1 protein was comparable in all experimental conditions (0.99 ± 0.04 fold, 1.01 ± 0.02 fold, 0.98 ± 0.03 fold for alkalosis, control + 3BDO, and alkalosis + 3BDO, respectively, not significant, using one-way ANOVA and Bonferroni post hoc test, n = 3), thus demonstrating that the differences in NBCe1 transport activity observed (Figure 5d) are not due to decreased NBCe1 protein expression.
As a next step, we asked whether restored NBCe1 activity in alkalotic astrocytes following application of 3BDO was accompanied by detectable changes of amount of phosphorylation on expressed mTOR protein (5f). Treatment with 3BDO for 6 hr in alkalotic astrocytes revealed no significant differences in relative amount of phosphorylation on expressed mTOR protein (0.98 ± 0.09 fold) calculated as (p-mTOR/Vinculin)/(mTOR/Vinculin) compared to alkalotic astrocytes (1.06 ± 0.05 fold). Moreover, treatment of control astrocytes with 3BDO for 6 hr did not increase relative phospho-TOR: total m-TOR protein abundance (1.17 ± 0.03 fold), compared to untreated controls or compared to alkalotic astrocytes in the presence of 3BDO. Finally, we tested putative regulation of mTOR activation as a response to acute extracellular alkalosis and determined p-mTOR levels after short exposure to alkalosis in the presence or absence of 60 μM 3BDO. As shown in Figure 5f, following exposure to alkalosis for 5 min, the relative amount of phosphorylation on expressed mTOR protein was decreased (0.77 ± 0.07 fold), although not significantly different, compared to the untreated controls. Notably, in the presence of 3BDO alkalotic astrocytes revealed no significant differences in relative amount of phosphorylation on expressed mTOR protein (0.93 ± 0.08 fold), compared to control astrocytes in the presence of 3BDO (0.86 ± 0.09 fold).
3.5 Phosphorylation site occupancies on NBCe1
Based on the results from Figure 5a–d, we next asked whether the observed recovery of NBCe1 function during alkalosis in the presence of 3BDO might be attributed to changes in phosphorylation state of the NBCe1 protein. Therefore, surface proteins from control and alkalotic astrocytes in the presence or absence of 3BDO were enriched and processed for phosphoproteomic analysis. Intensities of all peptides that have a localization probability of ≥75% for a certain phosphosite or phospho-patch (containing several sites) were summed up, as described in Section 2. Among the detected phosphosites and -patches, namely pS232-233/pS235, pS245, and pS255-257, the site pS245 and the patch pS255-257 showed the highest MS response (Figure S3a) rendering the quantification across conditions most robust for these sites. However, intensities showed in part high variations across replicates and, thus, no significant differences could be detected for identified phosphosites or -patches in alkalosis and 3BDO treatment compared to control (Figure 6a). Functional relevance of phosphorylation sites may also be derived from their abundance. Unfortunately, MS intensities cannot readily be used to estimate absolute abundances across different peptides due to differing, peptide sequence dependent response factors. In an attempt to nevertheless obtain a proxy for phosphorylation abundance and thus functional relevance, we additionally calculated the phosphorylation site occupancy, that is, the fraction of a given protein that is phosphorylated at a given site (Olsen et al., 2010) as described in Section 2. Comparison of phosphorylation site occupancies on NBCe1 in control astrocytes revealed a phosphorylated fraction of on average 51% for the well-known and IRBIT-regulated phosphorylation sites at pS232-233, pS235-236 (Hong et al., 2013; Vachel et al., 2018), 70% for pS245 and 53% for pS255-257 (Figure S3b). Comparison of pS255-257 and pS245 occupancies across conditions did again not reveal any significant differences (Figure 6b and Figure S3c).
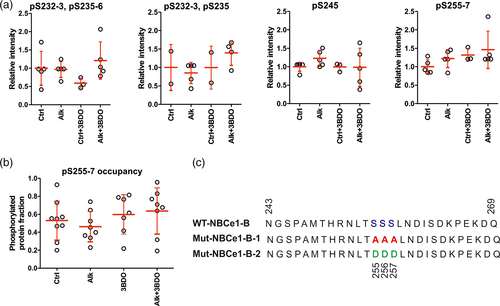
Although not significant, occupancy in alkalotic astrocytes was only increased for pS255-257 upon 3BDO treatment (on average 64% compared to 46%, Figure 6b). Therefore, we chose to further examine a potential role of pS255-257 for NBCe1 activity. Notably, most of acquired spectra for the phosphopatch pS255-257 (29 of 40) identified S257 to be phosphorylated with a localization probability of >75%. However, since the localization was ambiguous in other spectra, we generated three EGFP constructs with NBCe1-B containing different amino acids in all three positions from 255 to 257. For WT-NBCe1-B, the three serine residues were kept; in Mut-NBCe1-B-1, the serine residues were substituted with alanine, thus mimicking the dephosphorylated state, and Mut-NBCe1-B-2 contained three aspartate residues instead, thereby mimicking the phosphorylated state (Figure 6c).
3.6 NBCe1 transport activity depends on the mutation status of S255-S257
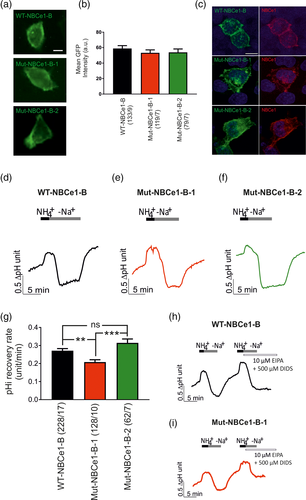
HeLa cells were transiently transfected with either WT-NBCe1-B, Mut-NBCe1-B-1, or Mut-NBCe1-B-2 and NBCe1 transport activity was determined. To ensure that the amount of NBCe1 is comparable between wild type- and mutant-transfected cells, mean GFP intensity was quantified (Figure 7a,b). No significant differences were detected between the groups (58.88 ± 3.74, 53.28 ± 3.83, and 53.88 ± 4.39, for WT, NBCe1-B-1 and NBCe1-B-2, respectively, not significant using two-tailed unpaired Student's t test) Moreover, immunofluorescence for NBCe1 showed comparable labeling intensity and complete overlap with GFP in wild-type- and mutant-transfected HeLa cells (Figure 7c). We then compared the rate of intracellular pH (pHi) recovery from intracellular acidosis in wild-type- and mutant-transfected cells. Acidosis was caused by an NH4+ pulse in Na+-free solution and pHi recovery was induced at normal pH 7.4 when Na+ was added to the perfusion solution. A pHi recovery was consistently observed in cells transfected with WT-NBCe1-B, with a pHi recovery rate of 0.27 ± 0.01 pH units/min (Figure 7d,g), whereas in the cells transfected with the Mut-NBCe1-B-1, pHi recovery rate after addition of Na+ was significantly decreased (0.20 ± 0.01 pH units/min ***p < .001, Figure 7e,g). In contrast, in cells transfected with Mut-NBCe1-B-2 (Figure 7f), no differences in pHi recovery rate (0.31 ± 0.02 pH units/min) could be observed compared to the wild type. Moreover, in cells transfected with either WT-NBCe1-B or mutant NBCe1-B, no pHi recovery could be observed when cells were perfused with 10 μM EIPA in combination with 500 μM DIDS, as exemplarily shown in Figure 7h,i.
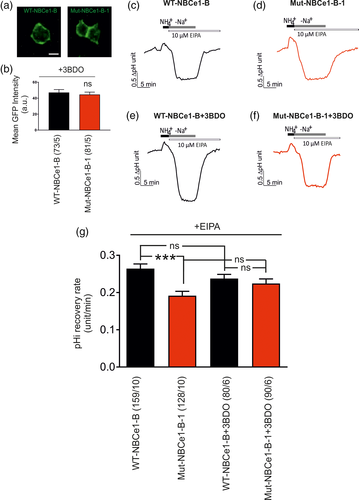
To test whether activation of mTOR has an impact on Mut-NBCe1-B-1 function, HeLa cells were transiently transfected with either WT-NBCe1-B or Mut-NBCe1-B-1 in the presence or absence of 3BDO. First, we have ensured that in the presence of 3BDO, the amount of transfected WT-NBCe1-B and Mut-NBCe1-B-1 construct is comparable in the cells examined, as determined by assessment of GFP intensity. As shown in Figure 8a,b, no significant differences in the mean GFP intensity could be observed between HeLa cells transfected with WT-NBCe1-B (47.13 ± 3.71) and Mut-NBCe1-B-1 (44.58 ± 3.08; not significant, using the two-tailed unpaired Student's t test). Subsequently, NBCe1 transport activity has been determined in the presence of 10 μM EIPA. When Na+ was added to the bath solution, the pHi recovery rate in cells transfected with WT-NBCe1-B was 0.26 ± 0.01 pH units/min (Figure 8c,g) and remained comparable following application of 3BDO (Figure 8e,g; 0.23 ± 0.01 pH units/min). Interestingly, similar results were also obtained in cells transfected with Mut-NBCe1-B-1. Showing a pHi recovery rate of 0.19 ± 0.01 pH units/min (Figure 8d,g), no significant difference in the presence of 3BDO (0.22 ± 0.01 pH units/min) was detected. Notably, in the presence of 3BDO, no significance difference on pHi recovery rate could be observed between cells transfected with WT-NBCe1-B or Mut-NBCe1-B-1. These data implicate that activation of mTOR pathway by 3BDO indeed affects NBCe1 functional expression by regulating phosphorylation of several residues of NBCe1-B.
4 DISCUSSION
In the brain, slight differences in intracellular and extracellular pH can considerably affect the biochemical, ion-regulatory, and electrical properties of neurons and glial cells. In astrocytes, the electrogenic Na+/HCO3− cotransporter NBCe1 (SLC4A4) is responsible for intracellular pH regulation and by its function as bicarbonate sensor, it dictates the response of astrocytes to extracellular acid–base disturbances (Theparambil et al., 2014, 2015, 2017; Theparambil & Deitmer, 2015). The biological significance of NBCe1 in the brain has been highlighted in patients with human mutations in the Slc4a4 gene (Horita et al., 2005; Igarashi et al., 1999; Suzuki et al., 2010; Toye et al., 2006).
We have previously elucidated two regulatory mechanisms for astrocytic NBCe1 transport activity. NBCe1 is regulated by 4AP through increased protein abundance and surface expression (Schrödl-Häußel et al., 2015), and is a direct target of TGF-β, a crucial molecular player in the context of epilepsy (Khakipoor et al., 2017). Here we have extended our previous work by first addressing the questions if astrocytic NBCe1 is regulated after long-term extracellular alkalosis and, if yes, what are the underlying molecular mechanisms.
We showed that extracellular alkalosis downregulates NBCe1 activity in mouse cortical astrocytes with unchanged surface protein abundance and cell survival. We also demonstrated that activation of mTOR is sufficient to rescue alkalosis-induced decreased NBCe1 activity. Besides the well-known functions of mTOR kinases, such as cell growth and metabolism (Hsu et al., 2011; Laplante & Sabatini, 2012), mTOR maintains renal tubular homeostasis by controlling transcellular transport processes (Grahammer et al., 2014), such as endocytosis and apical transport in proximal tubule cells and potassium secretion in the distal nephron (Grahammer et al., 2016, 2017). A recent study has proposed that potassium itself may act through mTORC2 to activate the ENaC-regulatory kinase SGK1, which in turn stimulates ENaC to enhance K+ secretion (Sørensen et al., 2019). Our results extend the cellular paradigms of mTOR-regulated transport by demonstrating for the first time mTOR-dependent regulation of ion transport in non-epithelial cells. In the cellular paradigm and context reported here, endogenous p-mTOR levels are likely sufficient to maintain baseline NBCe1 function under physiological conditions that, context-dependent, should not be increased. Consequently, additional activation of mTOR has no effects on NBCe1 function (Figure 5f, Figure S2). In contrast, in case of pathological stimuli, here alkalosis, and in the absence of mTOR activation, the transport activity of NBCe1 was reduced (Figure 5d). These observations implicate that the amount of p-mTOR does not necessarily and linearly correspond to NBCe1 transport activity, that is, more p-mTOR does not result in more NBCe1 functional expression. We interpret our data in that a threshold of mTOR activity is required to establish and maintain NBCe1 functional expression under physiological conditions. Is this threshold not reached under pathological conditions (decreased after 5 min exposure to alkalosis), then NBCe1 activity is impaired and further mTOR activation is needed to completely recover the flux through the cotransporter. The lack of detection of mTOR activation by western blotting can be attributed to the relative heterogeneity of the primary cultures, as will be discussed in the context of the phosphoproteomic data below. Whether the observed effects on NBCe1 transport activity can be attributed to mTORC1 or to mTORC2 complexes (Laplante & Sabatini, 2009, 2012) cannot be distinguished, since the activator 3BDO activates whole mTOR signaling (Ge et al., 2014).
Focusing on phosphorylation state of NBCe1, we identified similarities but also differences to findings of other groups. In the phosphoproteomic analysis used in the present study, we have calculated phosphorylation site occupancies of NBCe1. By using this method, we have not only performed relative quantitation of the fraction of phosphorylated protein, but we have determined the dynamics of individual residue phosphorylation as well. Among the identified constitutive phosphorylated serine residues of astrocytic NBCe1, pS245 revealed the highest occupancy, followed by pS255-257 and pS232-233/S236. The functional significance of S232-233/S235 phosphorylation of NBCe1 has been addressed in detail in epithelia and is well-established in the context of its regulation by IRBIT (inositol 1,4,5-trisphosphate [IP3] receptors binding protein released with IP3) (Hong et al., 2013; Yang et al., 2011). IRBIT-controlled serine phosphorylation sites of NBCe1-B in epithelia have been identified at positions 12, 65, 232, 233, and 235, whose differential phosphorylation status resulted in active or inactive conformations of the transporter and its sensitivity to intracellular chloride. The residues 255–257 were identified to be phosphorylated as well, however, not regulated by IRBIT (Vachel et al., 2018). In another study that has used a phosphoproteomic approach for global monitoring of native phosphorylation of plasma membrane proteins from a single mouse cerebellum, among the 41 proteins that fall into the category “transporters”, NBCe1 was found to be phosphorylated at several residues, among them S232-233 and S255-257 (Schindler, Ye, Jensen, & Nothwang, 2013). The most common phosphorylation residue of NBCe1 in this study, however, was found at S1029. There are definitively differences in identified phosphorylation sites between the data sets available on constitutive phosphorylation sites of NBCe1. Whether these differences have a biological/functional background, by means of cell type-specific or variant-specific differential phosphorylation of NBCe1, or are due the use of phosphoproteomic approaches with different sensitivities, need to be elucidated in future studies.
mTOR-regulated NBCe1 phosphorylation has been detected in some data sets released from large-scale phosphoproteomic approaches aimed to identify proteins whose phosphorylation state might be regulated by mTOR under pathological conditions (Hsu et al., 2011). Interestingly, in mice with conditional deletion of mTORC1 in the renal proximal tubule, phosphorylation of NBCe1 at T3, S1060, and S232 was reduced (Grahammer et al., 2017). Our results show that phosphorylation site occupancy for S255-257 was increased by ~20% following activation of mTOR signaling in alkalosis-exposed cortical astrocytes. The differences were not statistically significant due to the considerable variation between the samples. An explanation for the observed variability could be the use of primary cultures of mixed glia after 15–20 days in vitro that contain astrocytes at different stages of maturation and additionally other cells, among them not yet differentiated stem cells that could differentially respond to extracellular alkalosis and mTOR activation. This relative cellular heterogeneity of the samples may have been different for different replicates and masked the response of mature astrocytes. Indeed, for the functional experiments in the present study, only cells that could morphologically be identified as astrocytes have been recorded. Whether or not this assumption applies in this particular biological context, the mutational analysis clearly demonstrated that the residues S255-257 are functionally important for NBCe1 transport activity, and suggest that activation of mTOR triggers NBCe1 phosphorylation to rescue reduced NBCe1 function (Figures 7 and 8). In line with the results in control primary astrocytes (Figure S2), gain of function experiments, that is, transfection of the cells with the phosphomimetic construct showed no differences with regard to NBCe1 activity following activation of mTOR (Figure 7g), whereas loss of function experiments, that is, transfection of the cells with mutant mimicking the dephosphorylation state at S255-257 showed significant decreased pH recovery rate that could not be significantly increased by mTOR-dependent change of phosphorylation on other residues of NBCe1. These results provide first evidence of the functional significance of S255-257 phosphorylation on NBCe1 activity. However, we note that the difference of NBCe1 transport activity in this mutant after 3BDO addition was also not significantly decreased to the activity in wild type in the presence of 3BDO. This could hint to additional sites that are regulated by mTOR and may additionally regulate NBCe1 transport activity.
Taken together, the results of the present study have demonstrated for the first time that NBCe1 activity is mediated by mTOR and uncovered that S255-257 in NBCe1 affects NBCe1 functional expression, a process that is likely mediated via phosphorylation by mTOR. Such mechanism likely applies not only for NBCe1 in astrocytes, but in epithelial cells as well.
ACKNOWLEDGMENTS
We thank Ellen Gimbel and Melanie Feuerstein for technical assistance, Dr. Stephanie Heinzlmeir for critical discussion of the phosphoproteomics data, and Gary E. Shull, Cincinnatti, U.S., for providing NBCe1-KO mice.
CONFLICT OF INTEREST
The authors declare no conflict of interest.


