Photocatalytic Degradation of Methylene Blue Dye using PANI-CuFe2O4 Nano Composite
Abstract
The present perspective accentuates the synthesis of PANI-CuFe2O4 (PCF) nanocomposite, and photocatalytic degradation of methylene blue (MB) dye using a synthesized composite. The stable PCF is confirmed and characterized by analytical techniques, namely, fourier transform infrared (FTIR) and X-ray photoelectron (XPS) spectroscopy, X-ray diffraction (XRD), energy-dispersive X-ray (EDX), scanning electron microscopy (SEM), and vibrating sample magnetometry (VSM) analysis. The synthesized PCF nanocomposites are significantly crystalline in nature, having magnetic saturation of 10.47 emu g−1, and monoclinic crystalline structure as well as the size of nanocomposite is 39.54 nm verified by XRD pattern. SEM analysis revealed a regular porous and rough surface of nanocomposite. In addition, the nanocomposite divulged the remarkable efficient elimination of MB dye with maximum removal of 96% with good fitting of Langmuir isotherm, indication of monolayer formation on the catalyst surface through the interaction between nanocomposite and dye molecule. The adsorption kinetics bolstered the pseudo-second-order kinetic model, suggesting the adsorption process proceeded by chemisorption. The most notable feature of the nanocomposite is the reusability and good stability after several cycles, maintaining 90% after five cycles.
1 Introduction
Water, an integral element of the environment, is frequently defiled owing to the excessive application of fertilizers, pesticides, chemicals, and dyes in farmland as well as industries, resulting in getting mixed with water bodies.[1] Of them, organic dyes extensively used in textile, leather, cosmetics, printing, paper, and food processing industries exert detrimental effects on biota since the organic dyes cause a variety of illnesses including the poisoning of the central nervous system, skin rashes, kidney and liver damage, and blood abnormalities.[2, 3] Consequently, the foremost and supreme concern is to protect the aqueous medium from the adverse effects of dyes. The purport, however, is implemented through a myriad number of analytical techniques, including oxidation, oxidation process, electrochemical destruction, Fenton reaction, ozonation, irradiation, filtration, ion exchange, reverse osmosis, photochemical, and ultraviolet irradiation.[4] In this regard, the relation between surface area and amount of adsorbent highly influences the removal of organic dyes from aqueous medium [Reference]. Nanotechnology is the suitable solution to eliminate organic dye because of its remarkable cost reduction, easy way to synthesize, and capability to amass large volumes of pollutants.
Over the last few decades, semiconducting magnetic ferrites of different metals such as Co, Cu, Ni, Mn, Zn, Sr etc. have been employed in the form of nano size for the distillation of waste water owing to distinctive properties, for instance, spinel structure, composition, high stability, recyclability, and low bandgap energy.[5] This research highlights the synthesis of nanocomposite (PANI-CuFe2O4), a promising photocatalyst, for the photodegradation of MB as a model dye. The major component of the composite is copper ferrite (CuFe2O4), a semiconductor material, which is less toxic with excellent magnetic properties, photochemical stability, and higher catalytic activity without secondary contamination.[6, 7] But, the main limitation of CuFe2O4 is the low catalytic activity owing to the higher recombination rate of electron-hole (e-/h+) pairs.[8] The annexation of various polymeric materials with CuFe2O4 upgrades the catalytic performance. Recently, carbon based supporting materials, including graphene, graphitic carbon nitride, activated carbon, and nitrogen-doped carbon nanotubes have been reported as promising catalysts due to their high surface areas and electron transfer capability.[9] Moreover, conducting polymer based nanocomposites are employed with various metal ferrites for the enhancement of catalytic performance of both of them.[10, 11] Numerous studies have been conducted on the combination of two distinct materials to adjust the bandgap of the photocatalyst to improve the electron-hole charge separation, which leads to an increase in the responsiveness of the photocatalyst under visible light or solar light irradiation.[12] Of them, Polyaniline (PANI), a conducting polymer, has received extensive attention because of its distinctive properties, including p-type semiconductor with narrow bandgap, electron donor, and hole acceptor leading to effective charge separation, environmentally benign, non-hazardous, and easy synthesis route. But, poor mechanical characteristics, and low stability have limited the applications of PANI in many environmental applications.[8, 13, 14] However, the incorporation of PANI in CuFe2O4 ameliorated the catalytic performance in the current study. Moreover, extensive researches have been conducted on composite materials such as CuFe2O4-graphene oxide (GO) Fourier transform infrared,[15] CuFe2O4-TiO2-GO,[16] PANI-NiFe2O4,[11] PANI-g-C3N4,[17] Chitosan Grafted-Polyaniline/Co3O4,[14] Ternary-CoFe2O4-PANI nanocomposite[12] that have been used in degrading dyes under different conditions.
The aim of this research was to develop an environmentally friendly, stable, magnetically recoverable, and rapid photocatalytic efficient polyaniline-copper ferrite photocatalyst for the treatment of industrial dye containing wastewater under visible light irradiation.
2 Results and Discussion
2.1 Characterization of Nanocomposite
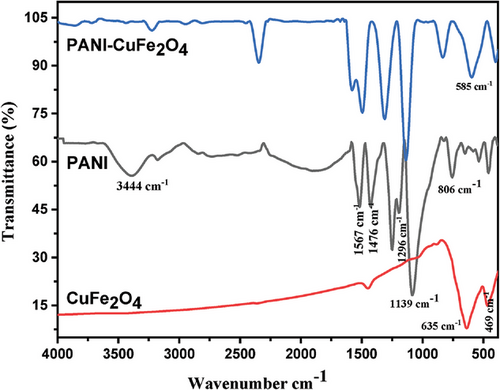
Fourier transform infrared (FTIR) spectra of PANI, CuFe2O4, and PCF composite has been illustrated in Figure 1. The prominent peaks at 469 and 635 cm−1 were attributed to Cu─O and Fe─O intrinsic stretching vibration in octahedral and tetrahedral sites of pure CuFe2O4 in the absence of any organic moiety, ascertaining the structure of CuFe2O4.[8] FTIR spectrum of PANI revealed a peak at 806 cm−1 ratified out of plane deformation of C─H bond in benzene ring, and the peak at 1139 cm−1 was assigned to electronic like absorption of N═Q═N (where Q denotes the quinoid ring). In addition, the signal at 1296 cm−1 was ascertained the presence of stretching vibration of C─N in the benzenoid ring, whilst two consecutive peaks having equal intensity at 1476 and 1567cm−1 corresponded to the C─C stretching of the benzenoid and quinoid rings, respectively. The additional peak at 3215 cm−1 represented the protonated form amine segment in PANI (C─N stretching of the benzenoid ring), and a broad band at 3444 cm−1 was assigned to the free N─H stretching vibration mode.[18-20] Similar characteristic peaks of PANI and CuFe2O4 at higher frequencies remarked the interaction with CuFe2O4 moiety. Additionally, blue shift of signal in the range of 806–835, 1296–1306, and 1476–1493 cm−1 for bending vibration of C─H in benzenoid, stretching vibration of C─N in the benzenoid ring certainly confirmed nanocomposite formation.[21, 22]
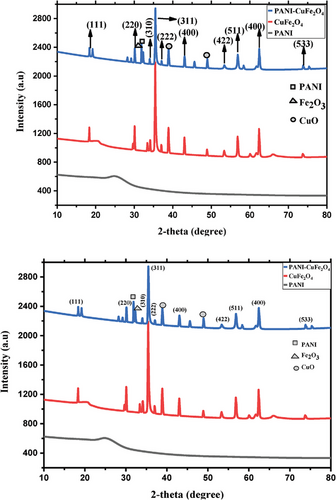
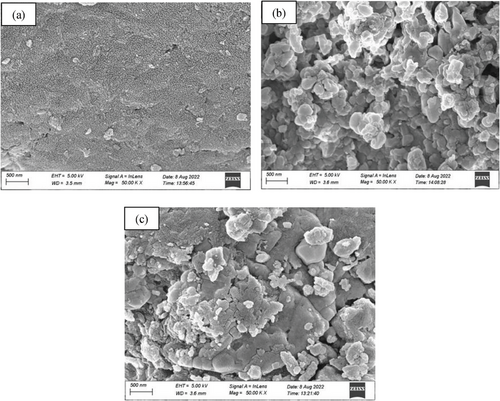
Field emission scanning electron microscopy (FE-SEM) was conducted to carefully investigate the surface morphology and size of the nanocomposite. FE-SEM image (Figure 3) depicts the surface structure of PANI, CuFe2O4, and PCF. The image (Figure 3a) shows that the particles are almost sponge in size for PANI, but the surface image (Figure 3b) of pure CuFe2O4 exhibited the particles are in highly agglomerated form on the surface. However, we predicted the particle size in the range of 46 to 53 nm with well dispersed of CuFe2O4 on the surface of PANI (Figure 3c).
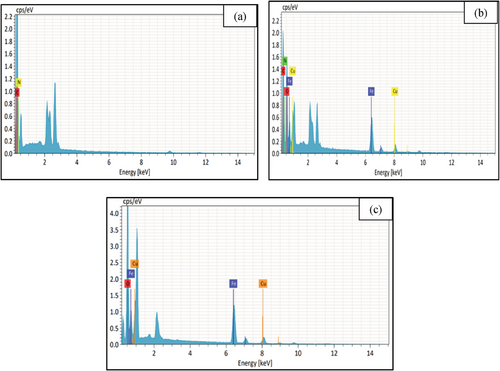
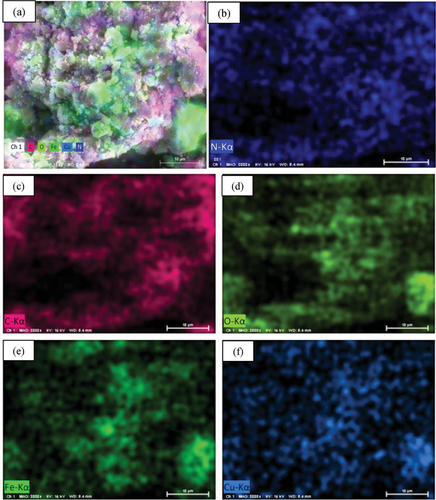
Elemental composition of nanocomposite was estimated using energy-dispersive X-ray (EDX) spectroscopy. The EDX spectrum has been shown in Figure 4. The presence of C (59.83%) and N (40.17%) is the indication of proper synthesis of PANI (Figure 4a), and Cu (15.72%), Fe (41.15%), and O (43.12%) confirmed the synthesis of CuFe2O4 NPs (Figure 4b). The combined signal of C (35.96%), N (11.09%), Cu (27.24%), Fe (16.83%), and O (8.88%) present in Figure 4b ratify the successful formation of nanocomposite. Apart from this, EDX color mapping (Figure 5) also assigns C, N, Cu, Fe, and O element that supports elemental compositions as well as the formation of the nanocomposite.
Oxidation state of the elements present in the catalysts was investigated by the X-ray photoelectron spectroscopy (XPS) analysis, and the survey spectra for carbon, nitrogen, oxygen, and copper in CuFeO4, PANI, and PCF are shown in Figure 6. In the PCF nanocomposite, the deconvolution of the spectrum of C1s revealed five peaks at 284.8, 285.5, 286.5, 287.7, and 289.0 eV for C─C, C─N, C─O, C─O, and O─C═O respectively.[30] The N1s spectra resolved into two peaks 399.8 and 401.5 eV due to the quinone diimine nitrogen and protonated nitrogen as the acid doping-induced N+ and proton interaction respectively.[31] The Cu2p spectra can be deconvoluted into one peak at 934.8 eV, which might be the result of Cu(0) and Cu(II), respectively, indicating the presence of copper oxide on the Cu surface and the other two peaks are the satellite peaks at 938.0 and 943.4 eV.[32] The O1s spectrum shows five peaks at 530.2, 531.7, 532.1, 533.0, and 534.9 eV M─O bond/lattice oxygen, surface adsorbed oxygen/oxygen defect sites, C═O, O*NO2, and ONO*2.[33] Fe2p spectra represent one major peak at 711.5 eV attributed to 2p3/2 for Fe(II) ion.[7]

The magnetic behavior of composite material using vibrating sample magnetometry (VSM) and Figure 7 show the results of CuFe2O4 and PCF. The saturation magnetization (Ms) of the nanocomposite was found to be 41.85 emu g−1, while the low values of Mr (5.79) and Hc (0.79), indicate the super magnetic nature of the composite material. The superparamagnetic materials do not keep their magnetization before or after the removal of the magnetic field, resulting in the prevention of particle aggregation that is significant in photocatalysis owing to available active sites.[34] The results expressed that the saturation mass magnetization of the nanocomposite is lower in comparison to naked CuFe2O4 owing to the annexation of non-magnetic material (PANI) with CuFe2O4, resulting in the change of magnetization because of the quenching of the surface moment.[22] The saturation mass magnetization (Ms), remanent mass magnetization (Mr), and coercivity (Hc) of CuFe2O4 and PCF have been enlisted in Table 1.
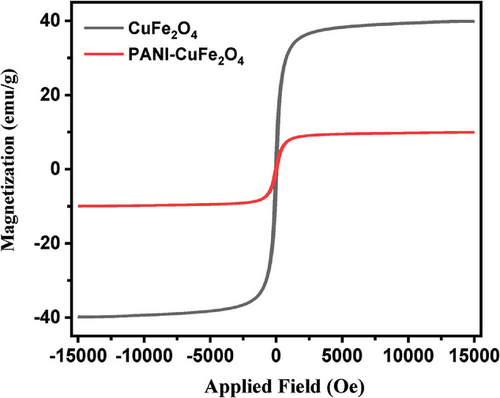
| Sample | Ms | Mr | Hc |
|---|---|---|---|
| CuFe2O4 | 41.85 | 5.79 | 0.79 |
| PCF | 10.47 | 1.27 | 0.29 |
2.2 Photocatalytic Degradation of MB Dye
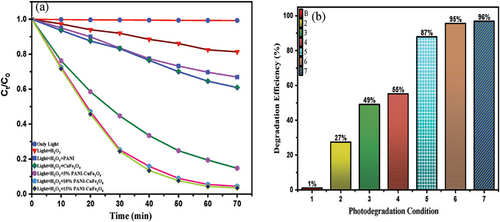
The maximum efficiency of the photocatalyst was investigated considering several conditions, including only light, (light + H2O2), and light + H2O2 + (5%, 10%, and 15%) PCF photo catalyst illustrated in Figure 8. It was notable that a minimal percentage (1%) of dye was degraded in the presence of only light and was uplifted to 27% in the presence of H2O2. The photocatalyst impacted the reaction, and with the increasing percentage of catalyst (5% to 15%) along with Light + H2O2, the efficiency was sharply accelerated to 87% to 96%, owing to the synergistic effect arising from the coupling of PANI and CuFe2O4 in the nanocomposite.[8] On the contrary, the effect of PANI and CuFe2O4 along with Light + H2O2 expressed just 49% and 55%, respectively (Table 2).
| MB dye removal condition | Equilibrium time [min] | Removal [%] |
|---|---|---|
| Only light | 110 | 1 |
| Light + H2O2 | 180 | 27 |
| Light + H2O2 + PANI | 170 | 49 |
| Light + H2O2 + CuFe2O4 | 150 | 55 |
| Light + H2O2 + 5% PCF | 90 | 87 |
| Light + H2O2 + 10% PCF | 75 | 95 |
| Light + H2O2 + 15% PCF | 75 | 96 |
2.2.1 Effect of Irradiation Time
The effect of irradiation time on photodegradation of MB dye was investigated under optimized condition, including PANI, CuFe2O4, as well as 5, 10, and 15% PCF nanocomposite under similar conditions (Figure 9). The progress of the photocatalytic process was monitored by Ultraviolet-visible (UV-Vis) spectroscopy. The degradation reaction was well studied and revealed that composite material attained equilibrium within 70 min with a maximum percentage of degradation to be 95%, compared to individual materials such as PANI and CuFe2O4 that only contributed 33% and 39%, respectively.

2.2.2 Effect of Initial Dye Concentration
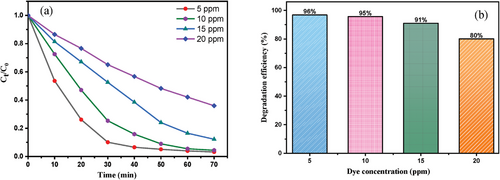
The effect of the initial dye concentration on the photocatalysis reaction was carried out by varying the concentration from 5 to 20 ppm under optimum condition (Figure 10). The maximum performance of the photocatalyst attained up to 96% within 70 min at low concentration (5 ppm). In addition, the percentage surprisingly diminished to 80% at 20 ppm dye solution in 115 min. The efficacy of catalyst with increasing concentration significantly lowered owing to intermediates formation that considerably reduced the number of photons and hydroxyl radicals on the photocatalyst surface.[35, 36]
2.2.3 Effect of Photocatalytic Dose
The efficiency of photocatalyst to degrade MB was carefully investigated considering the different amounts of catalyst (1 to 7 mg) at a fixed concentration. Figure 11b expressed an escalated percentage of dye degradation from 70% to 96% by increasing the amount from 1 to 7 mg owing to the generation of more •OH radicals. However, the percentage lessened to 84% in presence of 11 mg of catalyst due to unavailability of active sites on the catalyst surface.[37, 38] Besides, excessive amounts of photocatalyst enhance the opacity of the suspension as well as impede the passage of visible light into the suspension that decreasing the activity of the photodegradation rate.[39]

2.3 Kinetic Study
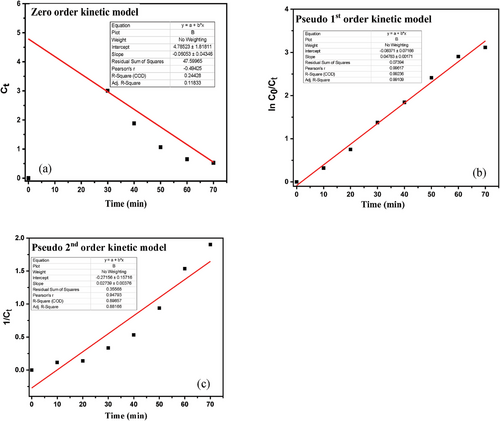
The kinetic study of photocatalytic degradation of MB is an important measurement that suggests the efficiency of photocatalyst. In the present study, three kinetic models, including zero order, pseudo-first-order kinetic and pseudo-second-order kinetic were utilized to evaluate the performance of the photocatalyst shown in Table 3. The given graphical (Figure 12) representation of ln (C0/Ct) with time (t) elicits the straight line with the highest R2 value (0.99081), suggesting of good fit for Pseudo-first-order, and the rate constant, k, was found to be 0.04784 min−1.
| Kinetic model | Equation | R2 value | Rate constant (k) | |
|---|---|---|---|---|
| Zero order | C0 = Ct − k0t | 0.24 | 0.06053 mol L−1 min−1 | [37] |
| Pseudo-first- order | 0.99 | 0.04783 min−1 | ||
| Pseudo-second-order | 0.88 | 0.02739 M−1 min−1 |
2.4 Proposed Mechanism of Photocatalytic Degradation of MB
The possible mechanism of photocatalytic degradation of MB has been highlighted in Figure 13. In this present study, the degradation efficiency of the PCF nanocomposite might be increased due to the significant decrease in charge transfer resistance in the composite compared to the naked CuFe2O4. Since the photogenerated electrons from the conduction band (CB) of CuFe2O4 nanoparticles can transfer easily to the CB of PANI, which has superior electrical conductivity, effectively preventing a direct recombination of electrons and holes leading to enhancement in the MB dye degradation. Furthermore, the enhanced activity of the composite is attributed to the synergistic effects of the heterostructures, efficient visible light utilization, and improved stability. In photocatalytic dye degradation experiments, visible light irradiation generates electrons in the CB and holes in the valence band (VB). In this study, CuFe2O4 absorbs light more efficiently than PANI under visible light irradiation due to its lower bandgap, generating more charges in the VB and CB. Also, the VB of CuFe2O4 has a lower positive potential, and the CB has a higher negative potential compared to PANI.[40] Therefore, electrons in the CB of CuFe2O4 transfer to the CB of PANI, while holes from PANI migrate to the VB of CuFe2O4. The photogenerated electron-hole pairs move to active sites at the semiconductor/liquid interface, reacting with adsorbed species. These photogenerated holes and electrons act as strong oxidizing and reducing agents, triggering subsequent oxidative and reductive reactions. The electrons injected into the CB of PANI reduce adsorbed oxygen to form reactive superoxide anions (O2−˙), which further generates hydroxyl radical (OH˙). Meanwhile, holes in the VB of PANI and CuFe2O4 oxidize organic species or form active OH˙ by decomposing water or reacting with hydroxyl ions (OH−). OH˙, a powerful oxidant and O2−˙ break down MB dye into CO2, H2O, and other stable byproducts.[10, 41]
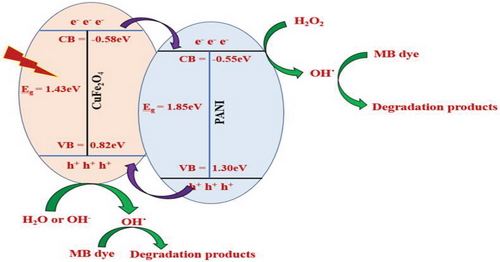
Moreover, in this study, hydrogen peroxide (H2O2) created a Fenton-like catalyst system, enhancing MB dye degradation by forming OH˙ and HO2˙. The ferrocenyl group reacts with H2O2, generating ferrocenium cation and OH˙, which are regenerated by electron transfer from H2O2, producing HO2˙. The self-redox properties of copper and iron in CuFe2O4, induced by H2O2, further facilitate OH˙ generation. Both OH˙ and HO2˙ are key oxidative species responsible for MB degradation.[42, 43]
2.5 Recyclability
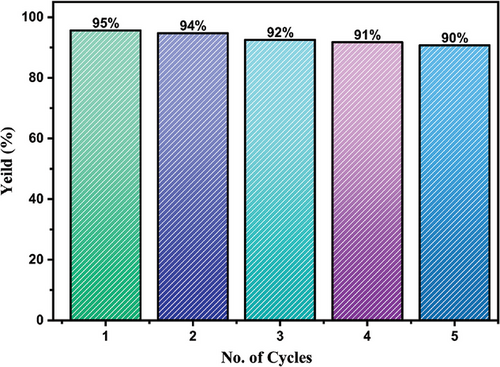
Recyclability is an important parameter for evaluating the performance of photocatalysts (Figure 14). The recyclability experiment was conducted for five consecutive cycles, and the degradation performance varied from 95% to 90%, resulting the decrease of gradual performance owing to the clogging of active sites on the photocatalyst that impeded the effective combination of dye molecules on the catalyst surface.[67] Nevertheless, it might be certainly inferred that the stability and reusability of synthesized nanocomposite in this study is comparable with reported works as shown in Table 4.
| Catalyst | Dye concentration (ppm) | Catalyst dose (mg) | Irradiation source | Degradation (%) | Irradiation time (min) | Refs. |
|---|---|---|---|---|---|---|
| PANI/NiFe2O4 | 30 | 400 | Visible light | 88 | 120 | [11] |
| Chitosan -grafted-PANI/Co3O4 | 10 | 15 | UV lamp | 88 | 180 | [14] |
| PANI/Bi2SnTiO7 | 8 | 30 | Visible light | 100 | 220 | [45] |
| PANI/g-C3N4 | 10 | 100 | Visible light | 92 | 120 | [17] |
| PANI/g-C3N4 | 8 | 250 | Visible light | 90–98 | 40 | [46] |
| PANI/Ceria | 10 | 30 | Visible light | 56 | 150 | [47] |
| PANI/NiO | 10 | 100 | Visible light | 76 | 300 | [48] |
| PANI/ZnO | 3.2 | 1 | UV light and sunlight | 79 (UV), 97 (sunlight) | 300 | [49] |
| PANI/ZnO | 50 | – | Visible light | 58.9 | 120 | [50] |
| PANI/CdO | 4.8 | 20 | UV light, sunlight | 92 (UV), 98 (sunlight) | 240 | [26] |
| PANI/TiO2 | 10 | 50 | Visible light | 81 | 120 | [51] |
| PANI/TiO2 | 63.8 | 100 | Visible light | 77 | 120 | [52] |
| PANI/SrTiO3 | 10 | 30 | Visible light | 97 | 90 | [53] |
| PANI/Bi2O3 | 5 | 100 | Visible light | 96 | 150 | [54] |
| PANI/BiVO4/GO | 3.2 | 100 | Visible light | 73 | 180 | [55] |
| PANI/BiVO4/GO | – | 100 | Visible light | 73 | 120 | [56] |
| PANI/WO3 | 20 | 16.4 | Visible light | 88 | 180 | [57] |
| WS2/PANI | 10 | 20 | UV light | 99 | 90 | [58] |
| PPy/g-C3N4 | 10 | 50 | Visible light | 99 | 120 | [59] |
| PEG/TiO2 | 20 | 3000 | UV light | 100 | 240 | [60] |
| PCTFE/TiO2 | 10 | – | UV light | 100 | 270 | [61] |
| PPy/ZnO | 50 | 50 | UV light | 98 | 20 | [62] |
| PVA/g-PAM/ZnO/SiO2 | 5 | 100 | UV light | 86 | 960 | [63] |
| PUF/rGO/ZnO | – | – | Visible light | 100 | 180 | [64] |
| PMMA/ZnO | 4.8 | 100 | UV light | 60 | 240 | [65] |
| Cellulose acetate/ZnO | 50 | 10 | UV light, sunlight | 30 (UV), 75 (sunlight) | 120 | [66] |
| PANI/CuFe2O4 | 10 | 5 | Visible light | 96 | 75 | This study |
2.6 Phytotoxicity Assay
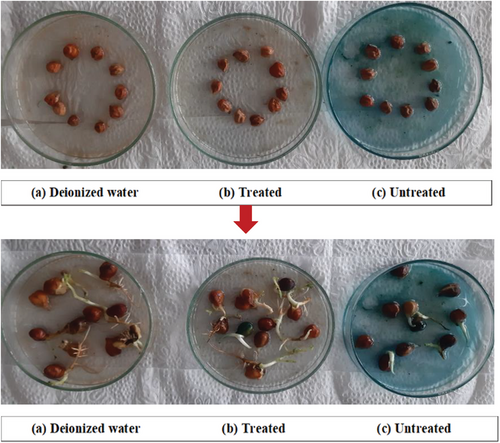
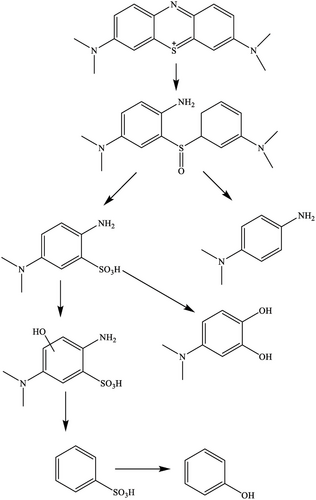
Photocatalytic degradation of organic compounds such as dyes converts into hazardous intermediates or by products that exert adverse impacts on biota. To ascertain the toxicity of MB dye and associated compounds, bioassay approach was conducted considering untreated dye solution, treated dye solution, and deionized water (Figure 15).[68] However, the notable percentage of germination was found to be 90% by deionized water, but the germination rate was significantly reduced to 40% in the presence of untreated dye water, along with shorter root and shoot lengths (Table 5). In addition, the treated dye water ameliorated the germination percentage up to 80%, suggesting the nanocomposite degraded MB dye into less toxic components supported by the previous study as depicted in Figure 16.
| Parameters | Germination [%] | Root length [cm] | Shoot length [cm] | Germination index [%] |
|---|---|---|---|---|
| Control water | 90 | 2.04 ± 1.11 | 2.21 ± 1.46 | 100 |
| Treated dye solution | 80 | 1.88 ± 0.88 | 2.06 ± 1.12 | 81.92 |
| Untreated dye solution | 40 | 0.18 ± 0.02 | 1.33 ± 0.86 | 3.92 |
3 Conclusion
Heterostructure semiconductor type photocatalysis has emerged as a highly promising avenue for the degradation of organic dyes. In this context, light responsive photocatalysts, PANI-CuFe2O4, have successfully been synthesized by sol–gel method. An array of analytical techniques was employed for the characterization of composite material. Of them, FTIR analysis unveiled the presence of M─O, while XRD analysis offered invaluable insights about crystal size of 39.94 nm with crystalline in nature. EDX study has also supported the confirmation of nanocomposite formation. The photocatalytic performance of PANI-CuFe2O4 has been extensively studied under UV light irradiation, in which maximum efficacy attained 96% within a short time span. The significant outcome of the research is the durability and better performance of the catalyst even after several cycles. The kinetic investigation explores the photocatalytic process and proceeds with the supporting of pseudo-second order, exhibiting the highest correlation coefficient value (R2 = 0.99).
4 Experimental Section
Chemicals
All chemicals such as copper (II) nitrate trihydrate, ferric nitrate nonahydrate, sodium hydroxide, aniline, hydrochloric acid, ammonium peroxydisulfate, ethanol, and deionized water were purchased from Merck, India, and all the chemicals were in analytical grade and used without further purification. Double deionized water was used throughout the experiment.
Synthesis of CuFe2O4
The nanocatalyst, CuFe2O4 was prepared using co-precipitation method. Stoichiometric proportion of aqueous solution of copper (II) nitrate trihydrate and ferric nitrate nonahydrate were mixed and kept under ultrasonication for 1 h at room temperature. Following this, NaOH (4M) was added drop wish to reach pH of solution until 12, and stirring continued for 2 h followed by keeping in steady state for overnight. Eventually, brown color precipitate was obtained, and it was successively washed for three times with ethanol and deionized water followed by centrifugation. The resulting CuFe2O4 was desiccated at 100 °C for 8 h and ground homogeneously. The powder was calcinated at 850 °C for 2 h for further investigation.
Synthesis of PANI
PANI was synthesized using chemical oxidative polymerization. Hydrochloric acid (150 mL of 1 m) was taken, and monomer aniline (4.5 mL) was added slowly with continuous stirring keeping in an ice bath. Ammonium peroxydisulfate solution (2g in 50 mL of deionized water) was added to the mixture dropwise with continuous stirring for 2 h. The mixture was allowed for constant stirring for 24 h to complete the polymerization, followed by keeping for 12 h in a steady state. Finally, the green precipitate was isolated from the reaction system that was washed several times with deionized water. After that, the desired substance was dried at 120 °C for 24 h, and was ground for further experiment.
Synthesis of PANI-CuFe2O4
The catalyst, PCF, was synthesized using wet impregnation method. For the preparation of 10% PCF nanocomposite, a fixed amount of (600 mg) CuFe2O4 was immersed in ethanol (50 mL), and it was sonicated for 4 h to dispersed homogeneously in ethanol. A specific amount of PANI (60 mg) was added to CuFe2O4 (600 mg), and the mixture was stirred again at constant stirring for 24 h. The PANI coated CuFe2O4 was dried at 100 °C for 8 h, and was stored in airtight condition after grinding. The same procedure was repeated for the preparation of 5% and 15% nanocomposites by varying the amount of PANI.
Characterizations of Photocatalysts
The synthesized photocatalysts were characterized in several spectroscopic and analytical techniques, including UV–vis spectrophotometer (UV-1900i, SHIMADZU, Japan), Fourier Transform Infrared spectrophotometer (FT-IR) (IRSpirit, SHIMADZU, Japan) using a KBr pellet with a scan rate of ≈4 cm s−1 at 25 °C, scanning electron microscopy (SEM), energy dispersive X-ray spectroscopy (EDX) analysis (SU-8000, Hitachi, Japan) at accelerating voltages of 10 and 15 kV, and X-ray diffraction (XRD) (Rigaku Smart Lab spectrometer, Japan) with Cu-Kα radiation. Thermo gravimetric analysis (TGA) was carried from 25 to 800 °C (Heating rate, 10 °C min−1) under inert atmosphere (N2 gas, Flow rate: 2 mL min−1) using a thermo gravimetric analyzer (TGA-50 SHIMADZU, Japan).
Evaluation of Catalytic Performance
Phytotoxicity Study
Acknowledgements
The authors express their sincere gratitude to “Research and Innovation Center” (Memo No. Khulna University/Research Cell-04/2000), Khulna University for the support provided during the research work. The authors are also grateful to Chemistry Discipline, Khulna University for providing necessary laboratory facilities.
Conflict of Interest
The authors declare no conflict of interest.
Author Contributions
This work was conducted by all authors.
Open Research
Data Availability Statement
The data that support the findings of this study are available from the corresponding author upon reasonable request.


