Holocene landslides in the Fraser Canyon Corridor and implications for ‘ecohazard’ assessment
Funding information: The work was supported by a grant from the British Columbia Salmon Restoration and Innovation Fund (BCSRIF) to Heathfield, Menounos, Larsen, Dingle and Venditti.
Abstract
Landslides are important natural hazards to infrastructure and humans, but they also pose a hazard to the biosphere and constitute an ‘ecohazard’. Recent and prehistoric landslides in southwest British Columbia have significantly impacted local fluvial processes and nearby ecosystems. For example, the 2018 Big Bar landslide caused a major hydraulic barrier in the Fraser River, which impeded upstream salmon migration for 2 years. To better understand the impact of landslides on the biosphere, defined here as ’ecohazard’ impacts, we assessed the distribution, size and character of landslides near the Fraser River over the past 12 to 15 ka. We created a landslide inventory using 2560 km2 of airborne lidar along the Fraser Canyon Corridor, a 375-km stretch of the Fraser River, which flows through varied topography and bedrock. We mapped 274 landslides with planform areas between 2 × 10³ and 2 × 10⁶ m2 and estimated volumes that range from 600 to 1.05 × 10⁸ m3. While the landslides with the largest area were flows/spreads in volcanic rocks, landslides in intrusive and metamorphic rocks had the highest median area. Area–volume relations were consistent across lithology and failure styles. Area–frequency and volume–frequency distributions have a positive skew, in agreement with other landslide inventories. Area–runout relations were also consistent across classifications, meaning the likelihood of a given landslide event reaching the Fraser River is primarily controlled by valley morphology rather than lithology or specific failure mechanics. We propose an ecohazard impact framework to classify the risk posed to salmon migration for the different classes of landslides documented in our inventory. We found that landslides of similar size and character to the Big Bar landslide are relatively common within the Fraser River Corridor; however, their location within the valley will determine how likely they are to significantly impact the ecosystem.
1 INTRODUCTION
On 1 November 2018, a ~84 000 m3 rockfall, hereafter referred to as the Big Bar landslide, partly blocked the Fraser River in British Columbia, Canada. In doing so, it created a new hydraulic barrier to upstream salmon migration. Salmon are born and mature in inland rivers, migrate to the ocean for one or more years, then return to their ancestral spawning grounds through an extremely challenging upstream journey (Groot & Margolis, 1991). Salmon are essential to Indigenous culture in British Columbia (Muckle, 2011), an important economic commercial fishery (Walters et al., 2019), and they deliver marine-derived nutrients to inland terrestrial ecosystems (Reimchen, 2001). Recognition of the potential of the Big Bar landslide blockage to threaten salmon populations in the Fraser River basin triggered the largest and most expensive emergency river restoration project in Canadian history (Draijer, Cotton, & Evans, 2022).
Landslides are the predominant mechanism by which hillslopes in mountain landscapes erode in response to rock uplift and river incision (Burbank et al., 1996; Hovius, Stark, & Allen, 1997; Larsen & Montgomery, 2012); hence, landslides of similar scale to the 2018 Big Bar landslide are commonplace in mountainous environments (Korup, Densmore, & Schlunegger, 2010). Such landslide hazards are typically considered in the context of the risk to human life (Petley, 2012) and economic/social impacts (Kjekstad & Highland, 2009). Landslide hazard assessment in most mountain environments thus focusses on heavily populated areas and transportation corridors (Carter, 2018; Hazzard, 1998; Hungr, Evans, & Hazzard, 1999; Piteau, 1977; Tappenden, 2017), large landslides that are easily recognisable (e.g. Evans & Savigny, 1994; Friele, Blais-Stevens, & Gosse, 2024; Orwin, Clague, & Gerath, 2004; Ryder, Bovis, & Church, 1990), or events that radically alter landscapes (Geertsema et al., 2022; Lavé et al., 2023).
The Big Bar landslide posed little risk to human safety or infrastructure, but the impact of this rockfall on the biosphere and Indigenous culture was significant. Relative to the effects on humans and infrastructure, the ecological impacts of landslides have received less attention (e.g. Geertsema, Highland, & Vaugeouis, 2009), and much of the ecological work on landslides has focussed on terrestrial biodiversity and vegetation succession in landslide-affected areas (e.g. Walker & Shiels, 2012). However, landslides can have substantial impacts on aquatic ecosystems by altering spawning habitat sediment distribution (e.g. Chen, Chu, & Chiu, 2004; Timm & Wissmar, 2014) and have driven changes in population genetics at sites where long-lived landslide dams impede fish migration (e.g. Mackey et al., 2011). Much larger mass movements than the Big Bar landslide have blocked the Fraser River (e.g. Texas Creek Rock avalanche, ~52 × 106 m3, ~2.28 ka; Ryder, Bovis, & Church, 1990; Friele, Blais-Stevens, & Gosse, 2024), which are presumed to have impacted salmon populations (Hayden & Ryder, 1991) and may have impacted Indigenous settlement patterns (Hayden & Mathewes, 2009; Hayden & Ryder, 2003; Kuijt, 2001; Prentiss et al., 2003; Prentiss et al., 2011; Prentiss & Kuijt, 2004). Hence, there is a need to quantify ‘ecohazards’ to rivers. To our knowledge, an inventory of landslides and those features that could threaten salmon migration in southwestern Canada does not exist.
The Big Bar landslide raised awareness that landslides could have devastating impacts on salmon populations and that there is an immediate need to assess the distribution of past landslides to guide assessment of potential future ecohazards. Here, we develop an inventory of landslides along the Fraser River, with a particular eye towards the impact such landslides could have had on salmon migration. While we are focussed on the impact of this landslide on salmon, the methods we develop here for mapping landslides can be used to map ecological hazards to any species. Inventories of mapped landslides are commonly used to document the location, size, characteristics and effect of landslides in an area (Guzzetti et al., 2012; Hovius, Stark, & Allen, 1997; Larsen & Montgomery, 2012; Malamud et al., 2004; Marc et al., 2016). For example, the Big Bar landslide occurred within volcanic rock and can be classified as a rockfall, based on the character of the debris and its release from a subvertical cliff face. Given the large variety of mechanisms and effects encompassed by landslide processes, these inventories are often limited to small geographic areas such as individual river basins (Brardinoni & Church, 2004), specific failure styles (Bunn, Leshchinsky, & Olsen, 2020; Graber & Santi, 2022a; Huang, Ma, & Huang, 2022) or short time windows associated with triggers, such as earthquakes or major hydrologic events (Bhuyan et al., 2023; Li et al., 2016; Massey et al., 2018; Thomas et al., 2023). In this study, we map landslides that occurred along the Fraser River over an ~12 to 15-kyr-long time period. Any prehistoric landslides that impacted the Fraser River since glaciation would have disrupted salmon migration, but the existence of salmon in the modern Fraser River precludes extirpation. We include multiple landslide styles across broad geographic and geologic terranes. Our goal is to place the Big Bar landslide into prehistoric context and understand how its size, location and failure style compare against previous landslides in the region. Armed with this understanding, we aim to assess the hazard posed by future landslides to salmon migration in the Fraser River.
As a first step to assess the ecohazard posed by landslides to salmon migration in the Fraser River, we seek answers to the following questions: (1) What is the distribution of past landslides in the Fraser Canyon Corridor? (2) Does our landslide inventory reflect the distribution of past landslides similar to other inventories? (3) What severity of ecohazard is implied by these past landslides to salmon migration? To answer these questions, we mapped evidence of landslides along the Fraser Canyon Corridor and estimated landslide volume using recently acquired high-resolution lidar data. Our mapping took advantage of a rapid assessment method, which facilitated mapping a large area quickly. The survey area focusses on a 375-km stretch of the Fraser River (27% of its total length) with high hillslope-channel connectivity between Soda Creek and Yale, British Columbia. We categorised the landslides by failure style and lithology to better understand the spatial distribution and magnitude of past landslides across highly variable terrain. We also discuss how landslide and valley geometries interact to influence the risk posed to salmon migration in the Fraser River. We propose this novel method for assessing the potential impacts of landslides on salmon migration as a model for other salmon-bearing streams.
2 BACKGROUND AND METHODS
2.1 Geographic and geologic setting
The Fraser River originates in the Rocky Mountains of British Columbia, Canada (Figure 1a). Near Prince George, the 1375-km long Fraser River becomes dominantly north–south oriented as it flows across the Interior Plateau. Within the Interior Plateau, the Fraser River is predominately cut into bedrock and serves as the boundary separating two broad volcanic plateaus, the Chilcotin Plateau to the west and the Cariboo Plateau to the east (Figure 1). Downstream from the Interior Plateau, the Fraser River becomes flanked by more variable topography, by the western Camelsfoot Range near Gang Ranch and the eastern Marble Range near Big Bar. South of the town of Lillooet, the Fraser River drains the Lillooet Ranges, a subdivision of the largely plutonic Coast Mountains, the Clear Range (north of the Thompson River) and the Canadian Cascades (south of the Thompson River). At the town of Hope, the river becomes alluvial and enters a broad, coastal valley before reaching its outlet at the Pacific Ocean near Vancouver.
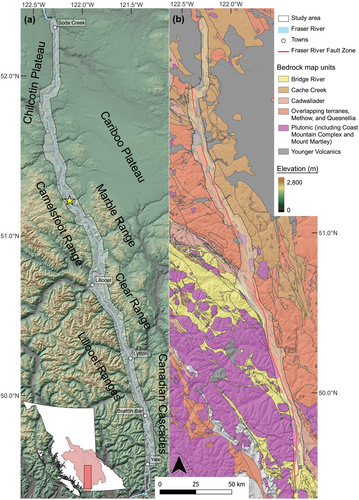
Repeated Quaternary glaciations in the Fraser River basin produced a major U-shaped bedrock valley of variable width that is partially filled by unconsolidated glacial deposits and fluvial sediments deposited shortly after deglaciation (Clague, 1981). The history of the Fraser River during these glaciations and how it has evolved with respect to climate variation, changes in sediment supply and isostatic effects from deglaciation are largely unexplored. The modern Fraser River flows within an inner gorge incised into the broader glacially carved valley that has banks of bedrock, glaciofluvial sediment or colluvium (Rennie, Church, & Venditti, 2018). The glaciofluvial sediments within the valley were planated by the Fraser River following glacial retreat, forming a series of cut terraces. These terraces separate the bedrock walls of the U-shaped valley from the modern Fraser River for significant stretches and allow for relatively easy identification of landslide deposits, as hummocky landslide debris disrupts the otherwise smooth terrace treads. Generally, the glacially carved valley is steepest in the south (downstream), where it is carved through the plutonic Coast Mountain Complex (Figure 1b). The current southerly course of the Fraser River was established roughly 0.76 Ma (Andrews et al., 2012). Ice sheet thinning and the retreat of subsequent valley glaciers up the Fraser River occurred between 15 000 and 12 000 years ago (Clague & James, 2002; Menounos et al., 2017). Erosional and depositional evidence exists for at least one large outburst flood that swept down the Fraser River at ~11 ka BP (Clague et al., 2021).
There are a broad range of rock types in the study area that have the potential to be involved in slope failures, though the region south of Lillooet is relatively homogenous in its granitic composition. Bedrock in the Fraser River valley north of Lillooet is part of the Intermontane Belt, a complex set of geologic terranes comprised of Late Paleozoic to Mesozoic amalgamated volcanic and plutonic arc, marine and nonmarine clastic, metamorphic, and accretionary rocks of the Quesnellia terrane, Cache Creek terrane, Cadwallader Group and Bridge River terrane (moving approximately east to west, Figure 1). This northern area is composed of basalt, chert, argillite, limestone, siltstone, sandstone, various conglomerates/breccias, and other sedimentary and volcanic rocks that have been deformed and weakly metamorphosed by fold-and-thrust fault systems (Nelson et al., 2013). There are also the calc-alkaline volcanic Spences Bridge Group (Thorkelson & Smith, 1989), the extrusive portion of magmatism that occurred from the middle Cretaceous to middle Tertiary that formed the intrusive granitic Coast Plutonic Complex to the west of the modern Fraser River (Monger, Price, & Tempelman-Kluit, 1982). Near Soda Creek, the accretionary and volcanic rocks are overlain by Miocene and Pliocene volcanic rocks with rhyolitic to basaltic composition, the Chilcotin Group (Bevier, 1983). South of Lillooet, the post-accretionary Coast Belt is primarily composed of Cretaceous to Eocene plutonic rock.
Landslides are common throughout southwestern British Columbia (Figure 2). Researchers have documented major prehistoric bedrock landslides throughout the region (Evans & Savigny, 1994; Naumann, 1990; Ryder, Bovis, & Church, 1990; Savigny, 1993; Savigny & Clague, 1992). Earthflows are also prevalent, and there have been multiple periods of earthflow activation and quiescence during the Holocene because of fluctuations in precipitation associated with regional climate variation (Bovis, 1985; Bovis & Jones, 1992). Historically, numerous and varied landslides have been recorded near the study area, from the infamous 47 × 106 m3 Hope Landslide that occurred in 1965 (Mathews & McTaggart, 1978; Von Sacken, 1991) to multiple ~106 m3 translational and slump slides in the 19th century linked to agricultural activity (Clague & Evans, 2003; Tappenden, 2017). Many studies of slope instability in British Columbia consider corridors for critical transportation infrastructure (Carter, 2018; Hazzard, 1998; Hungr, Evans, & Hazzard, 1999; Piteau, 1977; Tappenden, 2017), although other work has explored major landslides in more sparsely populated terrain in British Columbia (e.g. Brardinoni & Church, 2004; Friele & Clague, 2004; Geertsema et al., 2006, 2022; Martin et al., 2002). A regional assessment of all identifiable landslide features that may affect the Fraser River has not been undertaken.

2.2 Lidar acquisition
Topographic maps at 1:20 000 scale (the highest quality continuous coverage of the Fraser River) are not sufficient to resolve landslide scars and deposit that allow attribution of landslide style. Additionally, landslides, such as the size of Big Bar landslides, are rarely resolvable from topographic maps alone. Thus, we collected lidar data for the study site.
Landslide mapping was completed using lidar-derived elevation and ortho imagery data collected by the Hakai-UNBC Airborne Coastal Observatory (ACO). High-resolution lidar data were used as it provided significant coverage of remote, forested areas along the Fraser River while providing sufficient detail of landslide deposits to permit first-order determination of landslide failure styles. The ACO is a fixed-wing aircraft equipped with dedicated 1064-nm lidar (Riegl LMS-Q780), high-resolution cameras (dual PhaseOne 100MP RGB + NIR), and an integrated inertial measurement unit (IMU) and Global Navigation Satellite System (GNSS) (Applanix POS AV).
Between 2018 and 2022, the ACO acquired 2560 km2 of lidar within the study area. We flew aerial surveys at a height of ~1000 m above ground level, achieving an average swath width of 1000 m, with 30–50% overlap of adjacent swaths. These surveys yielded an average point density of 4–8 points m−2. Aerial imaging cameras collected high-resolution colour and infrared photographs at regular intervals with sufficient overlap to generate high-resolution true colour-near infrared (RGB-NIR) imagery (0.15-m ground sampling distance).
All lidar and image data are adjusted for orientation and position via combined IMU and GNSS Inertial Navigation System (INS). Post-processed flight trajectories from repeat ACO surveys over stable terrain yield vertical and horizontal uncertainties within ±0.15 m (Mukherjee et al., 2023). We filtered point clouds for noise, identified ground, binned the ground returns and gridded these data into 1-m bare-earth digital elevation models (DEMs) using nearest-neighbour interpolation. One survey was gridded at 3 m because of low point density in high slope areas. We co-registered, georeferenced and removed distortion from the aerial imagery and subsequently generated four-band Colour-Infrared (CIR) GeoTIFF. These CIR images were later aligned and orthorectified to create image mosaics of the study area.
2.3 Terrace mapping
Terraces were mapped in LSDTopoTools (Clubb et al., 2017), with a 4-km swath width, 9–10° slope threshold, 250–375 m relief threshold and 20 m surface radius. Parameters were selected for each lidar DEM based on the highest relief features observed in the region. All terrace polygons were hand-cleaned to remove channel bottoms, any clear anthropogenic features like houses or roads, or small features like gullies or fans. Landslide deposits were clipped from the dataset. All terraces were compared with Bing Aerial imagery and bedrock geologic maps to check underlying material appearance to remove the flat plains of basalt in the Interior Plateau. In addition, small terraces not identified by LSDTopoTools that were primarily narrow, Fraser mainstem parallel terraces, were hand-mapped based on lidar and aerial imagery. The extent of extracted terraces matched previously recognised terraces near Lillooet identified in Gingerich (2021). Terrace relief was extracted relative to the adjacent mainstem water surface elevation in the lidar data.
2.4 Landslide mapping
We mapped landslide source areas and deposits using a modified version of the Streamlined Landslide Inventory Protocol (SLIP) described in Slaughter et al. (2017). The SLIP method prioritises rapid mapping of landslide boundaries without including significant amounts of attribute data typically assessed for features in a detailed landslide inventory. Using a combination of lidar-derived DEMs, hillshade images, slope maps, multispectral, and satellite imagery, we first mapped individual features suspected to be landslides. We filtered the original data to those scarps and deposits deemed ‘high confidence,’ as described in Slaughter et al. (2017). We then hand-digitised the extent of each geomorphic feature, mapping scarps and deposits separately wherever possible, using 1- to 3-m-resolution lidar-derived data products projected in both 2D and 3D. As landslide sizes varied significantly, we mapped at a variety of scales ranging from 1:4000 to 1:12 000.
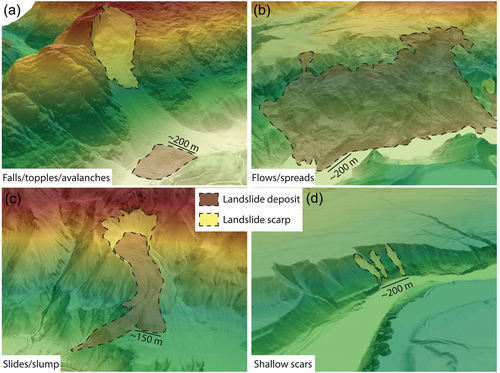
Given the variety of lithologies and valley geometries within the study area, we chose to classify each landslide into four broad ‘failure style’ categories: (1) slides/slumps; (2) flows/spreads; (3) falls/topples/avalanches; and (4) shallow scars (Figure 3) following Cruden and Varnes (1996) and Hungr, Leroueil and Picarelli (2014). We recognise assigning failure styles is challenging from remotely sensed data, each style incorporates multiple distinct failure mechanisms and some landslides underwent several stages of failure with different mechanisms. However, our purpose is a first-order approximation for determining potential ecological effects, and the broad categories are more appropriate than a detailed mechanistic sub-categorisation. Specific failure mechanics could be refined by field assessment of individual landslides. Given the history of glacial scour and subsequent floods, we interpret all landslide deposits within the Fraser River valley to be post-glacial.
Each landslide was also assigned a lithologic unit based on a combination of the British Columbia Digital Geologic map (Cui et al., 2017) and maps of Quaternary fill terraces generated from the lidar following Clubb et al. (2017). Given the large number of lithologies throughout British Columbia, we simplified our geologic characterisation to the broad categories of sedimentary, volcanic and igneous/metamorphic rocks, assuming each category reflects similar rock strength and failure properties. We recognise these broad categories ignore many local characteristics, such as fracture density, bedding and metamorphic grade that can have a significant impact on propensity of failure but believe this first-order estimation is appropriate given a lack of data on rock strength for mapped units in British Columbia. To determine whether a landslide occurred in unconsolidated Quaternary sediment, we combined the Quaternary layers from Cui et al. (2017) with the terrace maps. For landslide features with a defined scarp, we used the pole of inaccessibility (defined as the centre of the largest possible circle that can be inscribed within a polygon; Garcia-Castellanos & Lombardo, 2007) to determine the lithologic unit, assuming the centre of the scarp polygon is likeliest to represent the lithology that failed. For deposit-only features, we used the centroid of the deposit polygon.
Each landslide was assigned a landslide length, defined as the approximate distance between the headscarp and furthest impacted area. Landslide length differs slightly from runout length, as landslide runout is measured from the boundary between the source and depositional zones of the landslide, which is often difficult to identify without surveying individual failures (Taylor et al., 2018). We measured landslide length by fitting a standard deviation (1σ) ellipse to the vertices for each combined scarp and deposit polygon. As mapping occurred at different scales and vertex density skews the ellipse toward areas with higher vertex density, we weighted each vertex by the distance to its nearest neighbour. We used the Directional Distribution tool in ArcGIS Pro 3.2 (Esri, 2024) to create the summary ellipse, which is centred on the mean and has axes defined by the standard deviation of the x-coordinates and y-coordinates. We used the length of the axis of the ellipse with the higher relief as the landslide length. Flows and spreads generally occur over long periods relative to many of the landslides mapped in our inventory. Thus, we note that for flows/spreads, ‘landslide’ length is more of a measure of the overall length of the cumulative area affected by multiple episodes of flow and spread movement, rather than a single landslide event distance. We also calculated the average slope of a 100-m wide buffer around each landslide to determine whether landslide length and surrounding hillslope steepness are correlated. Landslide length and area were used to calculate the Runout Number (L/A1/2), a dimensionless number of landslide elongation calculated by dividing the landslide length by the square root of the landslide area (Wallace & Santi, 2021). The Runout Number correlates with planimetric curvature and landslide composition, although its use as a predictive tool is uncertain. Following Wallace and Santi (2021), we exclude the falls/topples/avalanches category as the runout behaviour of rock-dominated landslides may be controlled by different physical processes than those in fine-grained earth or debris.
2.5 Volume estimates
While mapped planform area is easily compared against existing landslide inventories, the ability to impede salmon migration is much more accurately represented by to the total volume of landslide material relative to the accommodation space in the active channel. Given this, we estimated the volume for each mapped landslide using a combination of methods for estimating pre-landslide topography. For each landslide feature, we used a modified version of Alberti et al. (2022) to estimate a slip surface and pre-landslide topography. Depending on the type of landslide feature, we used these surfaces to obtain a first-order estimate of landslide volume. All landslide volume calculations were performed on the gap-filled, lidar-derived-DEM resampled to 3-m resolution. We estimated the slip surface from a thin-plate spline fit to elevations at each vertex of a polygon consisting of the outline of the scarp/flanks, the deposit, and the points defining the interface between these two surfaces (Figure 4). The thin plate spline method requires the fit surface to pass through each vertex; thus, this method only works for landslides where a scarp/flank is present to ensure the estimated slip surface is concave-up.
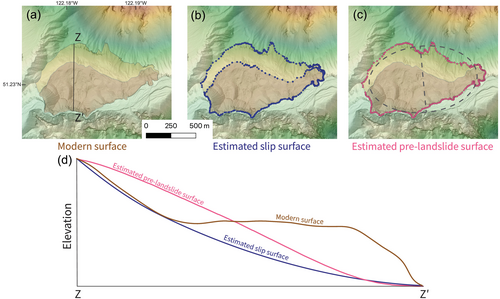
The pre-landslide topography is estimated using inpainting techniques originally developed for inpainting imagery and commonly applied to geomorphic analyses (Crema et al., 2020). The methods uses the boundary conditions at the edge of the polygon and partial differential equations fit to the surrounding landscape. When applied to topography, these techniques have shown a strong ability to fill in gaps in topographic data while preserving morphometric attributes, including curvature, roughness and realistic fluid flow paths (Crema et al., 2020). The pre-landslide topography was generated for all mapped landslides as it reliably predicts a higher topographic surface where mass loss occurred (e.g. near the head scarp) and a lower topographic surface where landslide deposition occurred.
Given these algorithms estimate different surfaces relative to the pre-landslide landscapes, we established different ways of estimating volume for the different feature types. For landslides with both a scarp and deposit (excluding falls/topples/avalanches), the landslide volume is the sum of the product of pixel area and the positive elevation difference between the pre-landslide inpainted surface and the thin plate spline slip surface (VInpaint-Spline). This method most closely follows Alberti et al. (2022), was the most common method we used and is likely the most accurate. For deposit-only landslide features, we cannot estimate the slip surface as there is no scarp to ensure the spline surface is concave up. Instead, we use the thin-plate spline as an estimate of the pre-landslide surface where deposition occurred. The landslide volume is then the sum of the product of pixel area and the positive elevation difference between the modern deposit surface and the spline surface (VModern-Spline). For landslides with vertical to subvertical cliffs that form the scarps/flanks, the slip surface thin-plate spline algorithm failed to create a reasonable surface, primarily for features classified as falls/topples/avalanches. For these landslide features, volume is the sum of the product of pixel area and the positive elevation difference between the inpainted surface and the modern elevation surface (VInpaint-Modern).
2.6 Statistical distribution fitting
There are two distributions typically used to describe the statistical relation between landslide size (expressed as landslide area) and frequency: a double Pareto distribution (Stark & Hovius, 2001) and an inverse gamma distribution (Malamud et al., 2004; Stark & Hovius, 2001). We used the total polygon planform area of the scarp/flank and deposit polygons (where both are present) to determine the statistical distributions. We fit the double Pareto and inverse gamma functions to log-binned area data, with 24 evenly log-spaced bins, using nonlinear least squares fitting.
3 RESULTS AND INTERPRETATION
3.1 Landslide distribution and area
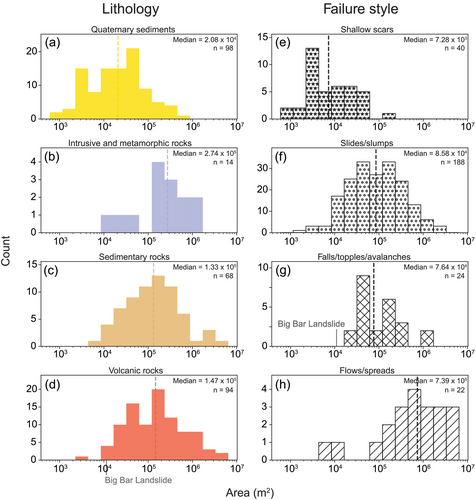
We mapped 274 landslides that range in area from ~103 to 106 m2 (Figure 5). Landslides originating in intrusive/metamorphic rocks have the largest median area (2.74 × 10⁵ m2) (Figure 5b). The median landslide area for sedimentary and volcanic rocks are both slightly smaller (medians: 1.33 × 10⁵ and 1.47 × 10⁵ m2, respectively) (Figure 5c, d). Landslides in Quaternary sediments have the smallest areas (median: 2.08 × 10⁴ m2, Figure 5a). Flows/spreads are the largest landslides by nearly an order of magnitude (median: 7.39 × 10⁵ m2) compared to falls/topples/avalanches and slides/slumps (medians: 7.64 × 10⁴ and 8.58 × 10⁴ m2, respectively) (Figure 5f–h). Shallow scars are the smallest features mapped in the study area (median: 7.28 × 10³ m2) (Figure 5e).
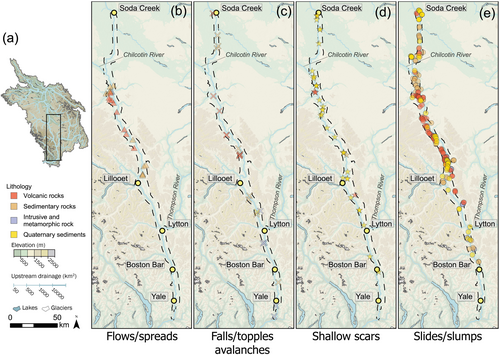
Landslides are larger, more numerous and have greater total area in the northern portion of the Fraser Canyon Corridor upstream of Lillooet than in the southern Fraser Canyon. Flows/spreads primarily occur between the Chilcotin–Fraser Rivers confluence and Lillooet (Figure 6). The area with mapped flows/spreads broadly coincides with the presence of volcanic and volcaniclastic rocks of the Cache Creek and Quesnellia terranes. Falls/topples/avalanches are found throughout the study area, although those in the north are typically associated with the collapse of Chilcotin Group basalt cliffs where the basalt flows cap accretionary rocks, whereas those in the south are typically associated with glacially steepened walls of the plutonic Coast Mountain Complex. Shallow landslide scars are found throughout Fraser Canyon Corridor and primarily coincide with Quaternary glaciofluvial deposits, which variably fill the valley bottom along the entire study area. Slides/slumps are distributed throughout the field area but are most prevalent north of Lillooet (Figure 6e).
The observation that igneous and metamorphic lithologies produce the largest landslides is consistent with previous work showing rock strength exerts a first-order control on landslide size distributions (Jeandet et al., 2019). The largest individual landslides in the inventory, however, were triggered in sedimentary and volcanic rocks that produce earthflow complexes, which are slow, long-lived landslides that are active in different areas of their overall footprint through time, with individual lobes surging or becoming quiescent depending on hydrologic conditions (Bovis & Jones, 1992). The smallest landslides in Quaternary sediments occur in less competent unconsolidated strata that occupy the lower portion of the valley, consistent with previous observations showing landslide size distributions are influenced by the strength of the underlying material (Medwedeff et al., 2020).
3.2 Landslide area–volume scaling
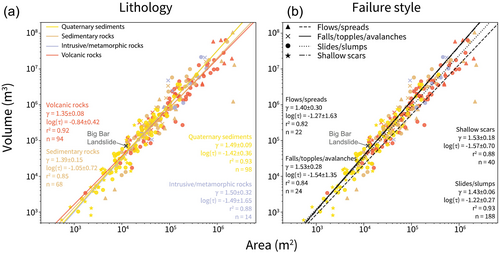
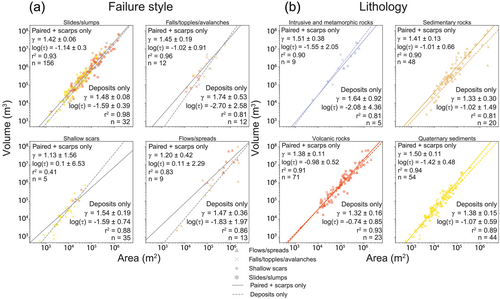
Area–volume relations derived from the fit surfaces to landslides demonstrate little difference among landslides categorised by lithology or failure style (Figure 7). Best-fit γ for the lithologic categories ranges from 1.35 to 1.50, although the relative lack of landslides initiating in igneous/metamorphic rocks results in a large error (Figure 7a). Values of γ for each failure style range from 1.40 to 1.53, although errors on these estimates are generally higher as there is more uneven distribution of landslide area–volume relations within failure categories compared to lithology (Figure 7b).
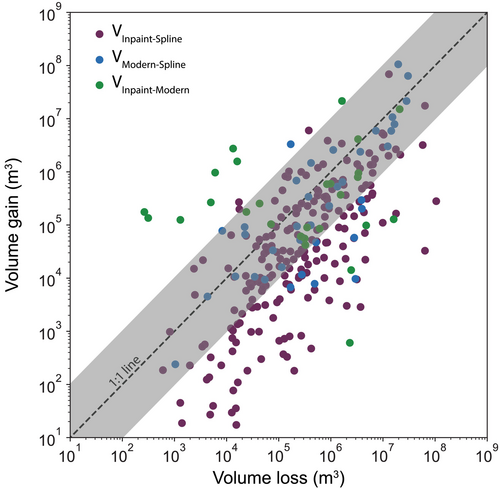
The reliability of our estimated volumes is ultimately dependent on the preservation of the deposit and landslide scar. Older landslide features tend to diffuse and may be eroded by rivers (LaHusen et al., 2016), losing mass through time, which can cause error in estimated area–volume relations. The pixels within a given landslide with an estimated volume loss (typically the scarps and flanks) and those within an estimated volume gain (typically the landslide deposits) compare favourably with 58% of the landslide volume loss and gain within an order of magnitude of the 1:1 line, but total volume loss for a given landslide is typically greater than total volume gain (Figure 8). The higher volume loss than gain is not surprising, given that our landslide inventory is adjacent to tributaries of the Fraser River, where landslide deposits are eroded. The difference between volume loss and gain raises the question of whether our derived area–volume relations are biased by mixing deposit-only landslides with those that have scarps. The area–volume scaling relations are similar between landslides that were deposit only and those that had a mappable scarp. The area–volume scaling exponent agrees within error for all data categories regardless of using paired scarp-deposit features or deposit-only features (Figure 9), although the deposit-only features typically have slightly lower volumes. Nevertheless, scaling exponents for all lithologies and failure styles are similar. The similarity of the relations derived with and without deposit-only landslides suggests that volumes calculated in the inventory are robust, and the core results are not affected by mass loss in the deposits over time.
3.3 Area and volume frequency distributions and scaling relations
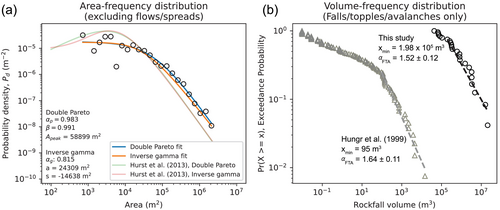
A common observation in landslide inventories is an inverse relation between landslide area and observation frequency for landslides with moderate to large areas and a rollover for small landslides where observation frequency deviates from an inverse function, resulting in a relatively even frequency for landslides below a given area. The area distribution of landslides (excluding flows/spreads) in the Fraser Canyon Corridor exhibit the inverse relation and rollover at ~2 × 10⁴ m2 in this study. The rollover between small landslides and medium/large landslides is often attributed to resolution effects for triggered-event landslide inventories, but topographic and material strength properties also influence landslide size distributions (Bellugi et al., 2021; Frattini & Crosta, 2013; Medwedeff et al., 2020; Milledge et al., 2014). Over the 12 to 15-kyr timescale, lower observed frequency of smaller landslides may also be because of landscape annealing by soil diffusion, colonisation by vegetation or erosion, which removes or redistributes landslide debris and diffuses scarp material (Glenn et al., 2006). These processes more quickly remove the evidence of small landslides relative to larger ones, biasing the distribution at small areas.
As many landslide inventories are event-specific or document landslides shortly after their occurrence, metrics of landslide size distributions do not reflect preservation biases. We compared the distribution of landslide sizes in our inventory to similar prehistoric landslide inventories. We found the area-frequency distribution is comparable to a landslide inventory assumed to represent the past ~27 kyr in the United Kingdom (UK) (Hurst et al., 2013), particularly for medium to large landslides. The exponents controlling the rate of decay for medium-to-large landslides ( and for double Pareto and inverse gamma, respectively) from our inventory are slightly lower than for the UK inventory (this study: = 0.983, = 0.815; Hurst et al., 2013: = 1.01, = 0.95), resulting in a slightly less steep negative limb in log space. Larsen & Montgomery (2012) applied the inverse gamma function to a pre-1974 landslide inventory from the eastern Himalayas and found = 1.27, implying an even steeper drop-off in the frequency of larger landslides. The lower value of and for our inventory implies that we captured a higher number of large landslides than in these other inventories, which could imply differences in landslide processes in different geologic settings or could relate to specific geologic properties in the Fraser River Corridor. For small landslides in this inventory, there is a pronounced rollover effect than was observed in the UK landslide inventory (this study: β = 0.991, s = −14 638; Hurst et al., 2013: β = 1.71, s = −1910). The glacial history of the Fraser Valley limits the time for erosion/redistribution of landslides we catalogued to <15 ka; hence, it may be that the stronger bias against small landslides observed in the UK dataset is the result of more landscape annealing, given the longer timescale. Another potential explanation for a less pronounced rollover effect is the challenge of mapping small landslides. For example, the UK inventory is based on landslides from existing 1:10 000 scale maps by Foster et al. (2012), making bias more likely than when mapping from high-resolution lidar data where a more complete inventory of small landslides can be compiled. Additionally, root cohesion can play an important role in slope stability in terrain prone to shallow landslides (Guns & Vanacher, 2014; Schmidt et al., 2001). Given shallow landslides have the smallest median size, differences in vegetation between our study area and other inventories could account for variation in the number of small, shallow landslides.
Volume-frequency cumulative distributions for rockfalls (falls/topples/avalanches) are similar to previous inventories for these types of events in the Fraser Canyon Corridor. Hungr, Evans and Hazzard (1999) examined rockfalls along the Fraser Canyon transportation infrastructure using 22 years of data collected by the Canadian Pacific Railway and found that rockfall volumes ranged from <0.1 to 2 × 10³ m3. Attempts to combine our rockfall dataset with that of Hungr, Evans and Hazzard (1999) failed because of the lack of overlap in landslide size between the studies; the present inventory captures post-glacial rockfall events with volumes from 4.3 × 10⁴ to 2.1 × 10⁷ m3, events nearly two orders of magnitude larger. The two sets of observations are sampled from different populations, making the MLE approach impossible on a combined dataset. Nevertheless, the estimated parameters for the volume-frequency slope for falls/topples/avalanches yield similar values: = 1.52 ± 0.12 for the present inventory and an = 1.64 ± 0.11 for the transport corridor inventory (Graber & Santi, 2022b; Hungr, Evans, & Hazzard, 1999) (Figure 10b).
3.4 Landslide length and Runout Number
The ability of a landslide to impact salmon migration depends on the topographic controls on runout length and the connectivity between valley wall failure areas and the Fraser River. As the Fraser River Corridor is composed of a large U-shaped bedrock valley containing variably preserved glaciofluvial terraces, the distribution and width of those terraces influences the likelihood a given landslide will travel far enough to reach the river. Landslides originating in intrusive/metamorphic rock have the longest median landslide length and highest surrounding slope (884 m and 28°), sedimentary and volcanic rocks have similar, shorter landslide lengths and lower surrounding slopes (565 m and 23°, 572 m and 22°, respectively). Landslides in Quaternary sediments have the shortest length but a similar surrounding slope to landslides in sedimentary and volcanic rock (193 m and 23°, Figure 11a). Flows/spreads had the longest median landslide length and lowest surrounding slopes (1332 m and 20°); falls/topples/avalanches and slides/slumps have moderate landslide lengths and moderate surrounding slopes (344 m and 24°, 390 m and 22°, respectively), and shallow scars have the shortest length and highest surrounding slopes (118 m and 25°, Figure 11b). Landslide L/A1/2, the measure of landslide elongation (Wallace & Santi, 2021), is relatively similar across landslide categories (Figure 11). Similar to landslide length, L/A1/2 is the highest for intrusive/metamorphic rocks (1.67), lowest for Quaternary sediments (1.37), and sedimentary and volcanic rocks are similar and in the middle (1.51 and 1.55, respectively).
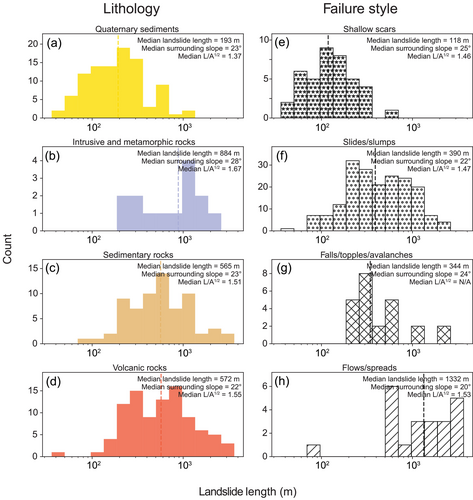
For landslides in igneous and metamorphic rocks, the relatively high landslide length and L/A1/2 are likely related to the higher rock strength that allows for steeper slopes and higher relief before failure, which is supported by igneous and metamorphic rocks landslides having the steepest average surrounding slopes. When a failure occurs within competent igneous and metamorphic lithologies, increased fall height can result in a longer runout (Devoli et al., 2009). For flows/spreads, landslide length is primarily a result of the total distance over which landslide processes have expanded through time, resulting in the larger measured landslide length. However, the difference in process and timescale for flows and spreads compared to the other categories of failure style makes the landslide length metric less comparable to values from other landslide types, as noted in Section 2.4. The L/A1/2 values suggests that for a given valley geometry and landslide area, locations with intrusive/metamorphic bedrock may be slightly more likely to experience landslides that originate in the valley wall and impact the Fraser River, as they have the highest value of elongation. Given the combination of highest L/A1/2, longest median length and largest median area, intrusive/metamorphic rocks have a slightly higher likelihood of crossing cut terraces and impacting the Fraser River. However, the overlap between almost all landslide categories in terms of length and L/A1/2 suggests that lithology and failure style are not strongly predictive of impact to the Fraser River.
4 DISCUSSION
4.1 Landslides and ecohazards in the Fraser Canyon Corridor
Our landslide inventory highlights that there is a large degree of overlap in landslide size across lithologies and landslide styles; hence, there is likely not a specific rock type or failure style that poses the greatest risk to salmon migration. Instead, our findings suggest that valley morphology is important for determining whether a landslide becomes a river-impacting event, simply because if the valley morphology can accommodate the runout and deposit before it reaches the river, there is no impact on salmon migration regardless of lithology or failure style. Future work assessing valley geometry, terrace preservation and extent, and the Fraser River's position within the valley would be useful for constraining where landslides are likeliest to impact the Fraser River.
Once a landslide reaches a river, the impact is determined by the total volume of the landslide relative to the accommodation space in the river and the grain size of debris relative to the river's capacity to move that calibre of sediment, which may be better correlated with lithology or failure mechanism; however, quantifying this correlation would require detailed, in-situ analysis of individual landslides throughout the Fraser River Corridor. Large landslides that reach the river but are slow moving (such as earthflows) may not have a substantial impact. Similarly, large-volume landslides can completely block the channel and also have no substantial impact if the material is fine-grained and easily transported by typical flows. In contrast, relatively small landslides, made up of large blocks and boulders, can have a substantial impact because they change flow dynamics in the river, much like the Big Bar landslide. However, changes to flow only happen where the river cannot accommodate or transport the supplied sediment. The Fraser River traverses distinct morphologic zones, lithologies and climatic zones. Hence, a significant range of impacts is possible because of varying landslide lithologies and styles throughout the study area. We explore the potential ecohazard of landslides in our database that are known to have reached the river; then we categorise all the events as being minimal, moderate, substantial, and severe in terms of the ecohazard impact; and then consider the risk profile of different types of events.
4.1.1 Minimal impact landslides
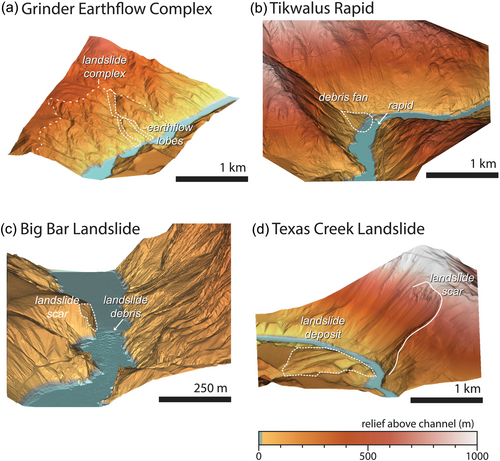
Earthflows and landslides composed of fine sediment are two types of landslide that will have a minimal impact on salmon migration. Within the dataset, we identified 14 earthflows in the Fraser Canyon Corridor. Earthflows in British Columbia have been well-documented and have periods of accelerated movement and quiescence on decadal timescales, primarily driven by hydroclimatic cyclicity (Bovis, 1985; Bovis & Jones, 1992). Whereas earthflows are many of the largest landslides mapped in the Fraser River Corridor, the nature of their pervasive delivery of fine-grained material has little impact on the Fraser River hydraulics. For example, the Grinder Creek Earthflow complex (Figure 12a) has an area of 1.2 × 10⁶ m2 and flows along ~1.5 km of the Fraser River channel. Despite the large area and direct contact with the river channel, at present, the Grinder Creek Earthflow does not significantly impact salmon migration. There is substantial bedrock exposure on the bank opposite from the Grinder Creek earthflow, which may indicate the river has been diverted to the east by the influx of earthflow sediment over post-glacial timescales, but the total mass and size of particles delivered by the earthflow to the river at any given time have been transported by the river and do not disrupt the flow. Recent InSAR work demonstrated ~30 cm of movement on portions of the Grinder Creek earthflow in 4 years of observation (Choe et al., 2021). Combining the velocity with the calculated depth from the volume estimates (~1.2 m) and the length of river exposure (1,500 m) suggests the Grinder Creek earthflow has recently supplied sediment to the channel at a maximum rate of 86 t yr−1, or <0.001% of the sediment yield measured ~125 km upstream (Church, Kellerhals, & Day, 1989). Our estimated sediment delivery rate is likely an overestimate as Choe et al. (2021) only observed movement along discrete portions of the earthflow abutting the river, rather than along the entire 1500 m in contact with the channel.
The other type of minimal-impact landslides is those composed of fine material that the river can easily transport. Short-term blockages along the tributaries of the Fraser River by slumping of Quaternary sediments are commonplace. The Chilcotin River has been blocked three times in the past 60 years by landslides that occurred in 1964, 2004 and 2024 at Farwell Canyon, ~15 km upstream of the Fraser River (IPFSC, 1964; British Columbia Ministry of Emergency Management and Climate Readiness, 2024). The landslide in 1964 was ~750 000 m3 and created a dam that was ~21 m high, but only blocked the river for 5 h because it was mostly composed of silt and clay material. The most recent river-blocking landslide deposit in 2024 was larger but was breached within 6 days. These types of landslides impact salmon but mainly because of high sediment concentrations in the river following a landslide rather than by altering flow significantly enough to block migration. These landslides in Quaternary sediment are similar to those documented on the Thompson River over the historical period, where effects ranging from partial rerouting of the primary channel to a 44-h damming have impacted local agriculture, transportation and property (Clague & Evans, 2003), although little evidence of significant impact to salmon migration is mentioned in the historical record.
Landslides that deliver small volumes of fine sediment, either continuously or in a punctuated manner, are unlikely to impact salmon migration in a meaningful way, given the relatively small volume of debris and the readily mobilised nature of individual particles within the landslide deposits. Whereas fish in the area directly following failure may face adverse circumstances, the effects are unlikely to persist beyond a few days or weeks. However, given the impact of fine sediment on salmon and other aquatic species (e.g. Greig, Sear, & Carling, 2005; Newcombe & Jensen, 1996; Thapa et al., 2024), the increased turbidity because of continuous input of fine-grained sediments from these ‘minimal impact’ landslides constitutes a separate form of ecohazard that warrants further study.
4.1.2 Moderate impact events
The Fraser River recently experienced an example of a moderate-impact landslide that significantly altered the hydraulics but had minimal effects on salmon migration. In mid-November 2021, southern British Columbia was affected by 3 days of intense precipitation (188–228 mm total; Baird, 2024), leading to flooding and significant infrastructure damage (Baird, 2024; Sepúlveda et al., 2023). One debris flow in a tributary of the Fraser River, which drains the northeast flank of Spuzzum Mountain, deposited enough coarse-grained sediment in the Fraser River to form the new Tikwalus Rapid (Figure 12b). The debris in the channel and the resulting rapid are still present, even following a 10-year flood (~10 000 m3 s−1) in the Fraser River during the early summer of 2022. The Tikwalus Rapid-forming debris flow is an example of a landslide-induced change to the hydraulics of the Fraser River that is persistent across multiple years and has the potential to impact the ecosystem. There is a substantial vertical drop in the water surface at Tikwalus Rapid during low discharges, but it mostly disappears at higher discharges, when most salmon migrate upstream. Despite creating high-velocity zones, the volume of the immobile material is too small relative to the accommodation space in the river channel to impede fish passage. Ultimately, little effect on salmon migration was observed in the years following the landslide. Although the impact of this event was low, a somewhat larger landslide capable of filling the accommodation space in the channel could have a greater impact.
4.1.3 Substantial impact events
The 2018 Big Bar landslide deposited ~8.5 × 10⁵ m3 of rock directly into a remote section of the Fraser River (Figure 12c). The rockfall occurred because of the failure of a bedrock cliff that borders the Fraser River at one of its narrowest points and dammed the river for approximately 7 h, subsequently forming a ~ 7.5 m overfall that created a hydraulic barrier to upstream salmon migration. The combination of total debris volume, large, decametre-scale boulders in the deposit, and a channel geometry with low accommodation space led to a significant impact on salmon migration, resulting in high mortality. If not for intervention, the Big Bar landslide would have decimated salmon populations that spawn upstream, particularly given existing anthropogenic stressors on salmon. The volume of the Big Bar landslide is smaller than approximately two thirds of the mapped landslides in our inventory, making it a relatively modest-sized landslide compared to those that have occurred since deglaciation. Landslides of a similar size to the Big Bar landslides are thus common in the post-glacial Fraser River Corridor (Figures 6 and 9). Our mapping methodology likely underestimates the frequency of landslides like the Big Bar landslide, which occurred adjacent to the Fraser River. Landslides of a similar size originating in direct proximity to the river generate deposits that are subsequently eroded and mobilised by the river, making their identification in the lidar data challenging. Even with high-resolution topographic data, we cannot discriminate cliff morphologies that result from the release of small, individual blocks of rock from those of Big Bar-style rockfall events, which generate larger-volume deposits. It is reasonable to conclude that landslides similar to the 2018 Big Bar landslide have occurred throughout the post-glacial history of the Fraser River, where high bedrock cliffs border the channel, but that, over time, the slide debris has been cleared from the channel.
4.1.4 Severe impact events
The Texas Creek rock avalanche(s) (Figure 12d) consists of up to two landslides that occurred ~16 km south of Lillooet. Originally, Ryder, Bovis and Church (1990) proposed two landslide deposits, one with an estimated volume of ~45 × 106 m3 and a smaller, subsequent landslide with an estimated volume of ~7.2 × 10⁶ m3. These deposits are found on the opposite bank of the Fraser River from the associated scarps (Ryder, Bovis, & Church, 1990). The deposits formed a major impoundment, causing extensive upstream backwater sedimentation (Ryder, Bovis, & Church, 1990). A recent reassessment of the Texas Creek site was only able to corroborate a single landslide dated at 2.28 ± 0.19 ka (Friele, Blais-Stevens, & Gosse, 2024). Regardless of the number of distinct failures, the resulting decline in the salmon population has been argued to have caused the abandonment of villages by Indigenous communities ~1000 years ago (Hayden & Ryder, 1991). The rock avalanche(s) at Texas Creek are the landslides that have most significantly impacted the Fraser River since deglaciation, for which there is still evidence. The combination of very large volumes, coarse grain size, confined valley morphology and rapid failure was sufficient to form a ~45-m tall landslide dam (Ryder, Bovis, & Church, 1990), completely blocking salmon from migrating further upstream until the debris had been sufficiently eroded by the Fraser River. Recent compilations of landslide dam persistence have demonstrated that rock avalanches with sufficiently coarse debris can last decades or more (Fan et al., 2020), suggesting entire salmon runs could be extirpated by the time a major dam was breached and sufficiently reworked to allow salmon passage. Even with intervention, a landslide of this size would likely take many years to remediate, if remediation is possible, and serves as a worst-case scenario for salmon from an ecohazard perspective.
4.2 Ecohazard risk framework
The above examples allow for the development of an ecohazard risk matrix that assesses the potential for harm to salmon migration based on the (i) size of the landslide, (ii) proximity to the channel and the landslide length, and (iii) deposit ‘longevity’ (Figure 13). Landslide size must be assessed relative to the capacity of the channel to accommodate the material. Landslides that occur near the channel must have their risk assessed relative to the accommodation space in the channel. Landslides that occur near the channel are more likely to have an impact on salmon migration than those that occur distally, but that is set by the landslide length. Longevity is a function of landslide material grain size relative to the river's capacity to move it. Longevity is also influenced by landslide size because it takes time to transport landslide material, especially when a river is only marginally able to transport a particular sediment size.
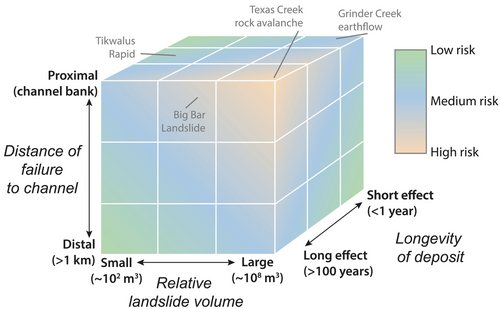
A risk profile can be assigned to the examples (mentioned earlier), which were all chosen because of their proximity to the channel. Texas Creek is high risk because the landslide occurred immediately adjacent to the channel, was significantly larger than the accommodation space and is thought to have persisted for a long time. We do not know the exact grain size distribution of the Texas Creek landslides, but the landslide debris preserved on the opposite side of the river from the scarp contains up to 3-m boulders, suggesting at least some of the material was large enough to remain in the channel long enough to create a lake that extended upstream to Lillooet. Big Bar is also high risk as it included coarse debris that altered the hydraulics and filled the accommodation space but not sufficient to create a long-lived dam. Tikwalus Rapid is a medium risk landslide as it included large debris that altered the hydraulics of the river for multiple years but did not fill the accommodation space. The Grinder Creek earthflow is low risk. Although the earthflow source is not immediately adjacent to the river, it has a long runout that brings the landslide material to the river, but that material is composed of grain sizes that the river can easily transport.
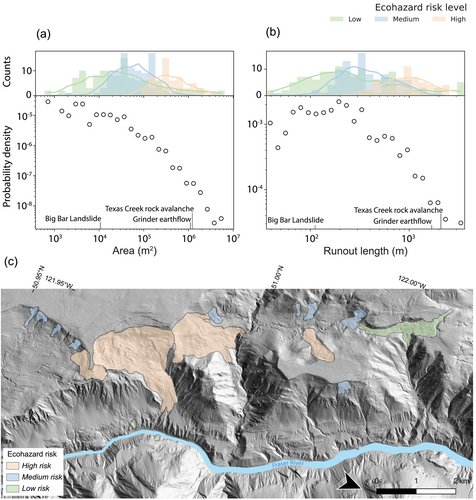
The risk classifications can be applied to distributions of mapped landslides in our inventory to consider the impact on salmon migration should similar size landslides occur adjacent to the channel. Landslides in the flow/spread category are low risk as the rate of sediment delivery to the channel is low enough for the river to transport it. Landslides that occurred within Quaternary sediments were also classified as low risk because their debris is relatively easy to mobilise by the flow over days to weeks. There are contingencies that could change this classification, such as the presence of large boulders in a Quaternary deposit that could persist as a lag, but these types of landslides have been cleared in the past over relatively short time periods. Landslides in the inventory that occurred within bedrock and had a total estimated volume <1 × 10⁶ m3 were classified as moderate risk because bedrock landslide grain size includes large boulders not easily mobilised, although their impact could vary widely depending on the channel morphology and position in the valley where the landslide originates. Finally, bedrock landslides with an estimated volume >1 × 10⁶ m3 were classified as high risk, assuming the debris is composed of a significant fraction of large bedrock boulders, which are beyond the ability of the Fraser River to easily mobilise even at high flow. Application of these classifications to landslide areas (Figure 14a) and landslide length (Figure 14b) reveals that low risk landslides are the most frequent, whereas high risk landslides occur at a lower frequency for both landslide areas and landslide lengths, in agreement with our overall finding that large, catastrophic landslides are rarer in comparison to small, low risk events.
Our landslide inventory provides a clearer understanding of the distribution and size of past landslides along the Fraser River, suggesting that the Big Bar landslide is not a unique event in the region, although its proximity to the river and lithology made it particularly impactful to salmon. There is a desperate need to build landslide inventories in other salmon-bearing rivers to assess ecohazards posed by landslides on salmon populations. There is also a need to quantify the qualitative components of our ecohazard framework, including the accommodation space, landslide debris grain size and transport capacity of salmon-bearing rivers so we can make quantitative predictions of where landslides are most likely to cause significant disruption to salmon migration. Landslides impact salmon in other parts of the Pacific Rim and aquatic ecosystems throughout the world (Cooke et al., 2022; Xiong et al., 2022). The ecohazard classification we propose is flexible and adaptable to other landscapes where suitable topographic data and imagery data are available for generating historic landslide inventories or where landslide inventories already exist. The ecohazard framework could also be adapted for landscapes undergoing other punctuated changes in erosion pace or style, such as locations where high-intensity fire or changes in rainfall intensity create transient changes to sediment load or water quality (Smith et al., 2011).
5 CONCLUSIONS
We mapped 274 landslides that occurred over the last ~12–15 ka in the valley surrounding the Fraser River and found area-frequency, volume-frequency, and area-volume relations that are consistent with existing landslide inventory metrics. When classified by lithology and failure style, median landslide areas range by roughly an order of magnitude in each case; however, the range of areas overlaps for all categories. Landslide length and elongation is relatively similar across these classifications, suggesting valley morphology and the position of bedrock exposure relative to the river are the dominant factors to consider when assessing future landslide risk to aquatic organisms that rely on the Fraser River. We introduced an ecohazard framework for exploring the impacts a landslide has on salmon migration in the Fraser River, discriminating low impact, moderate impact, substantial impact and severe impact. Our inventory bolsters our understanding of the character and location of past landslides along the Fraser River, a key to understanding the risk posed by landslides to salmon migration in the future.
AUTHOR CONTRIBUTIONS
Venditti, Menounos, Larsen, Heathfield and Dingle conceptualised the project and acquired funding. Steelquist, Carr, Seagren, and Dingle established the methodologies. Steelquist, Seagren, Baird, Heathfield, and Menounos completed the investigation and collected the data. Menounos and Heathfield provided the data. Menounos, Larsen, Dingle and Venditti were project supervisors. Steelquist, Heathfield and Venditti wrote the first draft. Steelquist, Carr, Menounos, Larsen, Dingle and Venditti completed the revisions.
ACKNOWLEDGEMENTS
Thanks to Ben Leschinsky for providing the coding framework for estimating volume and for helpful discussions of estimating volume. Thanks to Andrew Graber for providing digitised data from Hungr, Evans and Hazzard, 1999. We thank the Kanaka Bar Indian Band and the Lytton First Nation for permitting us to work on their traditional territories.
CONFLICT OF INTEREST STATEMENT
The authors declared no competing interests.
Open Research
DATA AVAILABILITY STATEMENT
Lidar survey metadata is available at: https://catalogue.hakai.org/dataset/ca-cioos_0295e3a3-11b5-494d-ac60-ed4b95a15fad. Lidar data are available by request from the Hakai Institute. Landslide inventory GIS and attribute data are available via the Federated Research Data Repository (FRDR), DOI: 10.20383/103.01282.


