The hydro-geomorphic effects of wooden leaky barriers in a steep headwater stream
Funding information: This work was supported by the Rural and Environment Science and Analytical Services Division of the Scottish Government (JHI-D2-2).
Abstract
Purposely placed in-stream wooden leaky barriers (LBs) with lower gaps to facilitate flow during average conditions have become a popular type of nature-based intervention in catchments for flood risk mitigation. Empirical evidence on their effectiveness remains rare, however. The hydro-geomorphic effects of 16 LBs were monitored over three years on the Elm Sike, a small upland stream (catchment area: 0.33 km2) in the Scottish Borders, UK. The aims of the structures were to: (1) increase water storage and roughness and, in turn, attenuate and delay flood peaks; and (2) trap and store coarse sediment to reduce sediment-related problems downstream. Annual topographical surveys were conducted to assess geomorphic changes, and continuous 5-minute water levels were recorded to assess changes in peak flow travel times. Two-dimensional hydraulic modelling (HEC-RAS 2D) was undertaken to assess the hydraulic impact of the structures and geomorphic changes. The LBs had no effect on peak flow travel time and rate of stage rise or fall based on 22 events with an Annual Exceedance Probability (AEP) of ≥ 3.7%. Hydraulic modelling showed limited velocity reduction and expansion of inundation extent due to the LBs for 50% AEP flows, but slightly greater effects for larger 5% AEP flows. However, for 50% AEP flows, inundation extent increased and velocities decreased more significantly due to morphological changes initiated by the structures. The limited hydrological and hydraulic impacts were related to the small size of the structures, close spacing and the steep, confined valley setting that limited water storage capacity. At the end of the three-year period, a reach-wide net deposition response of 3.49 ± 0.36 m3 and a 5.3% loss of total LB backwater storage were observed, but local geomorphic response due to the LBs was spatially variable. Backwater capacity at 10 structures was reduced, and the lower gap increased at eight structures due to bed scour, indicating accelerated underflow. Multivariable analysis showed that gap height change was inversely related to backwater shear stress, channel cross-section area and channel slope. No factors explained backwater sediment deposition, but a threshold lower gap height of ≤0.4 m for initiating deposition was evident. These hydro-geomorphic observations have implications for the design and placement of LBs in river restoration and flood risk management projects.
1 INTRODUCTION
Climate change is predicted to increase flood magnitude and frequency, posing an increasing hazard in populated areas (Arnell & Gosling, 2016). Greater flooding incidences could also result in increased erosion, sediment transport and deposition (Lane et al., 2007). These sediment aspects, as well as presenting a direct hazard to transport infrastructure, farmland and areas of settlement, could indirectly increase flood hazard through reducing channel conveyance capacity (Lane et al., 2007; Slater & Singer, 2013). Uplands are key source areas for flood generation and coarse sediment. Those areas degraded through intense grazing, resulting in loss of vegetation, are particularly sensitive to both heightened flood generation and coarse sediment transport (Macklin & Lewin, 2003; Milan & Schwendel, 2021).
In upland streams with intact riparian tree cover, naturally occurring in-channel wood accumulations that span the channel width can generate significant hydraulic roughness and ponding depending on the distribution and type of wood (Curran & Wohl, 2003). Log jams can also trap sediment and delay its transport downstream (Clark et al., 2022; Pfeiffer & Wohl, 2018). Localised hydro-geomorphic change can, in turn, increase the diversity of hydraulic habitats (Klaar et al., 2011). Nature-based solutions (NBS), including riparian planting, river restoration and addition of in-channel wood, are increasingly being applied to mimic these functions (e.g. Black et al., 2021; Wilkinson et al., 2019).
Channel-spanning wooden leaky barriers (LBs) have become a popular type of NBS in small (< 5 m channel width) upland streams, especially in Europe (e.g. Hankin et al., 2021; Kravčík et al., 2012; Norbury et al., 2021; Senior, Trigg, & Willis, 2022). They consist of strategically placed logs and/or branches stacked above the streambed and banks. A common feature is a lower gap to maintain baseflows, facilitate fish passage and maintain pre-event water storage capacity. By temporarily impounding water and increasing hydraulic roughness, LBs are intended to reduce and delay flood peaks.
Flume-based and computational hydraulic modelling studies provide a useful understanding of the effects of LBs and associated controls. Important aspects include the proportion of channel cross-section area blocked (Geertsema et al., 2020; Muhawenimana et al., 2021), the complexity of the structure (Shields & Alonso, 2012) and density, which can vary depending on the extent of debris build-up by leaf litter (Follett, Schalko, & Nepf, 2020) and the size of the lower gap (Follett & Hankin, 2022). These aspects, in turn, determine the flow resistance and extent of backwater rise. Spacing of structures and channel slope are also important considerations (Follett & Hankin, 2022; Follett & Wohl, 2024). Reach-scale studies of deliberately placed large wood structures indicate peak flow attenuation effects for <5-year recurrence interval events of ≤10% (Keys et al., 2018; Wenzel et al., 2014). However, empirical, field-based observations of hydraulic and hydrological performance of LBs (van Leeuwen et al., 2024) that feature lower gaps are limited despite the wide uptake of such measures (Table 1).
| Study | Location | Context a | Structure characteristics | Structure dimensionsb | Structure N | Effects |
|---|---|---|---|---|---|---|
| Hydraulic and hydrological responses | ||||||
| van Leeuwen et al. (2024) | River Cover headwaters, North Yorkshire, UK | CA: 1.1 km2 RL: 280 m CS: 0.13 m/m |
Channel spanning with lower gaps | W:≥1.5 X channel width H:0.8 m above bed LG:0.3 m |
8 | Variable effectiveness but on average flood peak discharge was reduced by 10% for ≤ 1 year recurrence interval floods. |
| Muhawenimana et al. (2023) | Wilde Brook, Shropshire, UK | CA: 5.3 km2 RL: 5.36 km CS: ~0.01 m/m |
Channel spanning with lower gaps or in-channel wood accumulations | W:~Channel width H:0.85–1.1 m LG: ≤0.75 m |
105 | Estimated that each LB provides ≤102 m3 of water storage (total volume: ~10,700 m3). |
| Norbury et al. (2021) | Dean Brook, Bolton, UK | CA: 0.72 km2 (upstream of LBs) RL: ~150 m |
Channel and floodplain spanning LBs with willow stakes | W: Varies but total width of LBs equals 130 m H:> bankfull depth |
5 | An average of 27.3% reduction in peak discharge post-installation. Baseflows were increased by 27.1%. |
| Wenzel et al. (2014) | Ullersdorfer Teichbächel, Southeast Germany | CA: 2 km2 RL: 282 m CS: 0.037 m/m |
Longitudinally placed spruce trees blocking whole channel | W: ≥channel width of 0.8 m H:> bankfull depth |
9 | For a 3.5 year recurrence interval flood, the peak was delayed by 166 seconds and reduced by 2.2%. |
| Keys et al. (2018) | Blacksburg, Virginia, Eastern USA | CA: 1 km2 RL: 50 m CS: 0.01 m/m |
Tree rootwads blocking whole channel | W: ~ channel width of 0.93 m H:> bankfull depth |
3 | For floods ≤1-year recurrence interval, inundation depth and extent increased by 33% and 34%, respectively. Peak discharge was reduced by 8%. |
| Geomorphic responses | ||||||
| Lo et al. (2022) | River Cover headwaters, North Yorkshire, UK (same location as van Leeuwen et al. (2024) | CA: 1.1, 1.9 km2 | Channel spanning with lower gaps | W:≥1.5 X channel width H:0.8 m above bed LG:0.3 m |
6 | Sediment storage observed only when lower gap heights were <0.3 m. Bank erosion was a common response to LBs. |
| Wolstenholme et al. (2024) | Staindale Beck, North Yorkshire, UK | CA: 12 km2 | Channel spanning with lower gaps | W: 6.2 m, 8.55 m LG: 0.28 m, 0.14–0.43 m |
2 | Local topographic complexity increased and scour pools developed d/s. Grain size fining occurred u/s and coarsening occurred d/s. |
- a Acronym definitions, CA: catchment area, RL: reach length and CS: channel slope.
- b Acronym definitions, W: width of structure perpendicular to flow, H: crest height of structure above stream bed and LG: lower gap height.
LBs like other in-channel wood features, also have a potential role in altering channel morphology and storing sediment. Potential responses include upstream aggradation (Lo et al., 2022) akin to that observed near natural log jams (Pinto et al., 2019) and downstream scour caused by plunging overflow (Wallerstein & Thorne, 1996) or accelerated underflow (Muhawenimana et al., 2021). These responses in turn have implications for the creation and maintenance of habitats, for example, pools and bars (Lo et al., 2021). Furthermore, they could alter channel hydraulics (Schalko et al., 2019) and, in turn, the management of flood peaks (Hankin et al., 2019). Moreover, geomorphic adjustment could undermine the structures, leading to collapse (Chappell & Beven, 2024) or bypass of flow. However, field-based assessment of these responses and their controls remains sparse (Table 1).
Guidance for informing appropriate LB design and placement that considers both geomorphic and hydraulic performance is currently lacking. Validated hydraulic models that represent the backwater effects of LBs (Follett & Hankin, 2022) and log jams (Altmann et al., 2024; Geertsema et al., 2020) have been developed. The interaction of time variable channel hydraulics and geomorphology in response to LBs have also been modelled, showing the importance of accounting for sediment transport on resulting hydraulic roughness and water storage (Wolstenholme et al., 2024, 2025). However, empirical studies that account for the changing nature of stream conveyance due to morphological change in relation to LBs are absent. This research is needed to help inform appropriate structure designs, maintenance and placement locations within a catchment to maximise performance for managing the hydrological and geomorphic impact of floods.
In this three-year reach scale study, the hydro-geomorphic impacts of 16 LBs was assessed through monitoring of stream stage, morphological change and hydraulic modelling. The aims of this study were firstly, to assess the impacts of LBs on event scale flood peak travel time, rising limb rates and falling limb rates. Secondly, to assess the hydraulic effects of the structures and associated morphological changes. Thirdly, to assess morphological changes in response to the structures and associated controls.
2 BACKGROUND
2.1 Study area
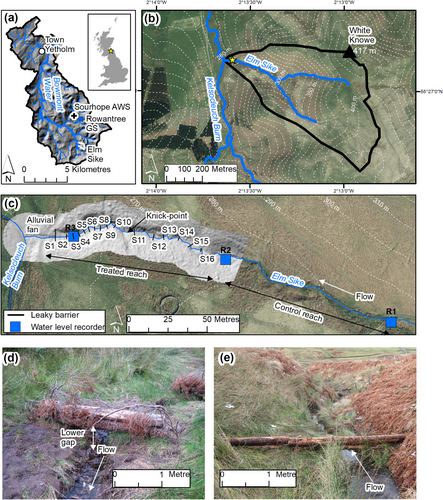
The Elm Sike (0.33 km2) is a steep tributary of the Kelsocleuch Burn (6.5 km2) within the Bowmont Water catchment (87 km2), a sub-catchment of the River Tweed in the Scottish Borders (Figure 1; Table 2). Land use consists of rough sheep grazing with bracken (Pteridium), rushes (Juncus sp.) and Molinia grasses, the dominant vegetation types. Due to deforestation, the Bowmont catchment has been essentially treeless since 200 BC (Tipping, 1994). The lithology consists of Early Devonian Andesitic lavas that are overlain by glacial till and alluvium in the valley bottoms. Main soil types in the Elm Sike catchment are brown rankers and brown earths towards the outlet (UK Soil Observatory, accessed May 2024).
| Catchment area | 0.33 km2 |
| Catchment mean slope | 0.042 m/m |
| Stream order | 2nd order |
| Reach length | 260 m (114 m) a |
| Channel slope | 0.089 m/m |
| Median bed particle size | 49.8 mm b |
| Mean bankfull width | 0.85 m c |
| Mean bankfull depth | 0.15 m c |
| Bankfull channel volume | 21.5 m3 d |
- a Length of reach between R1 and R3. In brackets, the distance of the treated reach within the fenced enclosure.
- b Based on aggregation of data from two Wolman (1954) pebble counts of the streambed surface carried out in June 2016.
- c Bankfull dimensions based on visual identification of vegetation boundaries and changes in bank slope angle. The River Bathymetry Toolkit (RBT; Version 4.0; McKean et al., 2009) was used to calculate channel dimension statistics.
- d Based on multiplication of channel cross-section area by reach length.
Notable floods in September 2008 (Annual Exceedance Probability, AEP of ≥1.42%), July 2009 and September 2012 (AEP of 5%–10%) resulted in considerable channel movement and damage to road infrastructure and property throughout the Bowmont valley (Addy & Wilkinson, 2016). As part of a natural flood management project (Cheviot Futures – Tweed Forum), LBs were added to the lower Elm Sike within a fenced area planted with deciduous tree species in September 2013. This area was selected as it is unproductive for farming. The treated study reach is steep and moderately confined with a 1 m high bedrock knick-point that forms a waterfall (Figure 1c). Towards the outlet, confinement and slope reduce over an alluvial fan.
2.2 Leaky barrier aims
Two aims were set for the LBs. Firstly, the main aim was to increase floodwater storage and roughness to attenuate and delay flood peaks. As there was a perception that the oversupply of sediment to downstream reaches was increasing flood risk and damaging farmland, the second aim was to trap and store sediment. No specific criteria for performance were set, and no consultants were employed for the design. Each LB consisted of two horizontal coniferous timbers securely attached by metal wire to posts embedded into the banks (Figure 1d). A lower gap (mean height: 0.33 m) between the timber underside and the streambed was made due to concerns about the passage of Atlantic salmon (Salmo salar) and brown trout (Salmo trutta; Figure 1d). On average, each structure was 2.8 m wide and 0.7 m high above the streambed, blocking 29% of the bankfull channel cross-section area (Supplementary Materials, Table S1; Figure 1c, d and e). The structures were constructed by hand in two stages. In September 2013, 10 flow restrictors (S1 to S10) were placed near the outlet of the catchment (Figure 1). In February 2014, a further six structures of the same design (S11 to S16) were added upstream, and S2 was lengthened.
The 16 structures created a total backwater storage volume of 51.68 ± 12.11 m3 with 10 structures having backwaters that intersected adjacent upstream structures (Table S1). Between September 2013 and February 2015, geomorphic changes adjacent to the structures and elsewhere were limited (Addy & Wilkinson, 2017); over January 2014 to February 2015, the reach-wide erosion and deposition volumes were 0.86 m3 and 0.45 m3, respectively. Thus, it is assumed that the geomorphic changes induced by the LBs mainly relate to the period of February 2015 to May 2018.
3 METHODS
3.1 Hydrology
Three non-vented pressure transducers were used to monitor stream depth continuously at 5-minute intervals over the reach treated with LBs and the upstream control reach from July 2015 until June 2018 (Figure 1c). Two In-situ Rugged Troll 100 s (R3 and R2; accuracy: ±0.05% of range) and a single Van Welt DI 501 Mini Diver (R1; accuracy: ±0.5 cm) were used. Each sensor was suspended inside a PVC pipe that was attached to a post on the bank (R1 and R2) and to the upstream side of structure S3 (R3). At R3, the stage is influenced by both the backwater influence of the structure and the cumulative effects of the structures upstream. Data was downloaded from each sensor on a monthly basis and corrected to account for atmospheric pressure using a nearby barometric pressure sensor (Rugged Baro Troll 100; accuracy: ±0.05% of range). During each visit, depth was also manually measured as a check on the reliability of sensor observations. Corrections were made to ensure depth was relative to a common datum for each sensor in order to compensate for changing bed levels as a result of deposition or erosion.
3.2 Topographical surveys and geomorphic change analysis
Topographical surveys of the streambed and banks were undertaken with a Leica Geosystems 1200 differential GPS (Global Positioning System, accuracy: ± 0.02 m in plan and c. ± 0.03 m in elevation) in combination with a Leica Geosystems GPS 500 base station on an annual basis between February 2015 and May 2018. This encompassed three periods: 2015 to 2016, 2016 to 2017 and 2017 and 2018. More survey points were surveyed within active channel bed areas (>11.5 pts/m2) given the higher topographical variability compared to out-of-bank areas (>2.7 pts/m2; Supplementary Materials, Table S2). All survey points were post-processed to the same datum (Ordnance Survey British National Grid). The geometry (width, length, crest height and lower gap height) of each structure was surveyed following construction. No changes in structure geometry through movement were observed thereafter, and thus the basic structure dimensions are assumed to have remained from the beginning. In addition, the reference heights of each water level recorder were surveyed to convert depth data into Water Surface Elevations (WSEs) referenced to the British National Grid datum, and post-flood high water marks (vegetation debris) left on structures and vegetation were surveyed in the 2016 and 2017 surveys. No high-water marks were identified in the 2018 survey. Due to the time gap between floods and surveys, the flood peak inundation extents and elevations are uncertain.
ArcGIS (Version 10.5.1) was used to produce and analyse terrain models. For each survey following screening to remove dubious survey points, 0.1 m resolution Digital Elevation Models (DEMs) were produced using linear interpolation of triangular irregular network (TIN) models. This method has been shown to be a reliable for representing fluvial topography (Heritage et al., 2009). To determine morphological change and account for uncertainty in the DEMs, the Geomorphic Change Detection (GCD, Version 7; Wheaton et al., 2010) extension for ArcGIS was used to produce DEMs of difference (DoDs) at the 95% confidence interval for each period. A spatially variable rules-based Fuzzy-Inference System (FIS) that used survey point density and slope raster inputs was used to exclude dubious changes. The FIS allowed uncertainty levels to be tailored according to the variability of these inputs. DoD maps of genuine elevation change and metrics on volumetric change were then derived and validated against visual observations (Figure S1). CES (River Conveyance software | HR Wallingford) was used to produce metrics on channel cross-section area to investigate the local morphological effect of the LBs.
3.3 Hydraulic modelling
3.3.1 Model parametrisation
HEC-RAS (Version 6) was used to model in 2-dimensions (2D) the hydraulic effects of the LBs over time for different magnitudes of flow and to explore interactions between the hydraulics and morphological change. Previously, HEC-RAS has been successfully used to model the 2D hydrodynamics of LBs (Follett & Hankin, 2022; Keys et al., 2018).
The model geometry for each period of interest was based on the DEM from the start of each period. The computational mesh included the wetted channel area and out-of-bank areas. On average a computational mesh cell size of 0.1 m in the active channel areas, similar to the topographical survey point spacing, and 0.5 m in other areas was set. As depth data recorded at R3 needed for model calibration and validation became unreliable in April 2018, no modelling was carried out on the final morphology surveyed in May 2018.
Modelling required adjustment of roughness (Manning's n) and an appropriate hydraulic representation of the LBs. Starting Manning's n values were informed by Chow (1959) and adjusted iteratively to improve the prediction of observed stage. A value of 0.1 to represent the streambed and out-of-bank areas was used for all years except 2017, when a value of 0.07 was used for the streambed and 0.1 was used elsewhere to improve model fit. Each LB was represented in HEC-RAS as a solid embankment with geometry characteristics based on the survey data (Table S1). Custom water level–discharge rating curves were then associated with each LB. The rating curves were based on the momentum-based model devised by Follett & Hankin (2022) and parameterised using a macro spreadsheet toolkit (Follett & Beven, 2023). This model considers the stage-dependent hydraulic effects of the LBs by accounting for log-generated drag, accelerated lower gap flow and overtopping flow as represented by a sharp-crested weir (weir coefficient: 0.67). The channel geometry characteristics, roughness, LB geometry and ratio of uniform flow depth to upstream flow depth generated by each LB (h0/hj) were specified in the toolkit. A h0/hj value of 0.25 was assumed for all structures following iterative adjustment and comparison with stage observations. Parameters used to represent the structures are presented in Supplementary Data (Supplementary Materials).
The Shallow Water Equations, Eulerian–Lagrangian Method (SWE-ELM) and a computational interval of 0.1 s were used in all model runs. The downstream reach boundary was set to a normal depth condition (friction slope: 0.06 m/m). No turbulence model was used to reduce model run times. To isolate the indirect effect of the structures on channel hydraulics through initiating morphological changes, for each flow modelled, a scenario without structures was also run. Peak velocity and shear stress maps at 0.1 m cell resolution were produced from all design flow model runs. A limited number of cells (≤ 6% of total) in the model outputs had velocities exceeding 2 m/s and shear stresses exceeding 250 N/m2. These were treated as overestimated values and reclassified in ArcGIS with values of 2 m/s and 250 N/m2 set for velocity and shear stress, respectively. Mean velocity statistics were extracted from both the upstream backwater and downstream wake zones of each LB. The upstream extent of each backwater zone was defined by the WSE that matched the crest height of each structure. The wake zone was defined as a 1 by 2.5 m rectangular orientated perpendicular to the flow, immediately downstream of each structure.
3.3.2 Model calibration and validation
Unsteady models at 5-minute intervals were run and calibrated against observed continuous water surface elevation data for discrete events collected from R3, and also using available reach-wide high water mark data. Five-minute stage data observed at R2 were used as the input for model runs. Selected overbank flood events for each period were used for calibration and validation. Stage hydrographs, model bias, Root Mean Squared Error (RMSE) and Normalised RMSE (NRMSE) metrics were used for evaluation. Following model calibration and validation, to explore the hydraulic conditions for each period, the observed maximum flood events were used as model input.
3.3.3 Model design flows
In addition to modelling of observed events, to allow comparison of hydraulic changes over time in response to changing morphology, design flows were derived. As there is no long-term flow record for the Elm Sike, annual maximum flows (AMAX) collected from the nearby Sourhope Environmental Change Network (ECN) gauging station on the Rowantree Burn (catchment area: 0.44 km2; Sourhope - United Kingdom | DEIMS-SDR; Rennie et al., 2017) were used. Whilst runoff responses to rainfall and snowmelt are catchment specific, land use, altitude and topography are similar, so it was assumed that applying a catchment area scaling factor to predict flows on the Elm Sike was valid. Design hydrographs were derived using a catchment area multiplication factor of 0.75 for the peak flow estimation at the upstream boundary of the treated reach (Table S3) and the hydrograph shape of an observed single peak event (Supplementary Materials, Figure S2). HEC-SSP 2.3 was used to predict the AEP% of the 1994 to 2018 AMAX record on the Rowantree Burn through application of a Generalised Logistic Model (L-moments) as recommended for flood probability estimation for UK rivers (CEH, 1999). 50% and 5% AEP events were then derived and modelled for each period in HEC-RAS (Figure S2, Table S3).
3.4 Event stage analysis
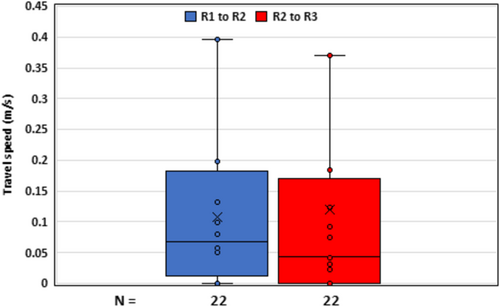
The hydrological analysis focused on time aspects of the observed stage hydrographs. Travel time between the treated and untreated reaches and changes in rising and falling stage limbs for selected flow events at each station were assessed. Studies into the changing time characteristics in response to NBS have previously been shown to be valuable and potentially circumvent the problems posed by unreliable rating curves for peak discharge characterisation (Black et al., 2021). Flow peak travel speeds (celerity) in m/s for the treated and untreated reach were then calculated by dividing the stream centreline distance measured in ArcGIS by travel time.
Analysis was undertaken in two stages. Firstly, only flow events associated with rainfall or snowmelt within a 24-hour period that resulted in a peak water depth at R1 of ≥0.1 m were selected. Thirty-six events were initially selected for analysis. This included multi-peaked events where the highest peak level was used in subsequent analysis. It also included events where peak stage timings at the downstream stations of each segment (R2 for the upper untreated segment and R1 for the treated segment) preceded the peak times for the upstream station of each segment. These observations, although likely genuine, were excluded from the subsequent analysis. Flow events during the period from 18th November 2015 to 9th March 2016 were also excluded due to a 15-minute interval. Secondly, to enable analysis of hydrograph rising and recession limb rates, the following criteria were then applied for the event hydrograph at each station: (1) rising limb start points were defined at the point at which stage began rising and (2) end of event stage was defined as values that were 125% of the event starting stage (Scheliga et al., 2019), or stage that equalled the starting event value or at the time of the next flow event (Glendell et al., 2014). The revised list consisted of 22 events for the subsequent analysis. Mann–Whitney U-tests suitable for non-normal distributed data conducted in IBM SPSS (Version 22) software were applied to test for statistical significance differences between locations and treatments.
3.5 Statistical analysis of geomorphic responses
To assess which topographical, hydraulic and structural geometry controls influenced geomorphic responses, a multivariable analysis was performed. Backwater net volumetric change and structure lower gap height change for each structure over the three years of monitoring (N = 48) were the two dependent variables considered. Twelve potential independent controls based on field and GIS measurements alongside hydraulic model outputs for each structure were considered as covariates (Table S4). All variables were tested for normality and natural log transformed where required. Ratio variables were centred and scaled. A two-stage approach was then adopted in the multivariable analysis. Firstly, a Multiple Linear Regression (MLR) was undertaken. A best subsets model selection method using Corrected Akaike Information Criterion (AICc) was used to select the most parsimonious models. Secondly, to account for the effect of repeated observations from each LB location, a mixed model analysis was then applied. Structure ID as a factorial variable was included as a random effect, and the covariates as main effects, where p < 0.05 determined by the MLR were used as the fixed effects parameters. A Restricted Maximum Likelihood (REML) method was applied. Model residuals were checked for normality using histograms and Kolmogorov–Smirnov tests. All statistical analyses were undertaken in IBM SPSS (Version 22) software.
4 RESULTS
4.1 Hydrological responses
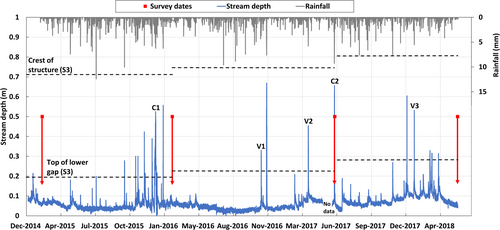
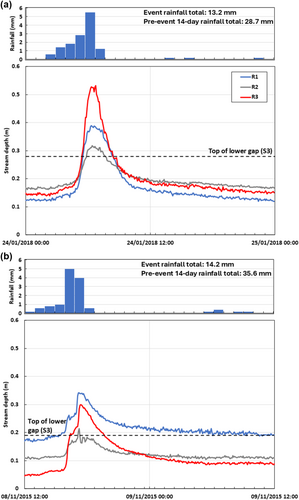
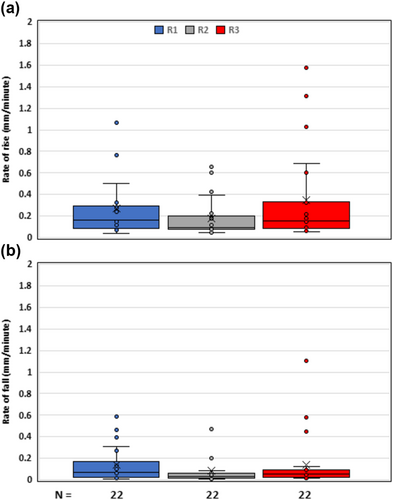
Over the three years, high flows were more frequent during the winter months compared to the summer months (Figure 2). Compared to winter high flows, stream responses to high rainfall were often muted during the summer months, presumably due to drier antecedent conditions. Eighteen high flow events that exceeded the lower gap height and intersected with, but did not overtop, LB S3 occurred (Figure 2). This indicates LBs elsewhere were frequently engaged with flows, but despite this interaction, at the reach scale, no statistically significant reduction in flow peak travel speed was observed (Mann–Whitney U-test, p > 0.05; Figure 3). In nine events out of twenty-two, flow peak travel speeds were slower in the treated reach (e.g. Figure 4). Investigation of stage dynamics of rising and falling limbs in response to LB presence also showed a limited effect with no statistically significant difference observed between treatments (Figure 5; Mann–Whitney U-test, p > 0.05).
4.2 Model calibration and validation results
Hydraulic model calibration was achieved through adjustment of Manning's n values and individual representation of the LBs. Peak water levels were predicted to within 2 to 18.7%, model bias ranged from −18.7 to 8.9% and normalised RMSE ranged from 24 to 14% (Table 3; Figure S3). For overall model evaluation, NSE values were good (>0.70) for calibration events C2 and C3, respectively, but poor for event C1, likely due to morphological change during the event at S3, resulting in a change in stage unaccounted for in the model. Model validation produced broadly similar results to the calibration (Table 3; Figure S4). Comparison of model predictions with observed high trash marks for events C1 and C2 showed a larger difference in WSE at the reach scale of 0.16 and 0.13 m, respectively, and adequate agreement in the wetted extent (Figure 6a and b).
| Event | Calibration events | Validation events | ||||
|---|---|---|---|---|---|---|
| C1 (05/01/16) | C2 (07/06/17) | C3 (03/01/18) | V1 (08/11/15) | V2 (23/03/17) | V3 (24/01/18) | |
| Stage hydrograph results | ||||||
| Obs. Peak – model peak difference (m) | 0.039 | 0.12 | 0.059 | 0.032 | −0.029 | −0.011 |
| Obs. Peak – model peak difference (%) | 10.4 | 18.7 | 9.7 | 9.5 | 7.0 | 2 |
| Model bias (m) | −0.027 | −0.050 | 0.055 | −0.014 | 0.061 | 0.063 |
| Model bias (%) | −10.4 | −18.7 | 8.9 | −4.5 | 14.8 | 11.6 |
| RMSE (m) | 0.069 | 0.079 | 0.071 | 0.031 | 0.073 | 0.065 |
| NRMSE (%) | 23.79 | 13.66 | 18.95 | 9.45 | 17.02 | 19.36 |
| NSE | −0.03 | 0.77 | 0.72 | 0.76 | 0.63 | 0.59 |
| High water mark results | ||||||
| RMSE (m) | 0.156 | 0.128 | - | - | - | - |
| NRMSE (%) | 1.32 | 1.15 | - | - | - | - |
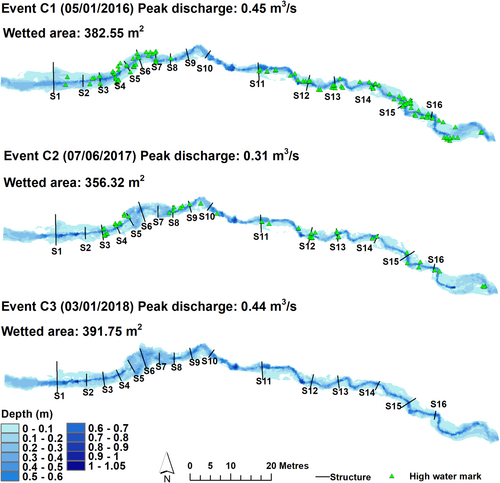
Considering the steep and turbulent nature of the reach, the calibrated models were acceptable for predicting the peak flood inundation extents, velocities (Figure S5) and shear stress (Figure S6) distributions for each monitoring period. It is, however, recognised that reliable hydraulic representation is potentially undermined by model equifinality; different combinations of LB and hydraulic roughness parameters could have resulted in the same predictions. However, in the absence of more observations, it was not possible to evaluate this further.
4.3 Hydraulic effects of structures
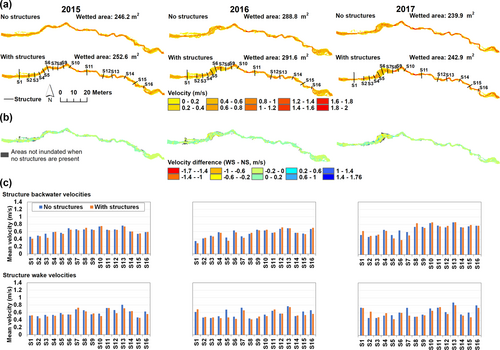
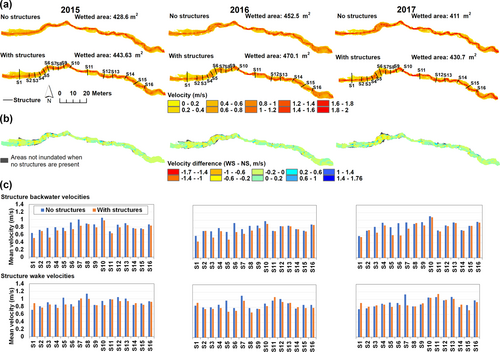
Hydraulic modelling of 50% AEP (Figure 7) and 5% AEP flow events (Figure 8), allows an assessment of the direct effects of LBs over time. For a 50% AEP flow, total inundation extent only slightly changed due to the presence of the LBs for a given year (1–2.5% increase in inundation; Figure 7a, b). Backwater velocities in the presence of structures were reduced by 1.9–4.3% (Figure 7b, c). Mean wake velocities downstream of the LBs were reduced by 4.4–4.6% and compared to backwaters, were lower by 1.2–6.5% (Figure 7c). In comparison to a larger 5% AEP flow, the presence of structures increased inundation extent again only slightly (3.4–4.6%; Figure 8a), but mean backwater velocities were reduced more by 6.3–11.4% (Figure 8b, c). Mean wake velocities were reduced by 1.6–6.8% in the presence of structures (Figure 8c) and compared to backwaters were higher by 12.6–18.1%, indicating accelerated underflow due to the constriction effect of the LBs (Figure 8c).
4.4 Morphological responses
4.4.1 Overall morphological change
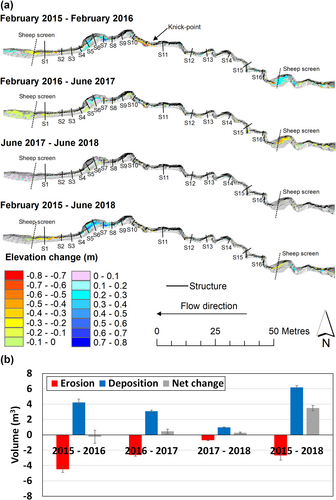
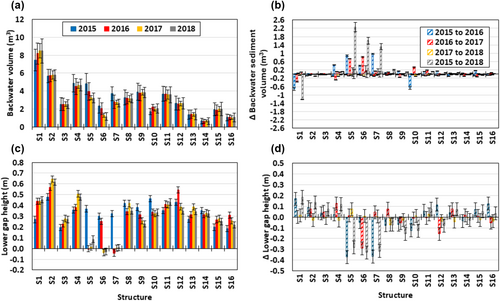
Between 2015 and 2018, a net depositional response of 3.49 ± 0.36 m3 was observed (Figure 9b) following 12 geomorphically significant flow events (Table 4). Deposition responses were most marked within the backwaters of S5, S6 and S7 with erosion responses distributed sporadically throughout the reach (Figure 9a). As a result of channel incision, the lower gap height increased at eight structures but was completely lost due to channel choking at S6 and S7 (Figure 10c, d). Reflecting the reach-scale net deposition response, at 10 of the structures, backwater capacity was reduced (Figure 10a, b), and the total initial capacity (51.68 ± 12.11 m3) decreased by 2.75 m3 (5.33%) to 48.9 ± 9.85 m3.
| Period | Total rainfall (mm)a | R2 peak event water depth (m) | Peak event discharge (m3/s)b | Peak event annual exceedance probability (%) | N peaks > τc D50c | Duration > τc D50 (min) |
|---|---|---|---|---|---|---|
| 11/02/2015–23/02/2016 | 1254.4 | 0.357 (C1, 05/01/2016) | 0.45 | 10 | 5 | 5540 |
| 23/02/2016–08/06/2017 | 1251.33 | 0.390 (22/11/2016) | 0.70 | 3.7 | 3 | 2655 |
| 08/06/2017–30/05/2018 | 934.59 | 0.318 (C3, 03/01/2018) | 0.44 | 10.8 | 4 | 2370 |
- a Rainfall based on Sourhope AWS. See Figure 1b for location.
- b Based on HEC-RAS model predictions 5 m downstream of upstream boundary.
- c τc D50 critical shear stress based on the Shields equation: where ρs is the sediment density (2650 kg/m3), ρ is the water density (1000 kg/m3), τ* is the Shields parameter assumed to be 0.045, a value relevant to coarse bedded channels with a mixture of sizes (Church, 2006), D50 is the median bed sediment size (m) based on 2016 Wolman (1954) walk pebble count observations of the active channel and g is the gravitational acceleration (9.81 m/s2). τc D50 (36.25 N/m2) equivalent to 0.21 m water depth at R2 based on cross-section averaged shear stress modelled in CES, is assumed to be constant in all years and representative of the whole reach.
4.4.2 February 2015 to February 2016
The longest duration and number of flows that exceeded τc D50 were observed during this period (Table 4). A reach scale net erosional response of −0.26 ± 0.04 m3 was observed. The largest deposition (2.98 ± 0.04 m3; Figure 9a was associated with the upper sheep screen (Figure S1a). Morphological changes associated with the LBs, in most cases, however, were limited. Backwater sediment deposition was associated with structures S4 to S7, where depositional volumes of up to nearly 1 m3 were observed for each structure (Figure 10a). This deposition completely choked the channel (Figure 9a) and lower structure gap in the case of S7 and S6 (Figure 10c) where overbank deposition also occurred (Figure 9, Figure S1a). This, in turn, reduced backwater storage capacity, especially at S5 and S7 (Figure 10b). The sediment captured by S4 to S7 was at least in part sourced from the eroding banks of the knick-point between S10 and S11, where 1.14 ± 0.1 m3 of sediment was injected. Within the alluvial fan towards the end of the reach, channel incision of up to 0.5 m was the dominant response with erosion of 0.72 m3 of material in the backwater of S1 (Figure 9a), resulting in a slight increase in storage capacity (Figure 10b).
4.4.3 February 2016 to June 2017
Three geomorphically significant flows occurred during this period (Table 4), resulting in a reach-wide net deposition response of 0.45 ± 0.01 m3. Erosion was associated with 2.03 ± 0.08 m3 of sediment lost from upstream of the upper sheep screen, localised low magnitude (<0.1 m) stream bed incision throughout and erosion of the alluvial fan (2.66 ± 0.01 m3 of material) towards the outlet (Figure 9a; Figure S1b). Localised bank retreat of <0.3 m was also observed. In relation to the LBs, significant backwater deposition of over 0.7 m3 occurred at S5 and S6 (Figure 10A) reflecting the inherited wide, aggraded channel morphology that led to preferential deposition (Figure 9A; Figure S1b; Figure S1c) and maintenance of, or further loss of backwater storage capacity (Figure 10b). Smaller-scale backwater deposition volumes of less than 0.3 m3 were observed at S4, S7, S8, S10 and S11. Erosion responses close to the structures were limited, but lower gap height increased in most cases due to bed incision, especially in the lower reach between S1 and S4 (Figure 10c and d). Backwater erosion volumes adjacent to the structures were small (<0.4 m3) and most prominent at S1, S4, S7 and S9. Minor erosion (<0.3 m3) downstream of the structures was associated with S1 and S5.
4.4.4 June 2017 to June 2018
Four high flows that exceeded τc D50 occurred during the period (Table 4). A small reach-wide net depositional response of 0.27 ± 0.01 m3 was observed, the smallest response over the three-year monitoring period. Minor deposition (0.61 ± 0.002 m3) occured at the knick-point, but in common with other areas outside the influence of the structures, morphological adjustment was small (Figure 9a). Correspondingly, the erosion and deposition volumes associated with the LB structures were also minor (<0.3 m3; Figure S1d), with the greatest responses observed at S1, S4, S5, S6, S7 and S10 (Figure 10). Structure lower gap heights showed a mixed response throughout the reach (Figure 10c and d) whilst backwater storage capacities changed little (Figure 10B). The lack of morphological change reflecting infrequent high flows allowed rapid grass colonisation over the backwater gravel deposits of S4 to S8 (Figure S1d).
4.5 Hydraulic effects of geomorphic responses
Based on hydraulic modelling, comparison between years showed changes in inundation extent were larger due to morphological changes than the direct hydraulic effect of LBs. Channel deposition most notably in the lower reach (S5-S7) and at the upstream sheep screen, between 2015 and 2016 (Figure 9a), resulted in an increase in inundation extent for the 50% AEP flow of 13.4% (Figure 7a) and smaller increase of 5.6% for the 5% AEP flow (Figure 8a). By reducing in-channel water depths, the deposition also reduced mean backwater velocities notably for the 50% AEP flow (−10%; Figure 7b) with a smaller reduction for the 5% AEP flow (−4.9%; Figure 8b). Mean velocities downstream of the LBs were reduced by 5.6% and 7.3% for 50% and 5% AEP flows, respectively, again reflecting in-channel deposition.
Over 2016 to 2017, inundation extent decreased by 20% for the 50% AEP flow (Figure 7a) but by a smaller decrease of 9% for the 5% AEP flow (Figure 8a. Backwater velocities increased by 13% for the 50% AEP flow (Figure 7a) and 10% for the 5% AEP flow (Figure 8b). Velocities downstream of the structures increased over this period by 8.4% and 8.1% for 50% and 5% AEP flows, respectively. The changes in inundation and velocities from 2016 to 2017 reflected localised channel incision throughout the reach (Figure 9a) that increased conveyance capacity. However, the wider inundation and reduced velocities persisted at S5, S6 and S7.
4.6 Controls on geomorphic responses
Mixed model analysis following initial MLR analysis to reduce the number of covariates (Table S4 and Table S5), showed that none were statistically significant for explaining backwater net volumetric change (Table 5). This indicates differences in sediment backwater deposition between locations could not be explained by the covariates. In contrast, for gap height change, the same covariates selected in the MLR (Table S6) remained statistically significant in the mixed model results, with no change in the overall results (Table 5) as the variance component for location was 0.
| Dependent variable | Parameter | Estimate | Standard error | Df | t | F | p value |
|---|---|---|---|---|---|---|---|
| Backwater_net_ volumetric_change | Intercept | −0.014 | 0.115 | 25.40 | −0.129 | 0.017 | 0.898 |
| Channel_XS_area | 0.219 | 0.135 | 9.92 | 1.623 | 2.635 | 0.136 | |
| Gap height | 0.089 | 0.332 | 34.54 | 0.268 | 0.072 | 0.790 | |
| Gap_height_change | Intercept | 0.098 | 0.052 | 44 | 1.906 | 3.63 | 0.063 |
| Channel_slope | −0.032 | 0.014 | 44 | −2.055 | 4.96 | 0.031 | |
| Channel_XS_area | −0.077 | 0.035 | 44 | −2.227 | 4.88 | 0.032 | |
| Backwater_mean_peak_shear_stress | −0.001 | 0.0005 | 44 | −2.209 | 4.22 | 0.046 |
5 DISCUSSION
5.1 Hydrological and hydraulic effects of leaky barriers
The LBs had no statistically significant effect on flood peak travel speeds and hydrograph rate of stage rise or fall based on 22 selected high flow events over 3 years. Although direct observation of peak discharge attenuation was not possible, this suggests a limited flood risk mitigation impact for both frequent (i.e. >50% AEP) and larger (i.e. <50% AEP) flows. Thus, in relation to the first goal of delaying and attenuating flood peaks, the project was not successful.
Modelling showed the direct hydraulic effects of the LBs were also limited, but the magnitude of the effects is dependent on the size of the event. Across all years, the presence of LBs had a limited impact on backwater velocities, downstream velocities and inundation extents during 50% AEP events, but effects were greater during 5% AEP events due to more engagement of flow with the structures.
The magnitude of hydraulic effects generated by LBs depends on both the structure geometry and placement locations within a reach. Previous flume-based studies have highlighted the importance of the channel cross-sectional blockage ratio (Davidson & Eaton, 2013; Gippel, Finlayson, & O'Neill, 1996) and wood volume or the jam accumulation factor, CA and the gap height (Follett & Hankin, 2022; Muhawenimana et al., 2021) for governing backwater afflux and hydrodynamic drag. Maximising channel blockage with larger volumes of wood to generate higher CA and narrower lower gaps, create higher backwater depths relative to unobstructed channel depth, translating into reduced outflow peak magnitudes and increased time delays (Follett & Hankin, 2022). Structure spacing may have also affected the hydraulic performance of the LBs in the current study. Firstly, theshortened backwaters truncated by adjacent structures as occurred in ten cases, limited storage capacity. Secondly, the effective resistance generated by channel-spanning log jams is maximised when they are uniformly spaced to prevent backwater truncation by upstream jams (Follett & Wohl, 2024). The close proximity of ten LBs on the Elm Sike may have, in turn, further reduced the potential to attenuate and delay flood peaks.
The direction and magnitude of hydrological impacts are also dependent on the location within a catchment. At the intervention site, catchment area, channel gradient and availability of floodplain inundation zones are important factors that can determine impact at a catchment outlet (Dixon et al., 2016; Hankin et al., 2021; Quinn et al., 2022). Catchment scale hydrological modelling has shown that the discharge attenuation impacts of ELJs were both negative and positive, but only detectable at channel gradients lower than 0.005 m/m (Dixon et al., 2016). Modelling shows how backwater extent and depth in response to LBs depends on channel gradient Follett & Hankin (2022); of three sites with gradients of up to 0.021 m/m, the greatest outflow delay was observed for the site with the lowest gradient of 0.0019 m/m due to greater backwater length and storage. Nonetheless, in a Pennine stream with a higher channel gradient to the Elm Sike, where eight LBs were added, peak discharge was reduced on average by 10% for events with an AEP of ≤100% (van Leeuwen et al., 2024; Table 1). This suggests that appropriately designed and spaced LBs with lower gaps can mitigate flood peaks in steep catchments at scales less than ~1 km2, but only smaller, frequent events.
Case studies of low gradient streams with associated floodplains suggest greater potential for storage and, in turn, discharge attenuation. Keys et al. (2018) showed using hydraulic modelling that inundation depth and area increased by 33% and 34%, respectively, due to the addition of three large wood structures in a low gradient reach (Table 1). This resulted in a decrease in maximum thalweg velocities of 10% and an 8% reduction in discharge for a flood that occurs multiple times per year. Norbury et al. (2021) showed at a catchment scale of 0.72 km2, the installation of five willowed engineered log jams that crossed a floodplain created ~3,000 m3 of potential storage (Table 1) in contrast to 51.68 ± 12.11 m3 provided by the Elm Sike LBs . This, on average, reduced a range of peak flows by 27.3%, emphasising the importance of sufficient storage volume relative to catchment area to ensure effectiveness.
5.2 Geomorphic responses
Over three years, a reach scale net depositional response of 3.49 ± 0.36 m3 was observed, and the total LB backwater storage capacity decreased by 5.3% to 48.9 ± 9.85 m3. However, annual differences in geomorphic response related to the variable flood regime occurred. The greatest change occurred over 2015–2016, consistent with previous studies that show longer duration floods are associated with the greatest morphological change (Leenman et al., 2023). During this period, floods up to 10% AEP occurred in January 2016 that exceeded τꚍc D50, resulting in the most extensive and highest magnitude erosion and deposition with a small net erosional volumetric change measured. However, thereafter, morphological changes were smaller and net depositional. The decline in morphological responses over time indicates system recovery as the reach responded to a declining duration of geomorphically significant flows (cf. Milan, 2012). The changing nature of the reach gains or losses of sediment observed over annual timescales, highlights the variable morphological response in such high-energy streams that can alter the functions of LBs.
Despite the morphological changes and high flows documented, all structures remained in place over the three years, reflecting the anchoring used, which was sufficient for the size and power of the stream. LBs in energetic streams are prone to displacement and failure (Lo et al., 2022). Consideration of structure stability is important to ensure the structures function and persist as planned. It is also important for mitigating against the risks of flash flooding generated by sudden structure failure (Hankin et al., 2020).
Geomorphic responses adjacent to the LBs at the end of three years of monitoring were variable. Due to channel incision, the lower gap height increased at eight structures and at ten of the structures backwater capacity was reduced due to deposition. However, cumulative channel choking and overbank deposition leading to a progressive loss of backwater capacity that persisted over the three years, was concentrated only at S5, S6 and S7. This suggests only three of the structures were successful in addressing the second project goal of capturing and retaining sediment.
Mixed model analysis showed that backwater shear stress, channel cross-section area and channel slope were statistically significant explanatory variables that were inversely related to gap height change. Previous research has shown that scour beneath and immediately downstream of LBs is related to flow acceleration and shear stress caused by the restriction on flow (Muhawenimana et al., 2021, 2023; Spreitzer, Tunnicliffe, & Friedrich, 2021). These observations are broadly consistent with the aforementioned controls on the Elm Sike. Bed grain size, unit discharge and wood volume are also important controls on bed scour associated with channel-spanning wood structures (Schalko et al., 2019); analysis of these other potential controls may yield further insight into bed scour variability.
In contrast to lower gap height change, no topographical, hydraulic or structure geometry factors could explain backwater net volumetric responses. This was surprising as previous research has shown the importance of factors such as lower gap height (Lo et al., 2022) and degree of channel blockage (Davidson & Eaton, 2013; Gippel, Finlayson, & O'Neill, 1996) as key controls on backwater ponding and in turn morphological responses to in-channel large wood. Previously, the cascade effect of multiple LBs causing sediment starvation has been suggested to result in reduced sediment deposition at downstream structures (Lo et al., 2022). However, perhaps due to the limited blockage effect of the upper structures, this response was not observable as distance downstream was not a statistically significant covariate in either the MLR or mixed model analyses. Moreover, variable rates of bedload sediment supplied to, and generated within the reach, which cannot be accounted for and less geomorphically significant events following the highly active 2015–2016 period, may have limited the potential for significant backwater effects. This, in turn, could have limited the detection of any significant explanatory controls on backwater deposition.
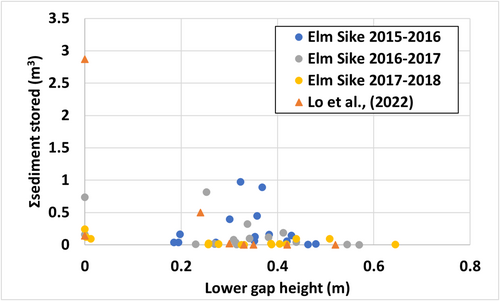
Lo et al. (2022) found that the greatest and most persistent sediment storage was associated with two LBs that had lower gap heights of ≤0.3 m (Table 1; Figure 11). At one structure after two years, deposition of 2.77 m3 was observed. In comparison to the Elm Sike, the maximum storage for any structure over a year was 0.97 m3, and the threshold lower gap height for significant sediment storage was around ≤0.4 m. Both studies suggest a maximum lower gap of ~0.3–0.4 m or lower is required to capture coarse sediment, or as a minimum to ensure passage of flow.
5.3 Effects of geomorphic change on hydraulics
Hydraulic modelling showed that appreciable geomorphic change forced by the structures where it occurred had a greater indirect effect on channel hydraulics than the direct effect of the LBs. Channel choking (S5, S6 and S7) increased inundation extent and reduced velocities, most notably for 50% AEP flows, effects that persisted throughout the three years. Depending on the aims of a particular LB project, loss of backwater capacity and lower gap through deposition could be negative in terms of water storage capacity directly offered by LBs and may require remedial sediment management to restore capacity. However, loss of channel capacity may be offset by the improved floodplain hydrological connectivity (Spreitzer, Tunnicliffe, & Friedrich, 2021). Improved connectivity can result in significant hydro-ecological changes (Brummer et al., 2006) and, through temporary storage or flow deceleration over hydraulically rough overbank areas, potential attenuation of peak flows.
Changes in channel geometry underneath the structures observed also have hydraulic implications and emphasise the temporally variable nature of LB functioning. Overall mean lower gap height was reduced, and a complete loss of lower gaps occurred in certain years for structures S5, S6 and S7. Such changes in lower gap height could have implications for underflow velocities, drainage rates of temporary storage areas (Roberts et al., 2024), the magnitude of backwater rise (Muhawenimana et al., 2023) and in turn attenuation of flows. Further analysis of these factors could give further insights into the temporal variability of LB hydraulic functioning.
5.4 Implications for leaky barrier design, placement and maintenance
Whilst the findings are location-specific, they have potential implications for the implementation of LBs for flood risk mitigation and river restoration goals. Empirical evidence shows peak flow attenuation is possible in steep channel settings (van Leeuwen et al., 2024) but the limited delay responses observed, and findings from other studies (cf. Black et al., 2021; Hankin et al., 2021; Norbury et al., 2021), suggests low gradient (<0.01 m/m) headwater channels coupled with floodplains that offer expandable storage should be prioritised for LB addition. Structures should also be sized to maximise CA and uniformly spaced with no intersection of backwaters by adjacent upstream LBs to maximise both storage and flow resistance.
In addition, the design of structures and placement in a catchment also needs to consider the peak flow of concern to target, the storage capacity required and the retention time to ensure effectiveness (Chappell & Beven, 2024). These aspects were not considered in relation to the Elm Sike LBs. Although catchment specificity needs to be considered, designing NBS features that provide 1000 m3/km2 coupled with 2 hours of retention time on either side of the peak has been suggested to attenuate 1 year recurrence interval floods in managed grasslands (Chappell & Beven, 2024). Based on a synthesis of offline pond studies, a storage capacity of at least 2000 m3/km2 is required to reduce peak flows by >10% for events with an AEP of up to 1% (Roberts et al., 2023). By contrast, the Elm Sike LBs delivered a maximum water storage capacity of 156.6 m3/km2. LB hydraulic modelling tools (Follett & Beven, 2023; Geertsema et al., 2020) enable a priori, the optimisation of LB design and placement within a catchment.
Morphological changes initiated by LBs need to be considered during design and anticipated to inform any management actions following construction, depending on project goals. For example, by applying the lower gap threshold of ≤0.4 m, LBs could be located to capture coarse sediment to reduce or delay its transport downstream, but sediment removal may be needed to maintain full backwater capacity. Furthermore, such a threshold could be applied to improve stream-floodplain hydrological connectivity, which may be a goal of both floodplain restoration and flood management initiatives. However, more research is required to elucidate the controls on backwater deposition in relation to variations of catchment size, sediment supply regime and LB geometry.
This study showed variable changes in lower gap height that could also have implications for fish movement. Structure porosity rather than velocities has been observed in a controlled flume environment to have a greater effect on fish passage (Müller et al., 2021). Deposition resulting in smaller lower gaps could result in accelerated flows that are less passable by fish and other biota, presenting a barrier during high flow events. In such cases, management actions may be required to restore the lower gap height to ensure passage.
6 CONCLUSION
This study assessed the effects of 16 LBs in a steep headwater stream over three years. Although the monitoring was limited by the short timescale and lack of before-intervention monitoring, it gives a rare insight into both the hydrological and geomorphic effects of wooden LBs featuring lower gaps.
Based on observations of 22 flow events, the LBs had no significant effect on peak flow travel speed and event scale stage dynamics. Hydraulic modelling of 5% AEP peak flows showed the structures increased inundation extent only slightly by up to 5.1% and reduced backwater velocities by up to 11.4%. The limited hydrological and hydraulic impacts are related to the steep, confined stream setting and relatively small structures that limit water storage capacity and flow resistance.
A reach-scale net deposition response was observed, leading to a 5.3% decrease in overall LB water storage capacity, but local geomorphic responses were variable after three years. At eight of the structures, the lower gap increased due to bed scour. Changes in gap height could be explained by backwater shear stress, channel cross-section area and channel slope. In contrast, at 10 of the structures, backwater capacity was reduced due to bedload trapping, but significant deposition was concentrated at only three structures. Analysis of explanatory variables did not detect any statistically significant controls on backwater geomorphic response. These morphological responses were found to locally create greater changes in velocities and inundation extents than the direct hydraulic effect of the structures, especially for 50% AEP flows.
The following key recommendations for the design of LBs are made. Firstly, prioritising lower gradient (<0.01 m/m) low-order streams that contain floodplains with sufficiently large and appropriately spaced structures to maximise storage and flow resistance is more likely to have a greater hydraulic impact. Secondly, by applying available modelling tools, a priori optimisation of structure design and location within a catchment to maximise floodplain storage and roughness would improve resulting effectiveness. Lastly, morphological changes initiated by structures should be considered due to the potentially desirable or undesirable hydraulic effects, which locally can be more significant than the direct hydraulic effect of the structures. A lower gap height of ≤0.4 m is required to initiate backwater deposition, which may be a useful approximate guide for practitioners who aim to either maximise or minimise the capture of coarse sediment. However, further research is required to understand controls on backwater deposition in different contexts.
ACKNOWLEDGEMENTS
Helen Watson, Yvonne Cook, Carol Taylor and Dave Riach are thanked for assisting with field data collection and checking. Lo Ho Wen Owen (Chinese University of Hong Kong) is thanked for supplying data included in Figure 11. Jackie Potts and Nick Schurch (Biomathematics and Statistics Scotland) are thanked for giving statistics advice. We are grateful to Roxburghe Estate and Jimmy and Peggy Thompson of Kelsocleuch farm for granting access. Sourhope rainfall and Rowantree Burn discharge data were provided by the UK ECN. Tweed Forum installed the leaky barriers. Hugh Chalmers (Tweed Forum) and Tracy Hall (Cheviot Futures) are thanked for their cooperation. We are grateful for the comments from two anonymous reviewers that helped to improve the manuscript.
CONFLICT OF INTEREST STATEMENT
The authors confirm there are no conflicts of interest in relation to this paper.
Open Research
DATA AVAILABILITY STATEMENT
Hydrological and geomorphic data are available on request. Parameters for the leaky barriers in MS Excel spreadsheets are available on Zenodo (https://zenodo.org/records/14003040).


