Modelling the impact of trenches on soil erosion control using OpenLISEM on Mount Elgon, Uganda
Abstract
Soil erosion, accelerated by anthropogenic activities, is a major driver of land degradation, resulting in the removal of fertile soil, humus and organic matter. On the steep slopes of the densely populated Mount Elgon region (Uganda), several soil and water conservation (SWC) measures, such as trenches (fanya juu/fanya chini), are adopted to counteract this challenge. Despite the adoption of SWC measures, soil erosion persists and the effectiveness of these interventions remains unassessed. This study characterises trenches in the upper Manafwa catchment, simulates their impacts on erosion and introduces a novel approach to integrating sub-grid structures through enhanced micro-depression storage. Trench dimensions were established through field surveys, and their impact on erosion at a sub-catchment level was evaluated using the hydrological and soil erosion model OpenLISEM. Because the actual trenches are (much) smaller than the DEM resolution used, trenches were parameterized by readjusting the random roughness of agricultural areas as a proxy to include micro-depression storage as provided by trenches in the field. Two likely future scenarios were considered: (1) no trenches (or abandonment of trenches) in any of the agricultural fields, and (2) implementation of trenches in all agricultural fields. This was compared with the current situation of the Ukha sub-catchment, where about 62% of the agricultural area has trenches. The field surveys revealed that trenches were mostly established on contour lines and the dimensions varied substantially, averaging 3 m in length, 0.7 m in width and 0.5 m in depth. Model simulations, calibrated against measured hydrograph data, estimated that non-adoption or abandonment of trenches (scenario 1) led to a 75.97% increase in runoff and a 35.12% increase in soil loss for the simulated rainfall event. In contrast, adopting trenches in all agricultural fields (scenario 2) reduced runoff by 40.45% and soil loss by 33.81% as compared to the current situation. Fostering the widespread adoption of trenches is therefore recommended for sustainable land management, reducing erosion and for ecosystem conservation in the Mount Elgon region.
1 INTRODUCTION
Water-induced erosion, leading to the loss of fertile topsoil and organic matter, is widely reported as a major form of land degradation (Guo et al., 2019; Wolka, Mulder, & Biazin, 2018). Soil erosion through runoff and sediment detachment is influenced by various factors and is highly variable across time and space (Grum et al., 2017). Soil properties, topography, rainfall intensity, soil moisture and land management practices are key determinants of soil erosion at a catchment level (de Barros et al., 2021; Grum et al., 2017). Previous studies have examined the influence of these factors on erosion (Cuomo, Della Sala, & Novità, 2015; de Barros et al., 2021). Although soil erosion is a natural process, recent studies show that agricultural activities have pushed erosion rates beyond the tolerable annual average rate (Ebabu et al., 2023; Karamage et al., 2017). In sub-Saharan Africa, where subsistence farming is the primary livelihood for many households, soil erosion is particularly severe (Wolka, Mulder, & Biazin, 2018; Zegeye et al., 2010). Increased land pressure, driven by high population growth, the conversion of forest land to arable land and unsustainable farming practices, has accelerated soil erosion (Grum et al., 2017; Hessel, van den Bosch, & Vigiak, 2006).
Soil and Water Conservation (SWC) measures are commonly used to mitigate erosion on agricultural lands (Ebabu et al., 2023; Hessel, van den Bosch, & Vigiak, 2006). Specific SWC measures reported in Africa include sediment trapping (Mekonnen et al., 2015; Wolka, Mulder, & Biazin, 2018), water harvesting (Grum et al., 2017) and trenches (fanya juu and fanya chini) (Ebabu et al., 2023; Hessel & Tenge, 2008). Fanya juu involves digging a trench along the contour line and piling the soil upslope to form an embarkment while fanya chini, involves throwing soil downslope (Ngigi, 2003; Wolka, Mulder, & Biazin, 2018). Trenches reduce surface runoff by slowing down water movement and enhancing soil moisture retention, essential for crop productivity in erosion-prone areas (Wolka, Mulder, & Biazin, 2018). Additionally, the presence of trenches supports vegetation growth, stabilizing the soil and reducing the likelihood of future erosion events (Morgan, 2005). These measures have been reported to reduce erosion rates both on-site and off-site (Semalulu et al., 2012; Wolka, Mulder, & Biazin, 2018). Sediment detachment and transport are reduced due to the impact of SWC measures, which store excess runoff, increase infiltration and trap sediments (Grum et al., 2017; Hessel & Tenge, 2008). The effectiveness of SWC measures has been measured through field and laboratory experiments at plot scale (Ebabu et al., 2023; Smets et al., 2011). The effect of SWC measures on erosion control at the catchment scale is more difficult to determine due to the interaction of various factors and the contribution of runoff and sediment from various sources. Soil erosion models were originally developed and applied to simulate runoff and sediment detachment at a wider scale (Guo et al., 2019).
Empirical, conceptual and physically-based models have been used for rainfall-induced soil erosion studies and incorporated erosion control measures with routine updates on the models (Cuomo, Della Sala, & Novità, 2015; Hessel & Tenge, 2008). Few studies have quantitatively assessed the impact of trenches on soil erosion at a catchment scale. For example, the impact of trenches on erosion control was assessed using soil loss data from large runoff plots in Ethiopia (Taye et al., 2018), while calibrated SWC factor values, including fanya juu trenches, were applied for catchment modelling in Mount Kenya (Hessel & Tenge, 2008). Empirical models like the Revised Universal Soil Loss Equation (RUSLE) identify source areas of soil erosion, predict soil loss on agricultural fields, and can provide estimates over large areas (Bamutaze et al., 2021; Guo et al., 2019). However, empirical models often fail to fully capture the dynamics of erosion, particularly transport and deposition (Cuomo, Della Sala, & Novità, 2015). In RUSLE, the Practice (P) factor represents the effectiveness of SWC practices like trenches, with values ranging from 0.0 (effective) to 1.0 (minimal or no measures) (Bamutaze et al., 2021). Conceptual models like AGricultural NonPoint Source (AGNPS) and Morgan-Morgan-Finney (MMF), address some limitations of empirical models at the catchment scale but still struggle to represent complex process interactions (Cuomo, Della Sala, & Novità, 2015; Morgan, 2001).
Unlike empirical and conceptual models, physically-based models can better represent soil erosion processes and the impact of SWC practices as control measures at the catchment scale. Examples of such models include; the European Soil Erosion Model (EUROSEM) (Smets et al., 2011), Pan-European Soil Erosion Risk Assessment (PESERA) model (Baartman et al., 2022; Kirkby et al., 2008) and the Limburg Soil Erosion Model (OpenLISEM) (Baartman et al., 2012; Bout & Jetten, 2018). These models have been applied to quantify the effect of specific SWC measures on reducing erosion. Hessel & Tenge (2008) simulated with LISEM the effect of several SWC measures with results indicating a 28% and 60% reduction of runoff and erosion, respectively, in the Gikuuri catchment, Kenya. In the Gule catchment, the LISEM model simulated a 41% reduction in runoff and a 61% decrease in sediment concentration, attributed to the implementation of existing water harvesting technologies (Grum et al., 2017). Knowledge of integrating sub-grid SWC measures into erosion models is limited. While these models have advanced our understanding of SWC impacts, incorporating trench-specific data into OpenLISEM will offer more detailed insights into erosion control in complex highland terrains due to its ability to represent high-resolution catchment dynamics and SWC measures. Evaluating trench effectiveness at a catchment scale is essential to develop scalable solutions for soil conservation, particularly in regions where small-scale practices need to be adapted for wider application. Understanding the catchment-wide effects of trenches is critical for scaling up SWC efforts and improving land management practices.
Mount Elgon is a volcanic mountain with steep slopes, supporting rainfed agriculture and hosts a high population density in Uganda. Studies in the Mount Elgon region have emphasized erosion to be beyond the acceptable natural annual rates of 10 t/ha for tropical regions (Karamage et al., 2017). As a result, crop yields decline, and other land degradation processes accelerate. Farmers have subsequently adopted SWC measures to minimize erosion. Although there have been several SWC measures adopted by farmers, none of these measures are distributed across the entire catchment (Bamutaze et al., 2021). This study focused on trenches since this was the most adopted measure by farmers trained through restoration projects and programmes like the Participatory Integrated Plan (PIP) (Misanya et al., 2023), Caritas Uganda and Kyagalanyi coffee processing company. The effect of trenches on soil erosion reduction has not been evaluated at the catchment scale. However, the trenches in the study area are small with inconsistent dimensions across the catchment and are not adopted by all farmers due to small farm size, and limited knowledge (Misanya et al., 2023). This study addresses this gap by modelling the effectiveness of trenches on erosion control in the upper Manafwa catchment using OpenLISEM.
Despite the advancements of physically-based models like OpenLISEM in simulating SWC measures, they face limitations in accurately representing fine-resolution trench dimensions in complex terrains like Mount Elgon, due to the coarse resolution (12.5 or 30 m) of available Digital Elevation Models (DEM). The steep slopes and varied topography of Mount Elgon further complicate the effectiveness of trenches, as runoff patterns are more unpredictable compared to those in flatter terrains. This study evaluated the effectiveness of trenches as an erosion control mechanism in the upper Manafwa catchment, using the OpenLISEM model. The specific objectives were to: (i) identify the locations, dimensions and characteristics of trenches in the upper Manafwa catchment; and (ii) simulate their effect on erosion at a catchment scale using the OpenLISEM model by (iii) testing a novel way of incorporating these small-scale, sub-grid structures into the model through enhanced storage in micro depressions. This research contributes to a better understanding of trench effectiveness in erosion-prone regions and provides valuable insights for scaling up soil conservation efforts in areas like Mount Elgon.
2 RESEARCH AREA
2.1 Overview of the study area
The study area is the upper Manafwa catchment, covering an area of 168 km2 in Bududa District, Eastern Uganda (Nakileza & Nedala, 2020). The upper Manafwa catchment is situated between latitudes 00°58′48” N; 01°06′48” N and longitudes 34°21′47″ E; 34°31′15″ E on the slopes of Mount Elgon (see Figure 1a). The altitude ranges between 1,288 and 4,226 m above sea level with steep slope gradients, rising up to 180% in some locations (Bamutaze, 2019).
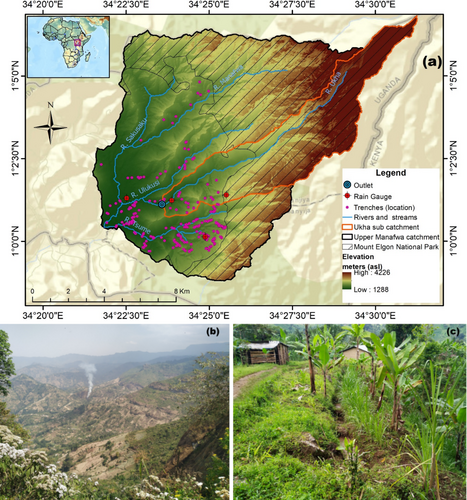
The study area is underlined by the basement complex of conglomerate and agglomerate rocks with isolated volcanic plugs and dikes (Nakileza & Nedala, 2020). The hillslopes and valleys are rectilinear and sharply dissected due to the relief and geology of the area (Figure 1b). Soils are of volcanic ash origin with ferralsols and nitisols characterized by fine- to medium-textured soils with high silt and clay content (Bamutaze et al., 2021). River Manafwa is the main river stream with Sakusaku, Ulukusi, Ukha and Tsume as tributaries (Nakileza & Nedala, 2020). These river streams constitute five sub-catchments of the upper Manafwa. OpenLISEM modelling was conducted in the Ukha sub-catchment (see Figure 1a) due to data limitations for the entire upper Manafwa catchment.
The area experiences a humid subtropical climate with bimodal rainfall occurring annually in March–April–May (MAM) and September–October–November (SON) rainy seasons, totalling approximately 1,500 mm, and an average temperature of around 23°C (Vlaeminck et al., 2016). The vegetation of the study area follows altitudinal zonation, with tropical forest, bamboo, afro-montane vegetation, heath and moorland and bare rock found around 2000 m in the conservation area, while perennial crops dominate at lower altitudes (Sassen, Sheil, & Giller, 2015). Mount Elgon National Park (MENP), covers the higher altitudes (above ~2000 m) of the study area under the management of the Uganda Wildlife Authority (Vlaeminck et al., 2016). Human settlements and agriculture dominate the lower slopes of the study area with banana-coffee as dominant perennial crops (Figure 1c). Intercropping with annual crops like maize, beans and vegetables planted during the rainy season (Bamutaze et al., 2010; Opedes et al., 2022). The Manafwa catchment is densely populated with settlements spread on hillslopes, crests and valleys, reaching up to 850 persons/km2 (Bamutaze et al., 2021).
The land use types in the upper Manafwa catchment are illustrated in Figure 2. These include tropical high forest well-stocked (32%), agriculture (26%), tropical high forest low-stocked (12%), planted forest (9%), grassland (9%), bare & sparsely vegetated surfaces (6%), bushland (3%), built-up area (2%) and shrubs (1%). A detailed description of land use land cover types can be found in Supplement S1. Natural vegetation cover mostly exists in the protected conservation area (MENP), while there is low cover outside the park due to farming activities, especially in the dry season (December–January–February), hence more erosion (Opedes et al., 2022).

3 DATA AND METHODS
3.1 Characterization of trenches
Agricultural land with trenches was mapped in the upper Manafwa catchment using handheld GPS (Trimble TDC600) during field surveys in 2022 (see Figure 1). The number of trenches in each field and their condition was established as well as the cropping system. Drone orthomosaic data from Opedes et al. (2023) was also used to complement field measurements. Figure 2 (a) shows the land use land cover of the Ukha sub-catchment and sampling sites for modelling. Field measurements were not possible across the entire catchment due to the catchment size, nature of the steep terrain, weather conditions and time constraints. Nonetheless, key informant interviews were conducted with field extension staff to establish areas (villages) where farmers had dug trenches in their fields, especially in areas not visited. The dimensions (length, width and depth) of the trenches were determined using a measuring tape. The slope angles of the fields with trenches were measured using a handheld Suunto (PM-5/360 PC) Clinometer. Trenches within the agricultural land were plotted in ArcMap (Version 10.8.1) to create a point representation. Kriging interpolation was employed to obtain a new land use class “agriculture with trenches” within the “agriculture” land use class seen in Figure 2 (b). A distinction was therefore made between “agriculture (trenches)” and “agriculture (no trenches)” to differentiate areas with and without trenches, respectively. This was used to model the effect of trenches in reducing soil erosion at a sub-catchment scale.
3.2 OpenLISEM model description
The OpenLISEM model (Version 6.883) was used to simulate runoff and soil erosion during and immediately after a rain-event at the catchment scale (Baartman et al., 2012). OpenLISEM, (originally LISEM) is a physically-based hydrological and erosion model that was first developed and applied in South Limburg (De Roo, Wesseling, & Ritsema, 1996) and is continuously being developed (de Barros et al., 2021). Figure 3 illustrates the model operation steps and required input parameters. The principles of OpenLISEM model have been comprehensively described by Baartman et al. (2012), and Bout & Jetten (2018).
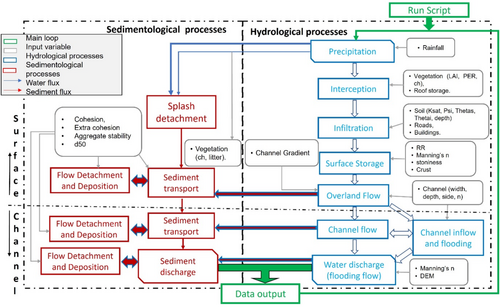
OpenLISEM is a raster-based model that has been applied for erosion studies in small and medium-sized catchments, for instance, in southern Spain (Baartman et al., 2012), southern Brazil (de Barros et al., 2021), Kenya and Tanzania (Hessel, van den Bosch, & Vigiak, 2006). The model has also been applied in the planning and evaluation of erosion control measures in Kenya (Hessel & Tenge, 2008) and northern Ethiopia (Grum et al., 2017). Although discrepancies have been observed between the model output and empirical observations (Guo et al., 2019), OpenLISEM has been reported to provide accurate results (Cuomo, Della Sala, & Novità, 2015; Hessel, van den Bosch, & Vigiak, 2006). Rainfall is the initial input for the hydrological processes (de Barros et al., 2021). The model requires a Digital Elevation Model (DEM), land use maps and measured parameters as basic data of the catchment (see section 4.2 and Supplement S2). Vegetation reduces the amount of rainwater that reaches the soil surface while splash detachment occurs on bare surfaces. In this study, the 2D Dynamic Wave for overland flow option was used.
3.3 Input data and its acquisition
OpenLISEM input parameters were measured in the upper Manafwa catchment in February–August 2021 and October – December 2022. The rainfall was measured using two gauging stations (see Figure 1a) installed within the study area, of which three purposely installed for this study. Rain intensity was measured at 10-minute intervals using a Campbell (precision: 0.2 mm) tipping rainfall bucket. A land use map (30-m resolution) from Opedes et al. (2022) was used to determine the number of measurements and sample locations. This more detailed land use map was preferred over using the geological and soil maps of the study area, as the geological and soil maps of the study region have a coarse resolution and only show 3 classes across the study area (Isabirye et al., 2004; Schumann et al., 2015). The sample locations depended on the accessibility, given the nature of the landscape and the existence of the National Park at higher elevations with dense canopy as seen in Figure 1b. About 30 locations were visited for field measurements, and soil samples for laboratory analysis (see Figure 2).
- The Leaf Area Index (LAI; m2/m2) was calculated from the Normalized Difference Vegetation Index (NDVI) map of 2020 and estimated using the formula from Hasegawa et al. (2010):
- Vegetation cover (PER): The fraction of vegetation cover was estimated in triplicates per measurement site using a 1-m2 square. The average of the three estimates per measurement site was taken.
- Vegetation height, CH (m): Average height of dominant vegetation species on each measurement location, measured with measuring tape. The height of trees was estimated using the clinometer method and the trigonometry.
- Litter: The thickness of litter was estimated in triplicate on each measurement location using a 1-m2 square. The average of the three measurements was used.
- Random roughness, RR (cm): The standard deviations of the micro-relief (mm), measured in the field with a pinboard and photographs analysed using pmpproj.exe (Baartman et al., 2012).
- Stone cover: The stone cover fraction was estimated in triplicate on each measurement location using a 1-m2 square. The average of the three estimates per measurement site was used.
- Initial soil moisture (θi): Field measurement using handheld Soil moisture set SM150T with HH150 meter (Eijkelkamp field measuring equipment, The Netherlands). The average of three estimates per measurement site was used.
- Ksat (mm/h): Field measurement with a minidisk infiltrometer (Naik & Pekkat, 2022) and converted with the Excel calculation sheet from Meter Group (https://www.metergroup.com/).
- Saturated soil moisture content/porosity (θs): Ring samples (100cm3) were taken from the field using a soil sampling ring kit for laboratory analysis as described by Baartman et al. (2012).
- Soil cohesion (kPa): Field measurements using a pocket vane tester (Eijkelkamp field measuring equipment, The Netherlands); the average of three measurements per measurement site was considered.
- Texture, D50 (μm): Composite soil samples from the field were taken for laboratory analysis at RSV Engineering Group to establish the soil texture. The diameter of soil particles, of which 50% of the sample mass is smaller was calculated following soil texture classes and the equation from Mozaffari, Moosavi, & Dematte (2022).
- Soil depth (mm): The soil depth was estimated by inserting an iron bar into the soil until it reached the impervious layer of the soil profile or hit a hard rock.
Other input parameters were derived from literature with similar land uses in the catchment, including; aggregate stability (Jetten, De Roo, & Guerif, 1998), suction at the wetting front (USACE, 2023), additional cohesion by roots (Adhikari et al., 2013; Comino, Marengo, & Rolli, 2010; de Baets et al., 2008; Hubble et al., 2013; Rossi et al., 2017; Schmidt et al., 2001) and manning's n (Chow, 1959).
3.4 Modelling trenches as erosion control
The effect of SWC measures on reducing erosion can be represented in erosion models. These have been grouped into direct effects (by affecting the model input factors) and indirect effects (by affecting runoff and soil loss) Hessel & Tenge (2008). Simulating the impact of trenches using OpenLISEM poses a challenge. In the context of 2D flow, the elevation of individual (trench) cells in the Digital Elevation Model (DEM) could be lowered to actually include the trenches in the DEM. This approach is not feasible when cell size is comparatively coarse in relation to the scale of the trenches, as is the case in this study (that is; 12.5 m resolution DEM, while trench dimensions are often about 0.5 m wide).
Our study adjusted the micro-depression storage (MDS) to effectively model the storage capacity of trenches in OpenLISEM. OpenLISEM assumes that rainwater not intercepted or infiltrated is initially stored on the soil surface as micro-depression storage before contributing to runoff (Vargas et al., 2021). The micro-depression storage (MDS) is determined based on the random roughness (RR) of the surface.
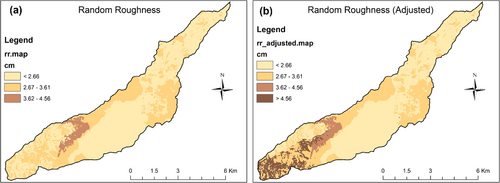
The adjusted random roughness hence ranged from 1.71 cm to 11.13 cm (see Figure 6) as compared to the original values (1.71–4.56 cm). Figure 6 (b) shows the adjusted RR in the Ukha sub-catchment and an R script incorporating this equation is available in Supplement S4.
3.5 Sub-catchment simulation, calibration and scenario analysis
The Ukha sub-catchment (see Figure 1), located in the Eastern part of the Upper Manafwa Catchment and covering 44.5 km2 was used to simulate event-based hydrological processes due to the limitation of calibration data for the entire upper Manafwa catchment. Figure 1(a) shows the drainage system and the location of rain gauges, and the outlet for the Ukha sub-catchment. The spatial data were prepared at 12.5 m pixel resolution, and all simulations were done at time steps of 15 seconds. Surface flow was modelled using 2D dynamic wave and including channel infiltration, while buildings and road systems were also included as infrastructure affecting the hydrological processes. Infiltration was modelled using the 1-layer Green and Ampt method. The rain event used for the modelling occurred on 28th of April in 2022, lasting 5 hours, with a total amount of 18.6 mm and a peak rainfall intensity of 25 mm/h.
With water height (cm), the pressure measured by the diver (cm H2O), the pressure measured by the baro diver (cm H2O), is the density of water (1,000 kg/m3) and the gravitational acceleration (9.81 m/s2).
With the wetted perimeter (m), the bottom width of the channel (8 m) plus twice the water height measured by the diver.
Unfortunately, measurement of sediment concentration was impossible due to the turbulent nature of river streams, and sediment load transported during rain events. In addition, the divers that were installed in the river streams were washed off by the subsequent storms. Therefore, only one rainfall event could be included in the modelling.
The calibration results of OpenLISEM were evaluated using the Nash-Sutcliffe Efficiency (NSE) and Kling-Gupta Efficiency (KGE) coefficients to assess the goodness of fit between the modelled and measured data. The calibration for discharge was performed on peak discharge, total discharge and the timing of the hydrograph and timing of peak discharge. A multiplication factor for saturated hydraulic conductivity (ksat) and Manning's n were used for calibration for both slopes and channels.
To evaluate the effect of trenches on discharge and soil loss, the current land use scenario was simulated. Some farmers adopted trenches in their fields (agriculture with trenches) within the Ukha sub-catchment. This was considered as “Current situation” during model simulations. The current situation was simulated first and calibrated with outlet data. Two additional scenarios were modelled with OpenLISEM as the potential future alternatives regarding the implementation of trenches on the farmers' fields. Scenario 1 represented no trenches in the sub-catchment and farmers were presumed not to maintain/adopt trenches in their fields. Thus, in this scenario, all land use was assumed to not have trenches and the parameterization of the class ‘agriculture (no trenches) was applied to all agricultural fields (i.e. no additional RR was applied anywhere). Scenario 2 considered the future situation of all farmers adopting trenches in the agricultural land. Thus, in this scenario, all agricultural land was assumed to include trenches and was hence parameterized as ‘agricultural land (trenches)’ (i.e. application of additional RR in all agricultural land). The modelling results for discharge and soil loss are presented based on the current situation and these two scenarios.
4 RESULTS
4.1 Characterization of trenches
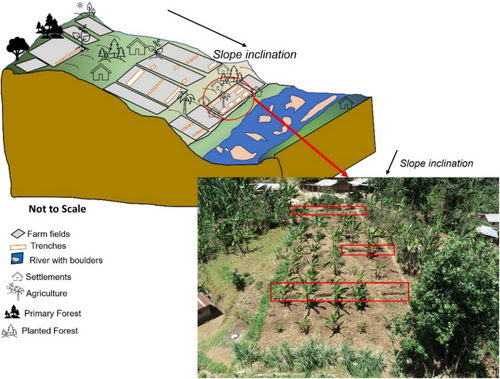
Figure 4 depicts a graphical representation of the location and distribution of trenches in several farms on a hillslope within the study area. The average farm size of the farms surveyed with trenches was 1800 m2 with an average number of three lines of trenches on a farm (details in Table 1 and Figure 4). By slope inclination, 82% of the trenches were located on fields with slope angles of 10° to 30° with an average slope of 15°. However, 15% of the trenches were located on gentle slopes (≤ 9°) while 3% were on very steep slopes (≥ 31°). Specifically, in the Ukha sub-catchment, trenches were established in 62% of the agricultural land while 38% did not have trenches.
| Trenches | Amount |
|---|---|
| Farm size (m2) | 1800 |
| Total number per farmland (on average): | 21 |
| Average length (m) | 3 |
| Average width (m) | 0.7 |
| Average depth (m) | 0.5 |
| Spacing (m) | 0.5 |
| Total volume of the trenches per farm (m3) | 22.05 |
| Total volume per 12.5 m resolution grid cell (m3) | 1.914 |
| Water height on a 12.5 m grid cell (m) | 0.01225 |
- NOTE: Additional information is provided in supplement S3.
Trenches have been established along the contours of hillslopes with varying dimensions. The total number of trenches measured in this study was 198 in the upper Manafwa catchment. Our field surveys in 2022 showed that the average dimensions of the trenches established by farmers were: length 3 m (n = 21), width 0.7 m (n = 36) and depth 0.5 m (n = 51). The average spacing between the lines of trenches was 0.5 m (Table 1). Further, the length of trenches measured was between a minimum of 1 m up to a maximum of 42 m with 58% ranging between 3 m to 10 m. The width of the measured trenches ranged between 0.4 m to 2 m, with 73% ranging between 0.6 m to 1 m. In terms of depth, about 67% of the trenches ranged between 0.4 m to 0.6 m while 20%.
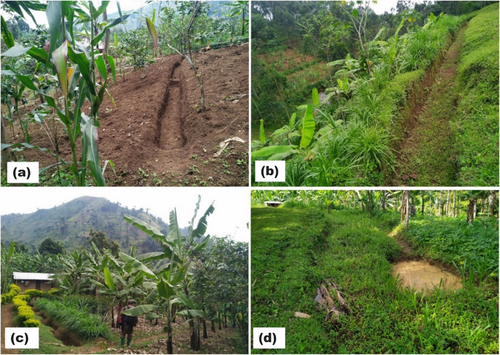
Figure 5 illustrates the diverse types and dimensions of trenches (mostly “fanya chini”) measured in the study area. In the process of establishing trenches along the contour lines, most farmers threw the soil downslope (see Figure 5a), forming a fanya chini trench while some heap the soil upslope to establish a fanya juu trench (see Figure 5d). In some instances, napier grass (Pennisetum purpureum), calliandra (calliandra calothyrsus) is planted along the trench edges to stabilize the trench (see Figure 5b and c). The napier and calliandra were frequently harvested and used as animal feeds by the farm owners.
The landuse map (shown in Figure 2) was updated to reflect agricultural areas with trenches and those without trenches. Figure 2 (b) illustrates the nature of land use within the Ukha sub-catchment and the extent (62%) of agricultural land with trenches (the orange colour in Figure 2(b)). The areas where farmers had adopted trenches in the study area (Figure 2(b)) were situated on the southern part of River Ukha, only in agricultural/community land and not in the conservation area (North-Eastern parts). The updated landuse map was then used to simulate the effect of trenches as erosion control with OpenLISEM.
4.2 Input data and model calibration results
The results of measured and estimated input data per landuse type for OpenLISEM is shown in Table 2. Most of the input parameters used in OpenLISEM simulations varied with time, depending on the measurement interval of the replicates. Nonetheless, the values for the input parameters are the averages of the measurements in the field as summarized in Table 2. Figure 6 illustrates the initial random roughness (Figure 6a) and the adjusted random roughness (Figure 6b) following equation 5 where the impact of trenches was incorporated. The values taken from the literature were less varied across land use classes, especially aggregate stability since the model is comparatively less sensitive to this parameter.
| Parameter | Agriculture (no trenches) | Agriculture (with trenches) | Built-up area | Planted forest | Grass land | Bush land | Bare & sparsely vegetated surfaces | Tropical high forest low-stocked | Tropical high forest well-stocked |
|---|---|---|---|---|---|---|---|---|---|
| N | 0.06 | 0.06 | 0.035 | 0.1 | 0.03 | 0.05 | 0.025 | 0.12 | 0.15 |
| AGGR (kPa) | 12 | 12 | 12 | 12 | 12 | 12 | 12 | 12 | 12 |
| PSI (cm) | 41.35 | 41.35 | 34.88 | 31.71 | 42.32 | 32.82 | 36.68 | 43 | 43.11 |
| COHr (kPa) | 14.48 | 14.48 | 2.67 | 10 | 8.6 | 21.4 | 3.39 | 23.2 | 71.4 |
| COH (kPa) | 31.44 | 31.44 | 374 | 29.62 | 24.91 | 21.89 | 34.14 | 14.85 | 17.98 |
| D50 (μm) | 29.51 | 29.51 | 30.94 | 28.96 | 12.69 | 18.25 | 9.02 | 7.65 | 7.12 |
| CH (m) | 2.03 | 2.03 | 2.84 | 13.11 | 1 | 2.53 | 3.26 | 49.5 | 59.67 |
| PER | 0.55 | 0.55 | 0.3 | 0.47 | 0.68 | 0.55 | 0.3 | 0.69 | 0.53 |
| Litter | 0.7 | 0.7 | 0.14 | 0.32 | 0.21 | 0.96 | 0.2 | 0.22 | 0.43 |
| Thetas | 0.51 | 0.51 | 0.5 | 0.52 | 0.52 | 0.54 | 0.51 | 0.58 | 0.78 |
| RR (cm) | 2.39 | ** | 1.71 | 2.91 | 2.84 | 4.56 | 2.44 | 2.96 | 2.54 |
| Stone frac | 0.1 | 0.1 | 0.23 | 0.04 | 0.09 | 0.21 | 0.2 | 0.15 | 0.1 |
| Ksat (mm/hr) | 6.77 | 6.77 | 11.6 | 11.74 | 10.72 | 9.04 | 6.26 | 12.8 | 18.88 |
| Thetai | 0.46 | 0.46 | 0.45 | 0.47 | 0.47 | 0.48 | 0.46 | 0.52 | 0.7 |
| Depth (mm) | 658 | 658 | 599 | 690 | 754 | 652 | 133 | 812 | 753 |
| LAI | 0.83 | 0.83 | 0.65 | 0.98 | 0.69 | 1.38 | 0.33 | 2.64 | 2.64 |
- NOTE: Manning's n (N), Aggregate stability (AGGR), Soil water tension at the wetting front (PSI), Additional cohesion by roots (COHr), Cohesion of soil (COH), Diameter of particle where 50% of sample mass is smaller (D50), Crop height (CH), Soil covered by vegetation (PER), Soil covered by litter (litter), Porosity (Thetas), Random roughness (RR), Stone fraction (Stone frac), Saturated hydraulic conductivity (Ksat), Initial soil moisture content (Thetai), Soil depth of upper layer (Depth) and Leaf area index (LAI).
- ** The RR values for agriculture (trenches) were computed using Equation 5 and varied with slope (Figure 6(b).
The calibration multiplication factors for Ksat and Manning's n values for both channels and slopes were 0.38 and 1.2, respectively. These factors were used for the selected rainfall event and changed the modelled hydrograph to fit with the observed hydrograph for the current situation that was measured at the outlet of the Ukha sub-catchment. Figure 7 illustrates the measured and simulated discharge hydrographs for the current situation (Figure 7a) and with two scenarios (Figure 7b) as well as the rainfall graph. The measured hydrograph follows the peaks of the rainfall, and the peak discharge matches the peak of the modelled hydrograph. Comparing the modelled and measured hydrograph, the simulated discharge peaks earlier than the measured discharge and the measured discharge shows more small peaks (see Figure 7a).
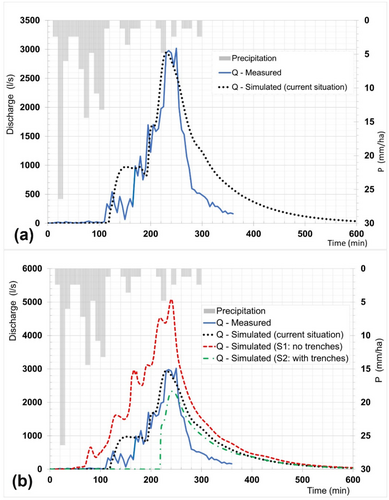
The measured and simulated discharges after calibration for the selected event at the Ukha sub-catchment were satisfactory (see Figure 7a). The calculated NSE (0.72) and KGE (0.61) coefficients are good and moderate, respectively (Gupta et al., 2009; Nash & Sutcliffe, 1970). This is attributed to the complicated nature of the measured and simulated hydrographs at the outlet of the Ukha sub-catchment (see Figure 7). The calibrated multiplication factor for Ksat was lower (0.38) compared to the measured Ksat values. This is due to using the Green & Ampt infiltration approximation, which uses a homogeneous wetting front parallel to the surface and often overestimates the infiltration. Moreover, antecedent moisture was high in Ukha sub-catchment since averagely 8.14 mm of rain was recorded daily within the previous seven days, prior to the simulated event of 28th April 2022. Further, the return period of the simulated event was common during the rainy season. About 5 rain events were recorded in April and May (MAM season) that were closely related to the simulated event. The Manning's n calibrated multiplication factor for slopes and channels which affects the timing of the hydrologic response was higher (1.2) as compared to the initial values. This reflects rough topography and the existence of obstacles in the channels, constraining the runoff and water flow in streams.
4.3 Simulation results and scenario analysis
The simulated hydrographs in Figure 7b illustrate the impact of trenches on discharge from the sub-catchment outlet. The current situation in the Ukha sub-catchment is shown in “Q-simulated (current)” with 62% of the agricultural fields having trenches. Scenario 1 (agriculture with no trenches) recorded the nearest start time of discharge (65 min) followed by the current situation (120 min) while the longest time before discharge (220 min) was recorded in scenario 2 (see Figure 7b). The peak discharge and time to peak at the outlet was highest in scenario 1 followed by the current and lowest in scenario 2 (agricultural land with trenches). Although a smooth discharge hydrograph with one peak was simulated for scenario 2 (with trenches) as shown in Figure 7b, several discharge peaks were simulated at the outlet in the current situation and scenario 1 (no trenches).
Table 3 displays the summary results of OpenLISEM for the current situation and two scenarios in Ukha sub-catchment. The discharge-rainfall ratios show that between 1.8% to 5.4% of the rainfall is simulated as discharge at the Ukha outlet. Surface storage was highest (0.23 mm) in scenario 2 and there was no surface storage in Scenario 1. The peak time discharge was the longest (242 min), and the total outflow was the lowest (13,514 m3) in scenario 2. The model simulations indicate that the absence of trenches in the entire sub-catchment (scenario 1) leads to an increase of runoff by 75.97% and soil loss by 35.12% (Table 2). The sediment in channels was extremely high (323 t) in scenario 1, followed by the current state (270 t) and lowest (62 t) in scenario 2. The simulated average soil loss was lowest in scenario 2 (0.75 t/ha) followed by the current situation (1.13 t/ha) and highest in scenario 1 (1.53 t/ha). The results from model simulations show a reduction of runoff by 40.45% and soil loss by 33.81% due to the impact of the trenches in Ukha sub-catchment (scenario 2).
| OpenLISEM run: | Current situation* | Scenario 1: no trenches | Scenario 2: with trenches |
|---|---|---|---|
| Discharge/Precipitation (%) | 3.06 | 5.38 | 1.83 |
| Surface storage (mm) | 0.14 | 0.00 | 0.23 |
| Total infiltration (mm) | 107.05 | 108.27 | 106.58 |
| Peak discharge at the outlet (l/s 103) | 2.95 | 5.08 | 2.33 |
| Peak time of discharge at the outlet (min) | 230.00 | 240.00 | 242.00 |
| Total outflow (overland + channel + boundaries + drains) (m3 103) | 2.26 | 3.98 | 1.35 |
| Splash detachment on land (ton 103) | 5.40 | 5.37 | 5.44 |
| Flow detachment on land (ton 103) | 2.24 | 5.25 | 1.55 |
| Flow detachment in channels (ton 103) | 14.21 | 15.65 | 11.33 |
| Sediment on land (ton) | 0.46 | 0.25 | 0.43 |
| Sediment in channels (ton) | 269.87 | 322.73 | 61.75 |
| Deposition on land (ton 103) | 7.54 | 1.03 | 6.94 |
| Deposition in channels (ton 103) | 9.00 | 8.81 | 7.79 |
| Total soil loss (ton 103) | 5.03 | 6.79 | 3.33 |
| Average soil loss (t/ha) | 1.13 | 1.53 | 0.75 |
- *The current land use situation with 62% coverage of trenches on agricultural land.
Figure 8 (a–c) shows the simulated spatial pattern of runoff (mm) and Figure 8 d – f shows the total soil loss (t/ha) for the current situation and the two scenarios in Ukha sub-catchment. High runoff is simulated to occur exclusively in the areas with land use classes “agriculture (no trenches)” and “bare & sparsely vegetated surfaces” in the current situation (Figure 8a) and scenario 1 (Figure 8b). Trenches reduced runoff in agricultural areas where farmers had established them but there are no visible spill-over effects to other land use areas like bushland, and built-up areas as seen in Figure 8 a (current situation and scenario 1).
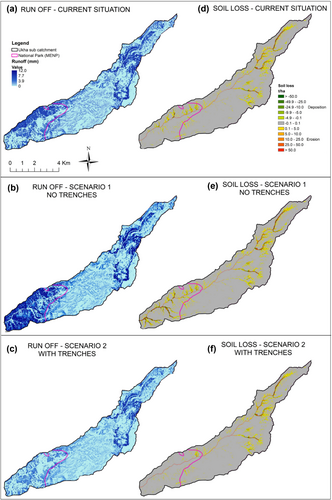
The simulated pattern of net total soil loss (t/ha) is illustrated in Figure 8 d–f. Like runoff, particle detachment (erosion) and sedimentation (deposition) are simulated to occur majorly in areas under agriculture (no trenches), bare & sparsely vegetated surfaces and planted forests. River Ukha, seasonal streams and valleys within the sub-catchment were also simulated to transport and deposit eroded sediments due to the rugged topography of the sub-catchment. In regard to the scenarios, more soil loss is simulated in scenario 1 (Figure 8e) especially in the lower sub-catchment, while the lowest erosion is simulated in scenario 2 (Figure 8f). Note that lack of trenches on the slopes in scenario 1, leads to increased erosion (and deposition) in the channels due to increased runoff and channel flow (Table 3).
5 DISCUSSION
5.1 Characterization of trenches
The dimensions of trenches established by this study varied widely among fields in the Ukha sub-catchment, with average measurements of 3 m in length, 0.5 m in depth and 0.7 m in width. Comparable results have also been reported in Kenya and Tanzania (Ngigi, 2003; Wolka, Mulder, & Biazin, 2018). Trenches have also been extensively applied in Ethiopia and India, demonstrating their adaptability to a wide range of topographical and climatic conditions (Mahajan et al., 2021; Mekonnen et al., 2017). The universality of trenches, especially the fanya chini and fanya juu types, highlights their relevance not only in the upper Manafwa catchment but across East Africa, where they are increasingly recognized as one of the most reliable structural SWC measures. The fanya juu trenches have been reported to be more effective in controlling erosion as compared to fanya chini (Hessel & Tenge, 2008).
Trenches were specifically hand-dug in agricultural fields purposely for trapping runoff and sediments. Noteworthy, the farmers in the study area are adopting several other SWC practices although this study only considered trenches for modelling purposes. Mixed farming, mulching, grass strips and tree planting have been adopted by farmers for erosion control (Bamutaze et al., 2021; Misanya et al., 2023). Compared to other SWC practices like mulching and grass strips, trenches provide a more direct method of intercepting runoff and trapping sediments, particularly on steeper slopes. The combination of trenches, terraces, mixed farming and tree planting enhances the reduction in surface runoff, making them more suitable for regions with intense rainfall patterns (Hessel & Tenge, 2008; Taye et al., 2018). Their ability to retain water during heavy downpours provides additional support to other measures, such as agroforestry, stone bunds and grass strips, enhancing overall effectiveness (Ebabu et al., 2023). Increased adoption of agroforestry, composting, mulching and contour trenches was reported in Burundi due to PIP training of farmers (Kessler et al., 2021). Regular maintenance after the rainy season is essential to clear debris and prevent water logging in the trenches. Agricultural activities are not recommended on steeper slopes exceeding 15° due to high vulnerability to erosion, and slope failure (Addis et al., 2016; Food and Agriculture Organization of the United Nations, 2006; Thomaz, 2009). High-gradient slopes are prone to soil erosion and often have low water-holding capacity, limiting the effectiveness of several SWC measures (Mugagga, Kakembo, & Buyinza, 2012).
5.2 Input data and model calibration
Process-based models like OpenLISEM are complex and require a lot of input data (Coulthard, Hancock, & Lowry, 2012; Jetten, De Roo, & Guerif, 1998). Secondary data and use of assumptions is made in case of data gaps (Hessel, van den Bosch, & Vigiak, 2006). Detailed rainfall data (10-min rainfall intensity) for the Ukha sub-catchment for 28th April 2022 was available together with discharge data at the outlet. Many input parameters were mapped according to the land use classes and the rest were estimated from existing literature due to data limitations (see Supplement S2). Approximate values were also used due to the heterogeneous nature of land use classes, for instance; one land use class for agriculture was considered which encompasses intercropping in banana-coffee with maize, beans, yams and vegetables (Bamutaze et al., 2010; Semalulu et al., 2012). Manning's N values were estimated based on Chow (1959) and on knowledge on the study area. For example, agricultural land has a relatively high Manning's n value (Table 2) due to mixed farming, agroforestry and intercropping, which leads to a relatively high surface cover and vegetation roughness. Bushland and grassland have lower Manning's n values as in this catchment, their vegetation cover is relatively sparse, often burned by farmers (in the dry season), exposing the soil to direct rainfall impact during the onset of the rain season. Additionally, intensive fodder harvesting for zero grazing further reduces protective ground cover in grasslands. A mini-disk infiltrometer was used that measures hydraulic conductivity (k) instead of saturated hydraulic conductivity (ksat). Ring infiltrometers may provide more reliable data as compared to minidisk infiltrometer (Fatehnia, Tawfiq, & Ye, 2016; Fodor et al., 2011). Previous rain events, which occurred in the catchment before the simulated event, have also been reported to impact the OpenLISEM simulation results, specifically on ksat due to soil saturation (Hardie et al., 2013; Ye et al., 2023). Finally, assigning specific parameters like porosity, soil depth and D50 to the classes of soil type and geology could potentially improve the accuracy of the model result (Baartman et al., 2012).
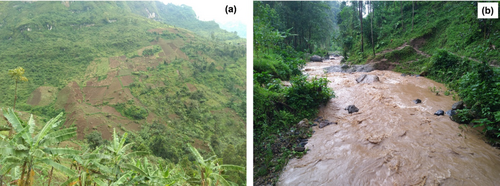
The calibrated model results for hydrology were found to be within realistic ranges and comparable with previously reported values in the study area (Bamutaze et al., 2021; Semalulu et al., 2012). Still, calibration of OpenLISEM model was a challenge given data limitations and field setbacks. Manning's n is often adjusted through model calibration to best match the measured hydrograph. The Manning's n calibration value was higher than the initial value (which was estimated from literature), indicating a high roughness and resistance to flow (Bisantino et al., 2015; Hessel, Jetten, & Guanghui, 2003). This is attributed to the rough terrain, geometry of the riverbanks and channel bedload (Baartman et al., 2012). The study area also presents a challenging physical environment as shown in Figure 9. The existence of dense vegetation can increase surface roughness as observed (primary forest and bushland) in the Northeastern part of the Ukha sub-catchment. The presence of obstacles and vegetation in stream channels has also been reported to increase Manning's n value (Baartman et al., 2012).
However, the discharge peak, peak time and the general shape of the simulated and measured hydrographs are comparable. The discrepancy between measured and simulated hydrographs is likely caused by uncertainties in literature values, sub-catchment heterogeneity and model sensitivity. There was uncertainty in the measured hydrograph, as the diver data exhibited unusual behaviour, such as negative water column height and large drops in height in the measured timeseries, which were not always consistent with the measured rainfall data. We selected the best representative diver data for the modelling, which was one reason only one rainfall event could be simulated in this study and no reliable data were available for model validation. Nonetheless, the calibration results showed a good agreement between the measured and modelled discharge.
The simulated sediment values are uncalibrated due to data limitations, and future studies could benefit from field measurements of sediment concentration at various points along the catchment's drainage network. Calibration with field data would provide a more accurate estimate of total soil loss and deposition, particularly in areas where the topography and land use vary.
5.3 Model simulation and scenario analysis
The simulated rainfall/discharge ratios are moderately high (38%), especially for scenario 1 for a small catchment that is in a mountainous landscape in a tropical region. The impact of trenches in reducing runoff is shown in Figure 7b and Table 3. The trenches act as physical barriers that intercept surface runoff, promoting increased infiltration. This process reduces the volume of overland flow and the energy of rainwater, thereby decreasing sediment transport. By capturing rainwater, trenches enhance infiltration, as indicated by the simulation results, where total infiltration rates are slightly higher in Scenario 2 compared to Scenario 1 (see Table 3). The difference in surface storage across the two scenarios highlights the effectiveness of trenches in trapping running water. Scenario 1 shows no surface storage due to the absence of trenches, allowing runoff to flow uninterrupted. In contrast, scenario 2 exhibits a higher surface storage of 0.23 mm, reflecting the trenches impact in confining runoff and reducing overland flow. This explains why scenario 2 had the lowest peak discharge (2,330 L s−1) and the longest time to peak (242 minutes). The trenches slowed down the movement of water, allowing absorption into the soil rather than contributing to channel flow.
The reduction in simulated sediment transport (Table 3 and Figure 8) underscores the effectiveness of trenches in controlling runoff and sediment flow. These have major implications for the downstream sedimentation and siltation of River Manafwa. The simulated soil loss values for one rainfall-runoff event, as in this study, are difficult to compare with those from previous studies within the catchment and beyond due to differences in methods and (time) scale. Previous studies have estimated the average annual soil loss in the study area using empirical methods and extrapolated by the RUSLE model to be 20 t/ha yr−1 (Bamutaze et al., 2021), and 46.3 t/ha yr−1 (Karamage et al., 2017). The simulated soil loss in Scenario 2 (0.75 t/ha) aligns with previous field measurements by Semalulu et al. (2012) for fields with conservation structures, which reported soil losses between 0.2 to 15.5 t/ha yr−1. While our results represent a single rainfall event, they offer a realistic snapshot of soil loss mitigation achieved through trenching. The cumulative effects of trenching could result in significant reductions in total erosion over the entire season, especially during intense rainfall events (in MAM and SON). However, if strong events follow each other closely, trench effectiveness might be reduced as they would still be partly filled with runoff water from the previous event. This should be taken into account when simulating erosion and runoff at an event time scale for an entire season. Our findings suggest that the adoption of trenching as a SWC measure in agricultural areas can significantly reduce both runoff and soil loss in hilly, tropical catchments like Ukha. As Scenario 2 demonstrates, the complete implementation of trenches in agricultural land across the sub-catchment in the future could reduce runoff by 40.45% and soil loss by 33.81%. Such reductions in erosion and sediment transport are critical for maintaining soil fertility and preventing downstream siltation of water bodies, which are important for sustaining agricultural productivity and protecting water resources in the long term. Policymakers and local farmers could consider promoting trenching as part of an integrated approach to land management in the entire catchment, particularly in regions where steep slopes and intense rainfall events make soil erosion a persistent threat.
5.4 Uncertainty and limitations
Quantifying the effect of trenches in erosion studies is particularly challenging due to limited data and incorporating sub-grid SWC measures into erosion models has not been often done. Previous studies relied on field plot measurements and calibration of SWC factor values (Hessel & Tenge, 2008; Taye et al., 2018). In this study, micro-depression storage was used to mimic the effect of trenches in capturing upslope runoff water and thus reducing hillslope runoff. This method may not adequately represent the situation on the ground. For example, field observations showed a very side range of trench dimensions, while we incorporated them based on average dimensions and number of trenches in a field. Quantifying the effect of trenches on runoff and soil loss at a farm level, during and after rain events may provide better estimates. While adapting micro-storage to mimic the effect of trenches results in less simulated overland flow, and therefore less detachment on the hillslopes where they are implemented (Figure 2), the actual effect of increased deposition of sediment in trenches was not simulated. Thus, the simulated soil loss could be an underestimation compared to the actual functioning of the trenches.
Additionally, it is important to acknowledge the possible impact of other existing SWC measures that were not included in the simulations in this study. Farmers in the study area have adopted several integrated SWC practices, such as minimum tillage, grass strips and agroforestry, which could influence the observed discharge rates. As a result, the simulations of the trenches alone may overestimate their relative contribution to runoff and erosion control in the baseline (current situation) and consequently in the simulated scenarios. Future studies should consider all existing SWC measures for better simulations, for instance, by conducting field measurements and experiments on the efficiency of these measures in combination and then incorporating them in modelling as well.
6 CONCLUSION
This study assessed the effectiveness of trenches as SWC measures in the steep mountainous area of Mt. Elgon (Uganda) combining field investigation and modelling using the OpenLISEM model. The trenches in the upper Manafwa catchment were primarily established on agricultural land as a local measure for controlling soil erosion but not in the entire study area. Trench dimensions varied but had an average length of 3 m, width of 0.7 m and depth of 0.5 m. There are several other conservation measures like mulching, minimum tillage and grass strips that are also adopted by farmers in the study area.
Since the trench dimensions were much smaller than the available DEM, trenches were parameterized in OpenLISEM to influence storage in microdepressions by adjusting the random roughness parameters, increasing the roughness based on average trench dimensions and their distribution within farmers' fields as observed in the catchment. This enabled quantification of their effect on soil erosion at a sub-catchment level. The simulated average soil loss was 1.13 t/ha in Ukha sub-catchment under the current situation where trenches were implemented in about 62% of the farmland. Encouraging land users to implement SWC measures on a catchment scale is paramount. A scenario in which trenches would be implemented in all farmlands (scenario 2), model simulations demonstrate a substantial reduction of 40.45% in runoff and 33.81% in soil loss. To achieve higher reductions in erosion rates, a comprehensive approach involving various measures such as minimum tillage, trenches with vegetative soil/stone bunds is recommended. These measures should extend beyond agricultural areas.
Collaborative efforts, involving the upscaling of SWC measures from individual farmers to hillslope and catchment levels, as exemplified by projects like MWARES and the PIP approach, play a vital role in reducing soil erosion and enhancing crop productivity. Increasing awareness among farmers and providing hands-on training are essential for boosting adoption rates. The active involvement of extension officers and conservationists is crucial in delivering these services. Despite the limitations, this study demonstrates the potential of using OpenLISEM, with fine-tuned trench parameters, to offer a scalable solution for soil conservation in similar erosion-prone regions. In summary, encouraging widespread adoption of SWC measures like trenches, will reduce soil erosion and increase crop productivity in mountainous landscapes such as Mount Elgon.
AUTHOR CONTRIBUTIONS
(a) Conceptualization: Hosea Opedes, Lena F. Fuchs, Jantiene E. M. Baartman; (b) Methodology: Hosea Opedes, Lena F. Fuchs, Jantiene E. M. Baartman; (c) Software: Hosea Opedes, Lena F. Fuchs, Jantiene E. M. Baartman; (d) Investigation: Hosea Opedes, Lena F. Fuchs; (e) Resources: Hosea Opedes, Lena F. Fuchs, Jantiene E. M. Baartman; (f) Supervision: Jantiene E. M. Baartman, Caspar A. Mücher, Aad Kessler and Coen J. Ritsema; (g) Funding acquisition: Aad Kessler; (h) Writing - initial draft: Hosea Opedes; (i) Writing – reviewing and editing: Hosea Opedes, Lena F. Fuchs, Jantiene E. M. Baartman, Caspar A. Mücher, Aad Kessler and Coen J. Ritsema.
ACKNOWLEDGEMENT
The authors would like to thank the Consortium of Manafwa Watershed Restoration and Stewardship (MWARES) Project, specifically; Africa 2000 Network – Uganda, Wageningen Environmental Research, Makerere University, Kyambogo University, and other partners; Uganda Wildlife Authority, and the leadership of Bududa District Local Government for supporting data collection and field related activities. We acknowledge project funding support from DOB Ecology (5200044445). We appreciate the support of research assistants, Ms. Caroline Kituyi and Mr. Dison Wesonga during data collection and field surveys. We appreciate RSV Engineering Group and Les Rams Consults for laboratory analysis of soil and water samples. We acknowledge the contribution of Dr. Meindert Commelin in OpenLISEM model simulations, R code development for AR calculations and accuracy assessment. We would also like to acknowledge the efforts of two anonymous reviewers, whose comments contributed to improving this work.
Open Research
DATA AVAILABILITY STATEMENT
The data supporting the findings of this study are available within this article and the supplement. The derived data of this study are available from the corresponding author upon reasonable request.
Additional supporting information can be found online in the supporting information section at the end of this article.


