Multi-annual variability of storm events and morphological response in the SW Iceland: The Valahnúkamöl boulder barrier
Abstract
While many studies have highlighted the high mobility of gravel/pebble beaches due to storm waves, further research is needed to improve understanding of the morphodynamic of coastal boulder accumulations. This paper provides original data about storm-induced morphogenetic processes for the Valahnúkamöl boulder barrier located in the Reykjanes Peninsula (SW Iceland). The study is based on annual topo-morphological surveys conducted from 2015 to 2023 and a shoreline change analysis for the period 1978–2023 using a series of aerial photos. In addition, hydrodynamic conditions (wave and water levels) were analysed using field records and model results. Results show a good correspondence of the morphological changes of the barrier to the frequency/energy of morphogenetic events. Interannual surveys (2015–2023) indicate a high mobility of boulders across the beachface regardless of the variability of hydrodynamic conditions. In contrast, boulders located on the crest and the back-barrier moved more episodically by overtopping and overwashing processes during extreme events combining storm waves and high spring tide levels. A massive landward transfer of boulders resulting in the most significant barrier retreat, −6.1 m, was recorded during the winter 2022. Between 1978 and 2023, the mesoscale shoreline changes of the barrier retreated landward by rollover. The pluri-decadal variability in shoreline retreat rates seemed to be strongly controlled by extreme hydrodynamic conditions. However, this cross-shore dynamic responses to episodic overwash depended on specific geological constraints. This survey provides a first quantitative assessment of the morphological impact of significant morphogenetic events within the highly energetic hydrodynamic context of SW Iceland. These data complement surveys undergone through a wide range of coastal morphologies elsewhere along the Western coasts of the North Atlantic basin. Such assessments may prove useful in anticipating the potential intensification of hydrodynamic conditions at mid-latitudes due to climate change.
1 INTRODUCTION
Storm waves are major drivers of changes in the coastal environment and hazards such as coastal flooding and erosion, which can induce potential socio-economic disruption (Harley, 2017). Storm waves drive the largest morphological changes from the near-shore zone (Lippmann, Holman, & Hathaway, 1993; Ruessink, Pape, & Turner, 2009) to the subaerial barrier and beach, including dunes (Stéphan, Suanez, & Fichaut, 2012; Castelle et al., 2015; Blaise et al., 2015; Masselink, Scott, et al., 2016; Masselink, Castelle, et al., 2016; Suanez et al., 2022, 2023). As such, long-term storm wave analysis related to morphological changes is fundamental for an improved understanding of storm impacts in terms of the physical function of the coastal environment and/or coastal management.
In Europe, long-term wave climate projections (dating back to the 1950s) are based on the data provided by the European Centre for Medium-Range Weather Forecasts (ECMWF) created in the mid-1970s. Since its creation, forecasting has been continually improved leading to the ECMWF Reanalysis v5 (ERA5) (Hersbach et al., 2020), which is the fifth generation ECMWF global atmospheric reanalysis following ERA-Interim (Dee et al., 2011), and the earlier ERA-40 (Uppala et al., 2005) reanalysis. It provides data (i.e., global atmosphere, land surface and ocean waves) from 1950 onwards, which are distributed by the Copernicus Climate Change Service (C3S). Likewise, since the mid-1980s, the rapid and increasingly sophisticated development of Earth observation satellite missions, carrying radar altimetry and synthetic aperture radars, has made it possible to acquire highly relevant observations on the intensity of storms and associated climate patterns for at least the last thirty years (Ardhuin et al., 2019; Dodet et al., 2020; Izaguirre et al., 2010). Although this information is produced on a large spatial scale, its poor temporal resolution means that it needs to be complemented with in-situ measurements and numerical modelling to obtain relevant and accurate data in the coastal zone (Osinski & Radtke, 2020; Barbariol et al., 2021; Beyramzadeh, Siadatmousavi, & Derkani, 2021; Sharmar, Markina, & Gulev, 2021; Shao et al., 2021; Alday et al., 2022).
In recent years, several authors have computed trends in wave heights using these long-term hindcast wave climates and/or calibrated data from multi-mission altimeter records (e.g. Bertin, Prouteau, & Letetrel, 2013; Timmermans et al., 2020, see Casas-Prat et al., 2024 for a review). Based on a long-term wave hindcast analysis (1953–2009), Dodet et al. (2010) showed an increasing trend of up to 1.2 m (i.e., 0.02 m.yr−1) of the 90th percentile of significant wave heights (Hs) at 55°N latitude for the NE Atlantic Ocean. Similarly, the 109-yr wind-wave hindcast analysis conducted by Bertin, Prouteau, & Letetrel (2013) on the North Atlantic Ocean using the 20th century atmospheric reanalysis (20CR) shows an increase in Hs reaching 0.01 m.yr−1 north of 50°N. The authors explained this increase by a rise in wind speed exceeding 20% over the entire period of analysis. For the same zone (i.e., North Atlantic including Iceland surrounding ocean zone), Young & Ribal (2019) indicated a weak positive trend in mean Hs (about +0.3 cm.yr−1, i.e., not statistically significant) over the period 1985–2018. However, they noticed a significant positive trend in the 90th percentile Hs of about +0.8 cm.yr−1. More recently, Hochet et al. (2023) indicated that over the North Atlantic, Hs trends since 1993 are mostly explained by internal variability at multi-annual timescales rather than anthropogenic climate change. The different trend values in mean or extreme Hs for the North Atlantic zone are also pointed out by Meucci et al. (2020). They indicated that twentieth-century ECMWF reanalyses (20CR) show spurious trends in 10-m surface wind speed U10 and significant wave height Hs throughout the entire 1901–2010 period.
As indicated by Castelle et al. (2017, 2018), the variability in North-East Atlantic winter-mean wave height north of ~52°N is primarily related to the North Atlantic Oscillation (NAO), while it is better correlated with the West Europe Pressure Anomaly (WEPA) around ~45°N. This link between the wave climate and atmospheric climate oscillations was initially pointed out by Woolf et al. (2002), who indicated that the long-term trends in wave climate calculated over a few decades for NE Atlantic latitudes were characterized by positive or negative shifts depending on the period associated with upward and downward trends of the NAO index. Indeed, atmospheric dynamics driven by regional pressure gradients (high pressure versus low pressure) play a crucial role in the intensity and/or frequency of storms but also control Hs inter-annual variability (Bertin, Prouteau, & Letetrel, 2013). Analysing the temporal variability of the NAO from 1950 to 2020 as the dominant mode of climate variability in the NE Atlantic (the Outer Hebrides in the West of Scotland), Kümmerer et al. (2023) showed a significant positive linear long-term trend and a positive correlation with winter storm parameters. Bricheno et al. (2023) noticed a poleward shift since the 1990s and an increase in the annual mean number of storms, inducing a reduction of mean significant wave height in the North of the UK, while increasing in the south. The authors also indicated that climate change could affect storms and waves in the North Atlantic, potentially increasing the height of the most severe waves by 2,100 under IPCC scenario RCP8.5, while the mean significant wave height will decrease overall. Moreover, as the wave characteristics are sensitive to changes in water depth in shallow and intermediate waters, the 1970–2,100 prospective simulations achieved by Chaigneau et al. (2023) on northeastern Atlantic under the SSP5–8.5 climate change scenario, showed an increase in wave heights of up to 40% by the end of the 21th century.
The zone surrounding the south-southwest Iceland is one of the stormiest regions of the North Atlantic Ocean. Betts et al. (2004) indicated that mean sea-level winter pressure displays a discrete area of minimum pressure (<1,000 hPa) in SW Iceland, due to mobile depression systems reaching their maximum intensity in this region. The study of Schinke (1993) analysing “deep cyclones” (i.e., cyclones with central pressures ≤990 hPa) over Europe and large parts of the North Atlantic Ocean in the period 1930–1991, showed a frequency of 5 to 6 events in SW Iceland, compared with 2 to 1 events in southern England and West Brittany. More recently, Lobeto et al. (2024) indicated that the open coasts of NW Europe are impacted by more than 10 storms per year with mean significant wave heights over 6 m, leading to the highest degree of storminess for Iceland, Ireland and Scotland. To measure the impact of these storms on the morphosedimentary evolution of the coast of SW Iceland, coastal topo-morphological monitoring was established in 2014, with the first measurements acquired in 2015 (Autret et al., 2018). The purpose of such monitoring is to evaluate the effects of climate change on hydrodynamic conditions and assess how coastal morphologies are adapting to these changes (Banno, 2023; Mentaschi et al., 2018; Wright & Thom, 2023). It is therefore crucial that these surveys be carried out over the long term, at least on a multi-decadal scale.
As part of this Icelandic observatory, four sites corresponding to rocky cliffs at the top of which are high-energy deposits accumulated during storms, known as CBD (Coastal Boulder Deposits), have been surveyed since 2015 on the Reykjanes Peninsula (Autret et al., 2023). The first results of this survey highlighted that activation of CBDs between 2015 and 2019 –measured from the volumes of displaced boulders–, shows a good correspondence with the frequency and duration of storms. Thus, this study showed that these CBDs were a good proxy for analysing and surveying oceanic hydrodynamic conditions, particularly storms. Other sites corresponding to accumulations have also been surveyed in the same sector, notably the Valahnúkamöl boulder barrier, situated just north of the Reykjanestá Cape. The choice to survey a boulder barrier in addition to CBDs was intended to capture a wide range of morphodynamic processes and responses to extreme events by focusing on varied coastal features subject to relatively similar hydrodynamic forcing. While CBDs are generally displaced during the most energetic storm events, we hypothesized that coastal barriers may show different patterns of storm-induced erosion processes (and post-storm recovery), thus providing a complementary proxy for the study of extreme events in SW Iceland. As reported by Pérez-Alberti and Trenhaile (2015) who studied two boulder beaches in northern Spain (Galicia) over two consecutive winters, including the very stormy winter of 2013–2014, the greater the height of maximum storm waves, the greater the boulder movement. However, the authors point out that boulder size also plays a crucial role in the extent of movement determined from volumes of displaced boulder, i.e., moved volumes being inversely proportional to boulder size. Orford and Carter (1982) recognized four types of storm impacts driving the gravel-dominated barrier deposits, going from the calmer “overtopping” processes to the most damaging “catastrophic overwash” leading to barrier breaching, including the two intermediate “discrete” and “sluicing” overwash processes. Considering that overwash is the fundamental cross-shore mechanism forcing barrier retreat through the rollover process, especially during storm events (Orford et al., 1995; Forbes et al., 1991, 1995; Tillmann & Wunderlich, 2013; Stéphan et al., 2018; Suanez et al., 2022), the approach adopted in this study was to assess the extent of these processes, which appear to be a good indicator of the impact of the intensity (and frequency) of extreme events, bearing in mind that the Valahnúkamöl barrier consists of much coarser sediments than gravel barriers.
Monitoring conducted in this study consists of an annual topo-morphological survey carried out just after the winter period (i.e., generally in spring). In collaboration with the Icelandic Road and Coastal Administration (Vegagerðin of Reykjavik), the hydrodynamic conditions (waves and water levels) are analysed to identify the most morphogenetic events and to see if they have been captured by the morphological changes observed. This paper, therefore, focuses on the annual morphosedimentary response of the Valahnúkamöl barrier to extreme events over the period 2015–2023. The use of old aerial photographs extends the analysis to the last few decades (from 1978 to the present), but at a lower survey frequency.
2 STUDY SITE
2.1 Morphostructural and morphological setting
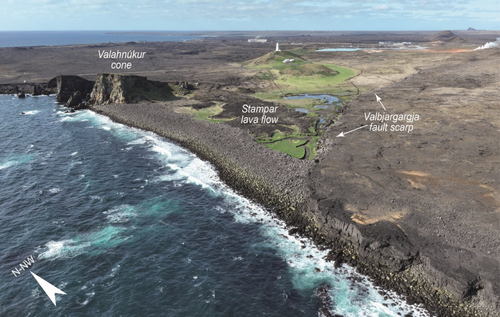
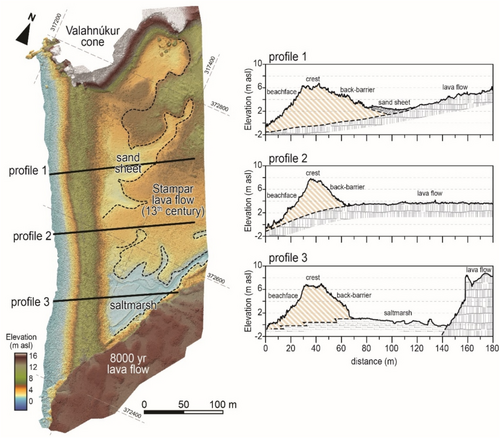
The Valahnúkamöl boulder barrier is located on the Reykjanes Peninsula in SW Iceland (Figure 1a,b), one kilometre north of the Reykjanestá Cape (Figure 1c). The coastal geomorphology of this barrier was first described by Etienne and Paris (2010). According to these authors, it corresponds to a massive boulder barrier covering an area of ~27,000 m2, oriented NNW–SSE. It is about 420 m long and 70 to 90 m wide (Figure 2) for an estimating volume of 132,000 m3. It culminates at a maximum height of 9.8 m above sea level (asl). This barrier was built in a collapsed graben-type compartment, framed by two fault escarpments oriented perpendicular to the shoreline. The fault scarp is clearly visible to the south of the collapsed compartment (Figure 2). The northern part of the embayment is hidden by the Valahnúkur hyaloclastite cone, which corresponds to the highest relief along the coast of Reykjanestá (Figures 1c and 2). This tectonic feature is characteristic of the Reykjanes Peninsula, which constitutes a transtensional plate boundary characterized by extensional and unthrusting structures, giving rise to several volcanic systems and NE–SW-trending fracture networks (Sæmundsson et al., 2020). The boulder barrier closes a lagoon located behind, at the lowest point of the collapsed compartment which has been partially filled by the Stampar lava flow dated to the 13th century (Figure 2).
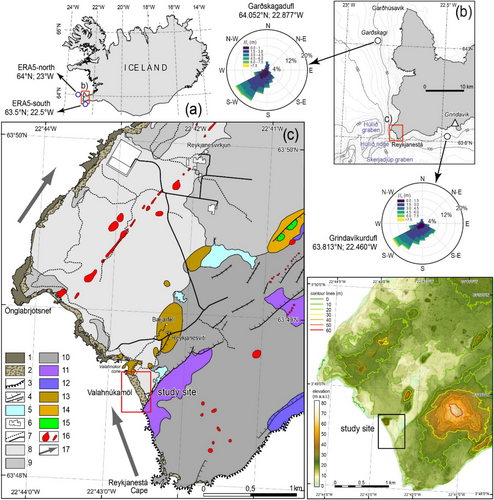
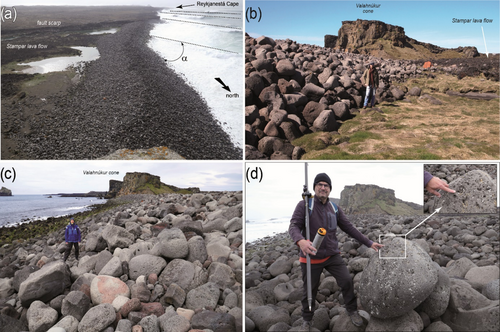
The coarse sediments that form the boulder barrier are derived from the erosion of basaltic cliffs that extend south to the Reykjanestá Cape (Autret et al., 2016, 2023). Considering the main SW direction of the incident waves in the area (Figure 1b), the major longshore current responsible for coastal sediment transport is oriented towards the N-NW (Figure 1c), as shown in Figure 3a. Based on the b-axis values, the sedimentological analysis conducted by Etienne and Paris (2010) showed a range of grain size between 0.32 m and 0.72 m. As part of this study, new boulder size measurements were carried out in 2017 on a sample of 300 boulders along the barrier, giving a D50 of b-axis value of around 0.54 m, with a maximum reaching 2.2 m in the beachface and a minimum of 0.25 m in the back-barrier. In terms of the grain size distribution, finer sediments are located on the barrier crest, while the grain size increases downward along the seaward slope (Figure 3c). The back-barrier shows less of a systematic trend and no longitudinal granulometric sorting is observed (Figure 3b), either on the seaward barrier slope nor on the crest.
The topo-morphological survey carried out after the study by Etienne and Paris (2010) allows a more detailed analysis of the longshore variability in barrier morphology, which can be separated into three sectors (Figure 4). The northern sector of the barrier rests on the southern edge of the Valahnúkur volcanic cone. The height of the barrier is ~6.6 m asl and its width exceeds 100 m. The back-barrier, characterised by a gentle slope (10%), rests on the Stampar lava flow covered by hyaloclastic sand sheets at ~2.3 m asl. The central part of the barrier is narrower (~70 m wide) and rises to a height of 8.1 m asl. The back-barrier slope is very steep (24%) and rests on the Stampar lava flow at an altitude of 3.4 m asl. To the south, the barrier is 70 m wide and its crest lies at 7.5 m asl. The back-barrier is also very steep (24%), resting on salt marsh at an altitude of ~1 m.
Directly offshore from the Valahnúkamöl barrier, the Reykjanes Ridge exhibits a highly complex bathymetry. A series of seamounts with depths ranging from 60 to 100 m corresponds to closely spaced (≈3 km) and small-size individual axial volcanic ridges (i.e., Húllið, Eldey, Fuglasker ridges), which are sinuous in plan view and have an en-echelon arrangement (Appelgate & Shor, 1994; Höskuldsson, Hey, & Kjartansson, 2007; Keeton et al., 1997; Laughton, Searle, & Roberts, 1979; Parson et al., 1993) (Figure 1b). Crater rows distributed along the high axial volcanic ridges culminate at depths of 0 to 50 m. These ridges dominate the surrounding seafloor, which corresponds to two distinct basins in the area (Skerjadjúp and Húllið grabens), with depths of approximately 175 m (Figure 1b). Valahnúkamöl barrier is located at the extension of the Húllið individual axial volcanic ridge, which extends offshore for a distance of 10 km and a width of 3.4 km along a southwest axis (Höskuldsson, Hey, & Kjartansson, 2007).
2.2 Tectonic and ground subsidence
The seismic and volcanic system of Krísuvík, located in the central part of the Reykjanes Peninsula, associated with a high-temperature geothermal context, induces variable uplift and subsidence movements in the area (Michalczewska et al., 2012). Based on levelling, Eysteinsson (2000) indicated that the Reykjanes geothermal system was affected by natural crustal subsidence at a rate of about 6 mm.yr−1 prior to utilization. This subsidence rate was both confirmed by InSAR (Vadon & Sigmundsson, 1997), and GPS (Hreinsdóttir et al., 2001) data, and geological studies using drill cores (Friðleifsson & Richter, 2010). Tectonic studies suggest that the system is confined to an NE/ENE aligned graben structure controlled by the Litla–Vatnsfell and the Skálafell faults (Khodayar et al., 2018).
The Reykjanes Peninsula is also the primary geothermal resource zone of Iceland, distributed in three high-temperature geothermal fields which are Svartsengi, Eldvorp and Reykjanes. As such, the extraction of geothermal fluids is also causing ground deformation. In Svartsengi a power plant has been in operation since 1975 leading to land subsidence of 23.7 cm from 1976 to 1999, which corresponds to about 10 mm.yr−1. The subsidence bowl in Svartsengi extended to the Eldvorp geothermal field on the southwest where the subsidence has been 4–10 mm.yr−1. At the Reykjanes geothermal field, the subsidence rate reached about 6 mm.yr−1 between 1986 and 1999 (Eysteinsson, 2000). Based on the description of the depositional environment of deep drill cores collected on the Reykjanes geothermal field, the subsidence rate has also been estimated to about 6 mm.yr−1 over the last 500,000 years (Friðleifsson & Richter, 2010). The extraction of geothermal fluids at Reykjanes began to be used on a large scale in May 2006 (Keiding et al., 2010). The subsidence in the centre of the deformation field between 2005 and 2016 reached about 26 cm, i.e., ~24 mm.yr−1 (Parks et al., 2020). A rate of ground deformation of 25 mm.yr−1 induced by geothermal utilization between April 2015 and October 2017 has also been indicated by Receveur et al. (2019).
Since 19 March 2021, volcanic activity has started again in the Fagradalsfjall area (north-east of Grindavik), up to Litli-Hrútur mountain (Barsotti et al., 2023). Between March 2021 and July 2023, several eruptions took place, giving rise to a new crater. These eruptions were the first signs of the high seismic activity that began in November 2023 in the town of Grindavík, followed by six volcanic eruptions from December 2023 to August 2024 (still ongoing at the time of writing) between Svartsengi area and Grindavik. Based on the information provided by the Icelandic Meteorological Office (https://en.vedur.is/about-imo/news/volcanic-unrest-grindavik), the measurements of ground movement at the GPS station SKSH in Svartsengi (Blue Lagoon area) showed significant uplift up to 15 cm between 8 February and 16 March 2024 when the fourth eruption began. The ground vertical movement started again until the beginning of May due to the filling up of the magma chamber. However, in the Valahnúkur sector (tip of Reykjanesta Peninsula) located at about 15 km from this volcanic activity centre, these uplifts are not captured. That shows that the ground deformations were very limited to the sectors of Svartsengi and Grindavik.
3 DATASET AND METHODS
3.1 Morphological survey
The analysis of the morphological changes was conducted at two timescales (i) from 2015 to 2023 the interannual topo-morphological changes were studied using Kite Aerial Photography (KAP) and Unmanned Aircraft Vehicles (UAV)-based high-resolution imagery and (ii) the pluri-decadal shoreline changes were analysed using aerial photography taken from 1978 to 2023.
3.1.1 Data collection
A survey of KAP and UAV-based data collection was undertaken in May 2015 (still ongoing) in order to produce high-resolution orthorectified aerial photos and Digital Elevation Models (DEMs) by using Structure-from-Motion and Multi-View Stereo (SfM-MVS) processing (Fonstad et al., 2013; Westoby et al., 2012; Jaud et al., 2019; Nagle-McNaughton & Cox, 2019; Autret et al., 2023). Note that there was no survey in 2020 due to the COVID-19 pandemic, which prevented travelling abroad. From 2015 to 2017KAP monitoring was performed using two kites alternately, depending on the wind conditions: a Delta Trooper (Dan Leigh®) for strong winds and a HQ Kites® Flowform 4.0 for light winds. Aerial photographs were taken with Ricoh® GR and Ricoh® WG-5 cameras (16.2 MP resolution, fixed focal length of 18.3 mm and 4.5 mm, respectively) connected to the kite line by a BROOXES® Gent-X picavet set (Table 1). From 2018, UAVs such as DJI® Phantom 4-Pro and Mavic3E RTK quadcopters, equipped with FC6310 (focal length of 8.8 mm) and M3E (focal length of 12.29 mm) cameras, were used. Images were taken at a constant altitude with an angle of −88° (subnadir), following a predefined flight plan set up to provide a front and side overlap of 70% and 80%, respectively. In 2023, aerial image acquisition was carried out using DJI's Mavik3E-RTK quadcopter (M3E RTK) with D-RTK2 mobile station for drone RTK positioning (Table 1).
| Dates | UAV/KAP | Camera | Flight altitude (m) | Nb of images | Resolution of images (m) | Area (km2) | Resolution DEM (m/px) | Nb of GCPs | σμ for X (m) | σμ for Y (m) | σμ for Z (m) | δx (m) | δy (m) | δz (m) | δuDoD (m) |
|---|---|---|---|---|---|---|---|---|---|---|---|---|---|---|---|
| 08/05/2015 | Kite aerial photography (KAP) | Ricoh® WG-5 camera (4.5 mm) | 42,9 | 668 | 0,013 | 0,125 | 0,026 | 51 | 0,04 | 0,04 | 0,02 | 0,06 | 0,06 | 0,02 | |
| 17/05/2016 | Kite aerial photography (KAP) | Ricoh® GR camera (18.3 mm) | 46,2 | 728 | 0,012 | 0,078 | 0,024 | 20 | 0,01 | 0,01 | 0,01 | 0,03 | 0,03 | 0,02 | 0,03 |
| 15/05/2017 | Kite aerial photography (KAP) | Ricoh® GR camera (18.3 mm) | 51,6 | 388 | 0,014 | 0,078 | 0,027 | 14 | 0,01 | 0,01 | 0,01 | 0,03 | 0,03 | 0,02 | 0,02 |
| 24/05/2018 | Drone DJIP4 | FC6310 (8.8 mm) | 38,4 | 367 | 0,009 | 0,074 | 0,009 | 19 | 0,03 | 0,02 | 0,05 | 0,05 | 0,04 | 0,05 | 0,06 |
| 16/05/2019 | Drone DJIP4 | FC6310 (8.8 mm) | 36,4 | 405 | 0,010 | 0,070 | 0,018 | 17 | 0,01 | 0,01 | 0,01 | 0,03 | 0,03 | 0,02 | 0,06 |
| 31/08/2021 | Drone DJIP4 | FC6310 (8.8 mm) | 44,1 | 322 | 0,012 | 0,078 | 0,018 | 25 | 0,01 | 0,02 | 0,02 | 0,03 | 0,04 | 0,02 | 0,03 |
| 18/05/2022 | Drone DJIP4 | FC6310 (8.8 mm) | 46,8 | 441 | 0,012 | 0,084 | 0,025 | 23 | 0,01 | 0,01 | 0,01 | 0,03 | 0,03 | 0,02 | 0,03 |
| 12/06/2023 | Drone DJI M3E-RTK (12.29 mm) | M3E (12.29 mm) | 36,6 | 711 | 0,009 | 0,081 | 0,019 | 20 | 0,01 | 0,02 | 0,01 | 0,03 | 0,03 | 0,02 | 0,03 |
Targets as ground control points (GCPs) corresponding to red plastic plates 30 cm in diameter were surveyed by RTK-GNSS measurements in order to optimize the SfM photogrammetric processing. To control the accuracy of RTK-GNSS surveys from one year to the next, fixed ground validation points (GVPs) corresponding to brass topographic nails set into the rocky substratum were systematically measured. Spatial coordinates were referenced to EPSG 3057 (ISN93) using the Icelandic geodetic network for calibration. The elevation measurements were originally acquired in ellipsoidal heights (ZEH), before being converted to the ISN93 topographic datum (denoted as Zasl for above sea level). As indicated above, due to the ground subsidence in the study area (about 10 mm yr−1), the difference between ZEH and Zasl (vertical offset) has varied by a few centimetres during the monitoring period. In this paper, we did not account for these changes and considered a constant vertical offset of −65.638 m. This value corresponds to the vertical offset calculated in 2016 based on data from the network of fixed GNSS stations managed by the University of Iceland.
3.1.2 Structure-from-motion (SfM) processing
KAP and UAV-based imagery were processed using the Structure for Motion (SfM) Agisoft Metashape. For each survey, a set of about 320 to 730 images were processed separately. As recommended by Bertin et al. (2022), images with a quality score below 0.5 were removed. Image alignment was carried out using the “High” accuracy setting, a reference pair preselection set to “source”, key point (tie point) limits set to 40,000 (10,000). After initial image alignment and the reconstruction of a sparse point cloud, photogrammetric targets were manually tagged in images and their coordinates were imported to improve model georeferencing. Then, sparse point clouds were systematically cleaned using the “gradual selection” tool with the following parameters: minimum image count of 2, maximum reprojection error of 0.4 pixel and maximum reconstruction uncertainty of 10. Point cloud densification was carried out using a reconstruction quality set to “High” with “moderate” depth filtering. The resulting dense point clouds were used to generate DEMs at 1 to 2.7 cm resolution.
The uncertainty of each DEM was quantified in their vertical component (denoted as δz) and horizontal components (denoted as δx and δy) by summing (i) errors related to the reconstruction processes by photogrammetry and the interpolation method and (ii) GNSS measurement errors when positioning targets. Standard deviations (σ) of each coordinate component were calculated for each GCP and then averaged over the number of control points to produce σμ (Table 1). The accuracy of GNSS measurements in X, Y and Z was also estimated by calculating the RMSE from GVPs independent of the GCPs network. From the repeat observation of GVPs, the margins of error of GNSS measurements are of ±0.019 in horizontal (X, Y) and ±0.008 m in vertical (Z) plane.
Finally, the volumetric calculations were conducted by distinguishing three morphological domains of the barrier: the back-barrier, the crest and the beachface. As UAV flights were carried out under varying tide levels, the lowest portion of the beachface was not systematically captured on resulting DEMs. To mitigate potential biases in inter-annual comparisons, the surface areas considered for volumetric analysis on the beachface were standardized using the lowest common elevation across all DEMs, set at 1.2 m asl.
3.1.3 Analysis of shoreline changes
The pluri-decadal morphological changes of the Valahnúkamöl boulder barrier were reconstructed from three types of data (Table 2). First, we used very high-resolution orthophotos produced from the KAP/UAV survey from 2015 to 2023. Thereafter, a set of numerical orthophotos dated from 1996 to 2019 (0.1 to 0.5 m res.) were obtained from Loftmyndir ehf. Finally, various aerial surveys conducted by the National Land Survey of Iceland (NLSI) between 1978 and 1998 were geometrically corrected and georeferenced according to a well-known procedure described by many authors (Crowell et al., 1991; Dolan et al., 1980; Douglas & Crowell, 2000; Moore, 2000). Photographs were rectified by selecting between 18 and 22 well-distributed, high-quality control points using ArcGIS software. These control points were common with the drone orthophoto produced in May 2018 covering a large surface area around the Valahnúkamöl boulder barrier. From these points a 2nd order polynomial transformation was calculated and upon resampling, the historical images were georeferenced to the projection and coordinate system (EPSG 3057, ISN93) of the dataset. Errors were estimated using the same procedure as Moore and Griggs (2002) and were found to be less than ±0.5 m in the areas studied.
| Date | Aerial photo code | Flight altitude (m) | Pixel size (m) | Colour | Error | Source |
|---|---|---|---|---|---|---|
| 09/09/1978 | F21-F-4111 | 5,500 | 0.75 | B&W | 1.02 | National Land Survey of Iceland |
| 16/07/1981 | G08-G-1866 | 1,500 | 0.27 | B&W | 0.45 | National Land Survey of Iceland |
| 23/08/1984 | H17-H-4235 | 2000 | 0.36 | B&W | 0.55 | National Land Survey of Iceland |
| 24/08/1989 | L08-L-2127 | 5,486 | 0.56 | B&W | 0.82 | National Land Survey of Iceland |
| 26/08/1996 | 9,660–801-0721 | 5,500 | 0.50 | B&W | 0.50 | Loftmyndir ehf |
| 16/08/1998 | O1-O-8802 | 5,486 | 0.61 | B&W | 0.92 | National Land Survey of Iceland |
| 23/08/1998 | 9,827–152-1,332 | 1,624 | 0.20 | RVB | 0.20 | Loftmyndir ehf |
| 16/08/1999 | 9,930–070-1849 | 3,433 | 0.50 | RVB | 0.50 | Loftmyndir ehf |
| 21/10/2005 | 0522–01-004 | 1,492 | 0.15 | RVB | 0.15 | Loftmyndir ehf |
| 19/07/2006 | 0613–01-011 | 3,846 | 0.50 | RVB | 0.50 | Loftmyndir ehf |
| 05/08/2008 | 0822–06-180 | 3,118 | 0.50 | RVB | 0.50 | Loftmyndir ehf |
| 10/07/2012 | 1,207–04-352 | 1,608 | 0.10 | RVB | 0.10 | Loftmyndir ehf |
| 02/08/2013 | 1,322-01-2,299 | 3,227 | 0.50 | RVB | 0.50 | Loftmyndir ehf |
| 08/05/2015 | kite | 42.9 | 0.013 | RVB | 0.06 | this study |
| 17/05/2016 | Kite | 46.2 | 0.012 | RVB | 0.03 | this study |
| 15/05/2017 | kite | 51.6 | 0.014 | RVB | 0.03 | this study |
| 27/07/2017 | 1710-08-0183 | 1,205 | 0.10 | RVB | 0.10 | Loftmyndir ehf |
| 24/05/2018 | drone | 38.4 | 0.009 | RVB | 0.05 | this study |
| 16/05/2019 | drone | 36.4 | 0.010 | RVB | 0.03 | this study |
| 18/07/2019 | 1911-05-0083 | 1,316 | 0.10 | RVB | 0.10 | Loftmyndir ehf |
| 31/08/2021 | drone | 44.1 | 0.012 | RVB | 0.03 | this study |
| 18/05/2022 | drone | 46.8 | 0.012 | RVB | 0.03 | this study |
| 12/06/2023 | drone | 36.6 | 0.009 | RVB | 0.03 | this study |
The landward limit of boulder barrier (corresponding to the base of the back slope) was considered as the coastline and was used to quantify retreat rates. Following the digitization of the coastline on these images, the barrier mobility was calculated using the Digital Shoreline Analysis System (DSAS) (Moore, 2000; Himmelstoss et al., 2024) along 64 transects, each around 5 m apart. In accordance with the statistical methods advocated by Fenster et al. (1993), coastal shoreline change rates were quantified using simple linear regressions models (LRM) for each series of data obtained along the transects.
3.2 Hydrodynamic data and processing methods
3.2.1 Waves and tide dataset
The analysis of hydrodynamic conditions is based on in-situ wave and tide records along the Reykjanes Peninsula (Figure 1b). Wave observational data come from the Garðskagadufl and Grindavíkurdufl Waverider buoys located off Sandgerði and Grindavík harbours, respectively (Figures 1b and 5). These two buoys were chosen because of their proximity to the study area. Given the coastal configuration of SW Iceland, a difference in sea states at the wave buoys is expected. As the Valahnúkamöl barrier is protected by the tip of Reykjanesta, it is not directly subject to incoming S-SE waves (see wave roses in Figure 1b). Under these conditions, some of the recordings from the Grindavíkurdufl buoy are not representative of the wave regime affecting the Valahnúkamöl barrier. Additionally, the Reykjanes submarine ridge (Figure 1b) may play a role in attenuating westerly waves as they propagate east of the tip of the Peninsula. This effect explains the lower wave height values recorded at Grindavíkurdufl compared with Garðskagadufl (again, see wave roses in Figure 1b). The recordings from the Garðskagadufl buoy are therefore much more representative of the westerly wave conditions impacting the Valahnúkamöl barrier.
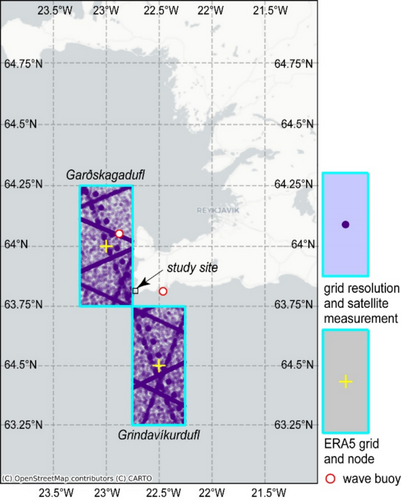
Both buoys provided hourly statistical data on significant wave height Hs and the average zero-crossing period Tz since March 2015 (Table 3). They are available in two formats: raw data called NRT (Near-Real-Time), which is updated almost daily, and reprocessed data called REP (Reprocessed), which is uploaded online with a few months' delay. The NRT data were cleaned using the method proposed by the Copernicus Marine In Situ Team (2020), then combined with the REP. The series obtained after merging covers the topo-morphological monitoring period, from March 2015 to July 2023. However, there are gaps in these observations, which have been filled using modelled data from the ERA5 meteoro-oceanic reanalysis produced by the ECMWF. These model data, available since 1979, have a large spatial resolution of 0.5 by 0.5 degrees for oceanic parameters (Figure 5), and 0.25 degrees for atmospheric parameters. Validation against in-situ data and altimeter data is performed to evaluate the consistency of these model results with observations.
| Wave buoys | |||||
|---|---|---|---|---|---|
| Sites | Longitude | Latitude | Depth | Recording period | Lack of data for the observation period |
| Garðskagadufl | 64°3,150´N (64.0525°N) |
22°52,62´W (22.877°W) |
60 m | Since 01/03/2015 | 14% (440 days) |
| Grindavíkurdufl | 63°48,80´N (64.8133 N) |
22°27,63´W (22.4605’W) |
62 m | Since 01/03/2015 | 6% (172 days) |
| Wave modelling ERA5 | |||||
|---|---|---|---|---|---|
| Extraction point | Node/model resolution | Node/model resolution | Depth | Period of simulation | |
| ERA5-NW (Garðskagadufl) | 64°N | 23°W | −203 to ~0 m (med: 97 m | Since 1979 | |
ERA5-SW (Grindavik) |
63.5°N | 22.5°W | −324 to −107 m (med: −235 m) | Since 1979 | |
| Tide gauge stations | |||||
|---|---|---|---|---|---|
| Sites | Port location in long. | Port location in lat. | |||
| Grindavík | 63.839°N | 22.423°W | Since 1994 | 22% (682 days) | |
| Tide modelling FES2012 | |||||
| FES2012-North | 64.052°N | 22.877°W | |||
| FES2012-South | 63.813°N | 22.46°W | |||
Satellite altimeter observations were used to validate the significant wave height parameter Hs from the ERA5 reanalysis. These Hs observations are from the ESA Sea State Climate Change Initiative, version 3, RA Level 2P Product (Sea State CCI v3). This multi-mission dataset includes Hs records from the satellite missions Jason 1, 2 and 3 (NASA, CNES), ENVISAT (ESA), Cryosat 2 (ESA), Saral (ISRO, CNES) and Sentinel 3a (ESA). The data cover the period from 2002 to 2021 and concern the almost entire globe. However, for the purposes of this study, we have only used measurements corresponding to the grid of the ERA5 model (0.5° × 0.5°) to maintain the same resolution. These spatial areas are themselves located close to the wave buoys (Figure 5).
3.2.2 Statistical parameters for model validation
3.2.3 Wave modelling validation
ERA5 results and observations (in-situ and satellite altimeter data) are presented in Figure 6a (scatter diagram and quantile-quantile diagrams). Overall, these comparisons show good consistency between the model and observations. The correlation and random error statistics between wave height (Hs) ERA5 data and observations at the Garðskagadufl buoy indicate satisfactory model performance (R = 0.95, RMSE = ~0.51 m and SI of 17.44%, Figure 6a). Looking at the systematic error, the model overestimates Hs (NMB = 11.1%), but underestimates observed Hs over 9 m (Figure 6b). The correlation and random errors between ERA5 and the in-situ dataset from the Grindavíkurdufl buoy show lower values (i.e., R = 0.92, RMSE = 0.8 m, SI = 23.27%, Figure 6c). Globally, the model overestimates the field measurements (NMB = 21.14%), particularly above ~11 m (Figure 6d). These positive biases can be partially explained by the buoy location relative to the ERA5 node locations (Figure 5), which are in shallower waters and closer to the coast (Table 3 and Figure 5). In this comparison the effect of wave refraction from deep water into shallower waters is omitted and likely to have more influence for the Grindavíkurdufl compared to the Garðskagadufl. Moreover, ERA5 reanalysis is known to underestimate wind speeds in excess of 25 m.s−1 and therefore extreme wave conditions (Alday et al., 2021).
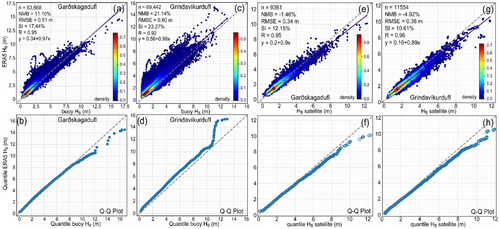
Satellite measurements allow us to overcome limitations due to buoy positioning and validate the ERA5 model at the same grid resolution since the satellite data selected for the validation procedure correspond to measurements taken within the same 0.5° by 0.5° spatial extent as the ERA5 model (Figure 5). The scatter diagrams show much better relationships than those previously obtained with buoy records for both sectors. Near Garðskagadufl, the R reaches 0.95 significance, the RMSE is ~0.34 m, the NMB is −1.46%, while the SI dispersion is reduced to 12.15% (Figure 6e). Near Grindavíkurdufl, the R is 0.96, the RMSE 0.38 m, the NMB –4.92% and the SI 10.61% (Figure 6g). In both cases, extreme values (>4 to 5 m) are underestimated by the model (Figure 6f,h).
3.2.4 Tide model validation
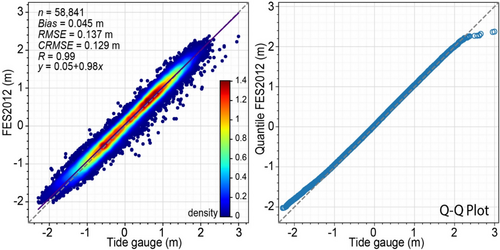
Comparison with the Grindavík tide model and tide gauge measurements showed a good correlation (R = 0.99) but with an RMSE of around 14 cm, for a bias of 4.5 cm and a CRMSE of ~13 cm. This can be explained by the model's poor ability to reproduce extreme water levels (see Q-Q Plot in Figure 7). On the other hand, the model overestimates the lowest values. These biases could be partly explained by a poor representation of some modelled tidal constituents interacting with the Reykjanes ridge deformations of the earth's surface due to subsidence (see Section 2.2.), the intense volcano-seismic activity near Grindavík as well as due to wave setup at the location of the tide gauge in Grindavik harbour. These deformations can reach several decimetres, as was the case during the earthquake of 11 November 2023, which caused subsidence of around 20 cm at Grindavík harbour.
3.2.5 Hydrodynamic analysis
The comparison of wave data (height, period and direction) for the two buoys of Garðskagadufl and Grindavíkurdufl over the topomorphological monitoring period (2015–2023) indicates that the highest waves (Hs > 5 m) from SW are more frequent in Garðskagadufl than in Grindavíkurdufl, while SE waves are much less frequent (Figure 8a). These differences are linked to the position of the two buoys in relation to the tip of the Reykjanest Peninsula, which is continued underwater by the Reykjanes ridge, which has an impact on wave propagation.
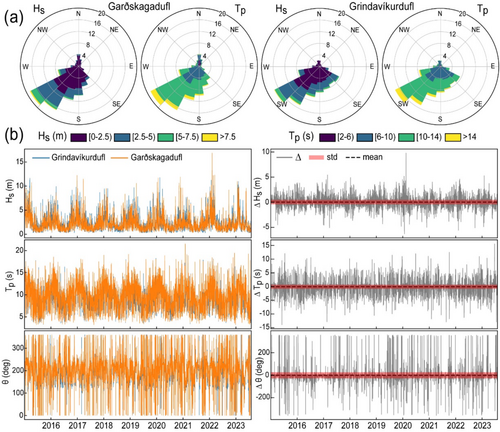
The mean and standard deviation of the differences in wave height Hs (0.034 ± 0.88 m), period Tp (−0.038 ± 1.48 s) and direction θ (−0.865° ± 54.99°) illustrate these differences (Figure 8b). The two parameters, height and direction, exhibit the greatest statistical dispersion as indicated by the standard deviation (Figure 8b).
An analysis of hydrodynamic conditions over the two periods corresponding to the topo-morphological measurements between 2015 and 2023, and of long-term shoreline changes between 1978 and 2023, was carried out to characterize annual winter storm conditions. To this end, an inventory of the extreme storms was achieved using the 99.9th percentile significant wave height (Hs) in accordance with recommendations made by Grieco & DeGaetano (2019). For both buoys of Grindavíkurdufl and Garðskagadufl, the 99.9th percentile was calculated over the periods 2015–2023 and 1979–2023 (Table 4). Following the methodology of Masselink, Scott, et al. (2016), the storm duration corresponds to the time duration during which Hs exceeds the 95th percentile for every detected and independent extreme storm event (Table 4).
| Extreme storm | Storm duration | Morphogenetic events | ||||||||
|---|---|---|---|---|---|---|---|---|---|---|
| Hs = 99.9th | F = 99.9th | Hs = 95th | Hs = 97th | WL = 97th | ||||||
| 2015–2023 | 1979–2023 | 2015–2023 | 1979–2023 | 2015–2023 | 1979–2023 | 2015–2023 | 1979–2023 | 2015–2023 | 1979–2023 | |
| Grindavíkurdufl | 9.68 | 10.3 | 773.51 | 742.74 | 5.26 | 5.64 | 5.97 | 6.3 | 1.57 | 1.53 |
| Garðskagadufl | 10.08 | 9.46 | 663.12 | 657.88 | 5.1 | 5.08 | 5.84 | 5.72 | ||
Considering that morphogenetic events inducing a significant morphological impact on boulder barriers occur when a storm is combined with a spring tide (McCall et al., 2015; Orford et al., 1995; Orford, Carter, & Forbes, 1991; Stéphan, Suanez, & Fichaut, 2010; Suanez et al., 2022), a statistical analysis of the simultaneous occurrence of the wave height Hs and water level exceeding the 97th quantiles was completed. The threshold of 97th quantiles was chosen according to the methodological approach of Suanez et al. (2022, 2023) demonstrating the best relation between hydrodynamic conditions and morphological changes, as a response to the most morphogenetic event impacts. For both analysis periods, the 97th percentile thresholds of Hs and WL are indicated in Table 4. Considering that the most energetic combined events can lead to massive overwash and significant retreat of the barrier, we also identified as high-energy morphogenetic events those periods combining a water level exceeding the 97th quantile and a wave energy flux greater than the 99.9th percentile.
4 RESULTS
4.1 Annual morphological and sediment budget changes
As shown in Figure 9b, the net volume changes between erosion and accretion during the whole survey period are balanced. The evolution of this sediment budget shows an important interannual variability. Morphosedimentary changes in 2021–2022 remain the most significant (±13,000 m3), and contrast with those measured in 2015–2016, 2017–2018 and 2022–2023, where changes were much lower (<±3,000 m3). Between these two extreme situations, the 3 years 2016–2017, 2018–2019 and 2019–2021 show accretion/erosion budgets evolving between ±5,000 m3 and ±8,500 m3 (considering the last period 2019–2021 covers two years of changes).
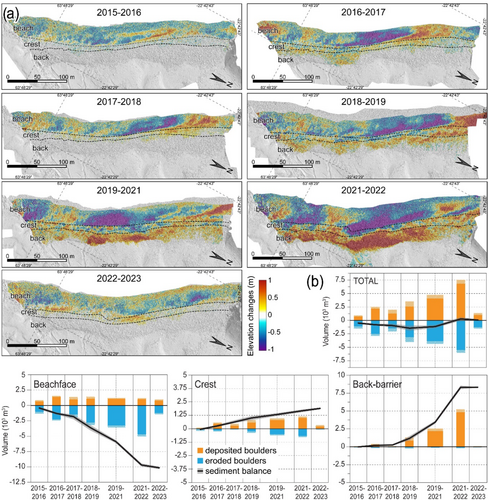
When we look at the evolution of the annual sediment budget within different sections of the barrier, i.e., the beachface, the crest and the back-barrier, we see that the beachface has undergone significant changes every year, resulting in a cumulative sediment deficit of around −10,000 m3 over the entire survey period (Figure 9b). In contrast, as shown by the evolution of the back-barrier sediment budget, morphosedimentary changes in this section are much more episodic. The first 3 years between 2015 and 2018 show no change, and this is also the case in 2022–2023. Conversely, between 2018 and 2022, this section experienced a major sediment gain, particularly in 2021–2022, with a positive sediment budget of around +5,200 m3. It can be assumed that much of the boulder lost from the beachface was transported to the back-barrier under cross-shore displacement by overwash. However, longshore boulder displacement patterns are also observed along the beachface (Figure 9a), where erosion and deposition zones shifted northward during the whole survey period. This observation reflects longshore sediment transfers in accordance with wave refraction at the coast (see Figure 3a).
Finally, the sediment budget at the barrier crest showed a slight increase over the entire survey period, reaching around +1,900 m3 (Figure 9b). This sediment gain between 2018 and 2022, and to a lesser extent during 2016–2017, is mainly linked to discrete/sluicing overwash associated with a lowering/retreating of the crest (Figure 9a). For the two years 2017–2018 or 2022–2023, the material gain associated with a rise in the crest is rather linked to overtopping, which is also the result of cross-shore transfers of boulders between the beachface and the crest.
4.2 Pluri-decadal time-scale shoreline changes
The Valahnúkamöl boulder barrier experienced an average landward retreat of −13.7 m over the period 1978–2023 (Figure 10a), even if the shoreline changes show significant variability depending on the period. From 1978 to 1989, the shoreline changes induced an average retreat of about −1.7 m before increasing up to −6.5 m between 1989 and 2008 (Figure 10c). The following period 2008–2019 was characterized by shoreline stability with no major changes before the barrier once again underwent an important average retreat of −6.1 m from 2019 to 2023 (Figure 10c).
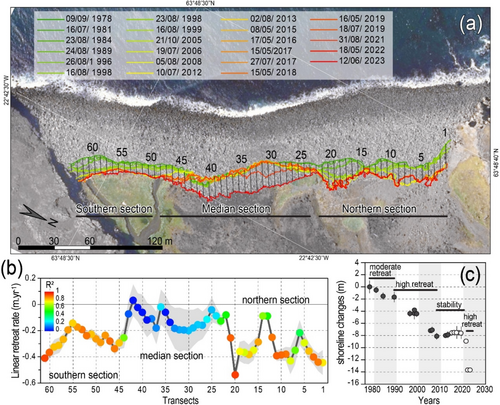
Shoreline changes can be distinguished into three different sections along the barrier. In the southern part, the barrier retreated by −14 m with rates ranging between −0.2 and −0.4 m.yr−1 (Figure 10b). The high R2 values calculated from the LRM reflect a constant and linear retreat by rollover during the whole period. In the median section, the rates of retreat range between 0 and −0.2 m.yr−1 indicating the barrier was relatively stable between 1978 and 2019 despite a total landward retreat of about −4 m. In this section, the most shoreline retreat of about −10 m was recorded between 2019 and 2022 and was followed by no changes between 2022 and 2023 (Figure 10c). The low R2 and high RMSE values underline the high temporal variability of this retreat and the significant impact of a sluicing overwash event during the winter of 2021–2022 (Figure 10b). In the northern section, significant shoreline changes averaging −0.35 m.yr−1 are localised where washover fans were deposited.
4.3 Significant morphogenetic episodes vs morphological changes
The identification of significant morphogenetic episodes was based on the analysis of the hydrodynamic conditions (wave and water level) for the two sites of Grindavíkurdufl and Garðskagadufl over the periods 2015–2023 (Figure 11) and 1979–2023 (Figure 12).

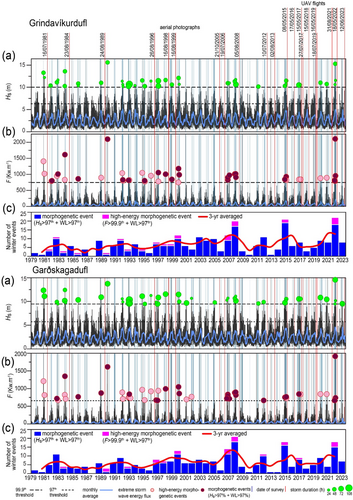
For the first period 2015–2023, according to wave height, the winters of 2015 and 2022 were characterised by the high frequency of significant and long-duration storm events where Hs exceeded the 99.9th percentile. Conversely, winters 2018 and 2021 were calmer with no event reaching this threshold. Between these two extreme situations, winters 2017, 2019, 2020 and 2023 were characterized by 1 to 3 significant storm events (Figure 11a). In terms of wave energy, when F exceeded the 99.9th percentile, some of these episodes were particularly powerful, for instance in 2015, 2017, 2020, 2021 and 2022. Contrastingly, the 2016, 2018, 2019 and 2023 winters were calmer (Figure 11b). In 2015 and 2022, winters were characterized by more energetic events, with 3 to 4 events respectively. During these winters, morphogenetic events characterized by joint occurrence of WL + Hs exceeding the 97th percentile (see blue lines in Figure 11), occurred more often, likely to overwash the barrier, i.e., 14 to 22 events (see tables in Data S1 and S2). Conversely, the occurrence of such events was lower in the winters of 2016, 2018, 2019 and 2023, with 2 to 6 morphogenetic events depending on the period. In 2017 and 2021, 8 to 20 morphogenetic events occurred (see tables in Data S1 and S2).
In short, the identification of significant morphogenetic events from wave and tidal conditions shows three hydrodynamic contexts distinguishing the most morphogenetic winters in 2015 and 2022, which contrast with calmer winters in 2016, 2018, 2019 and 2023, and with winters characterized by intermediate conditions in 2017, 2020 and 2021. These results are consistent with the evolution of the sediment budget for each survey period (Figure 9). The most morphogenetic winter 2022 is well represented by the morphological changes in the Valahnúkamöl barrier between 08/31/2021 and 05/18/2022, which remain the most significant changes over the entire survey period. Conversely, the relatively small morphological changes experienced in the years 2015–2016, 2017–2018 and 2022–2023 (see Figure 9) are well in line with the calmer hydrodynamic conditions that occurred during these periods. Similarly, the moderate morphological changes surveyed in 2016–2017 and 2019–2021, also indicate intermediate hydrodynamic conditions between the two previous extreme situations. It should be noted that the higher sediment budgets (in terms of erosion and accretion) between 2019 and 2021 accumulate the morphogenetic impact of two consecutive winters. In 2018–2019, no clear relationship is observed between hydrodynamic conditions and morphological changes. Indeed, the sediment budget calculated between 05/24/2018 and 05/16/2019 show important morphological changes (Figure 9), while the 2019 winter was calmer in terms of wave energy.
The hydrodynamic conditions analysis between 1979 and 2023, shows that the duration of extreme storm events (Hs > 99.9%) is longer in the north of the Peninsula at Garðskagadufl (53.2 h) compared to the southern station at Grindavíkurdufl (46.4 h) (Figure 12). The frequency of extreme storms has been generally high over this period, with 44 and 43 episodes recorded between the winter periods of 1980 and 2023 at the Garðskagadufl and Grindavíkurdufl buoys, respectively. This corresponds to an average of a single extreme event each winter. However, the temporal distribution of these events reveals some interannual variability. The periods between 1981 and 1984, 1992 and 1993, 1995 and 2000, 2007 and 2008 and 2020 and 2022 show consecutive winters with a high frequency of extreme storms. In contrast, the periods 1987–1988, 2001–2006 and 2009–2014 correspond to a series of winters with no extreme storms. Three episodes, characterized by significant wave energy fluxes, concern the storms of 05/01/1984, 09/01/1990 and 08/02/2022, with F values for Grindavíkurdufl estimated at 1612 kW.m−1, 2094 kW.m−1 and 2,104 kW.m−1, respectively. At Garðskagadufl, F values reached 1,348 kW.m−1, 1,614 kW.m−1 and 1911 kW.m−1 during these three extreme storms, respectively. The extreme storm of 08/02/2022 was the most energetic event of the past four decades.
Regarding the morphogenetic events, a high frequency is also noted, with a total of 338 and 372 joint occurrences of high spring tide water levels and strong storm wave heights during the period 1979–2023 for Garðskagadufl and Grindavíkurdufl, respectively. The average frequency is approximately 7 morphogenetic events per winter, suggesting a high probability of crest reshaping due to overtopping or boulder transfer via overwash, depending on the wave energy during each episode. The frequency of morphogenetic events also shows significant interannual variability. The winter seasons of 2008, 2015 and 2022 experienced more than 20 morphogenetic events, whereas the winters of 1981, 2010, 2013 and 2014 recorded only one event, with none occurring in the winter of 1988. Between 1979 and 2023, a total of 25 high-energy joint events were recorded (Figure 12). Such extreme episodes are likely to have induced barrier retreat through overwash.
The mesoscale variability in the frequency and intensity of storm events combined with high spring water levels results in variable retreat rates of the Valahnúkamöl barrier. The analysis of average landward migration rates over the period 1978–2023 has revealed four distinct phases characterized by variable shoreline changes in response to storm conditions (Table 5) which generate barrier overwash and are responsible for shoreline retreat through rollover processes. The first phase corresponds to a − 1.7 m barrier retreat during the period 1978–1989 (Figure 10c), associated with a limited number of extreme storms (Figure 12), among which the event of January 5, 1984, is the most energetic. The second phase is characterized by a barrier retreat of −6.5 m between 1989 and 2008 (Figure 10c). A substantial number of extreme storms and morphogenetic episodes were identified during this period (Figure 12). On January 9, 1990, one of the most energetic events in the past four decades was observed and partially explains the shoreline retreat during this period. This phase concludes with the winters of 2007 and 2008, which were also marked by a succession of combined events with highly energetic waves associated with extreme water levels (Figure 12). Between 2008 and 2019, the third phase corresponds to a period of shoreline stability (Figure 10c), attributed to a limited number of low-energy storms, except during the winter of 2015 and numerous winters without any storms. Finally, the fourth phase shows an important barrier retreat of −6.1 m between 2019 and 2022, primarily caused by the series of extreme storms during the winter of 2022, particularly the event of February 8, 2022.
| Phases | |||||
|---|---|---|---|---|---|
| 1978–1989 | 1989–2008 | 2008–2019 | 2019–2022 | ||
| Mean shoreline change (in metres) | −1.7 | −6.5 | 0.5 | −6.1 | |
| Nb. of extreme storms | Garðskagadufl | 9 | 24 | 6 | 5 |
| Grindavíkurdufl | 9 | 23 | 5 | 6 | |
| Extreme storm duration (in hours) | Garðskagadufl | 485 | 1,262 | 406 | 292 |
| Grindavíkurdufl | 459 | 1,139 | 277 | 215 | |
| Nb. of morphogenetic events | Garðskagadufl | 49 | 167 | 79 | 43 |
| Grindavíkurdufl | 50 | 180 | 86 | 56 | |
| Nb. of high-energy morphogenetic events | Garðskagadufl | 4 | 11 | 5 | 5 |
| Grindavíkurdufl | 4 | 14 | 4 | 3 | |
5 DISCUSSION
5.1 Storm-induced morphological changes
The results of this study show a good consistency between the occurrence of morphogenic events combining storm waves and high spring tide levels, and the extent of morphological changes in the Valanukamöl barrier. As a consequence, the volume of boulders and the ways in which they are displaced show strong temporal variability, depending on the intensity and/or frequency of morphogenetic events. In general, these events generate large volumes of boulders displaced from the beachface/crest sections to the back-barrier section, resulting in massive washovers. These cross-shore sediment transfers primarily control the barrier's morphological functioning.
Long-term analysis of such morphogenetic events revealed that the extreme storm of February 8, 2022, was the most impacting for the last four decades along the Reykjanes Peninsula coast (Figures 11 and 12). This event appears to be responsible for a complete overwash of the Valahnúkamöl boulder barrier, causing a landward transfer of a large volume of boulders, as demonstrated by the 2021–2022 DoD (Figure 9). However, overwash also seems to be caused by lesser energetic events. For example, the two extreme storms on January 8, 2020, and November 26, 2020, were associated with neap tide conditions, with wave energy flux values that were half those recorded on February 8, 2022. However, the topo-morphological changes measured between 2019 and 2021 showed important landward sediment transfers, demonstrating that extreme wave conditions and spring tide are not systematically required to generate overwashing of the barrier (Figures 11 and 12). During morphogenetic events with moderate wave energy flux, topo-morphological changes appear to be limited to individual boulder movements deposited on the crest. These sediment transfers were associated with discrete overwash episodes promoting overtopping. This process is well illustrated by the DoDs produced for the periods between May 2015 and May 2016, May 2017 and May 2018 and May 2022 and June 2023 (Figure 9). As shown by the analysis of hydrodynamic conditions in the Grindavíkurdufl and Garðskagadufl sectors, storms did not generate any high-energy morphogenetic events during these three periods (Figures 11 and 12). The topo-morphological changes were limited to the deposition of boulders projected by waves near the seaward limit of the crest.
This periodicity of morphological changes measured on the Valahnúkamöl barrier fits well with the activation periods of coastal boulder deposits (CBD) monitored from 2015 to 2019 on the rocky coast of the Reykjanes Peninsula (Autret et al., 2023). Based on the volume, elevation and inland distance of the transported CBDs at the cliff tops of Kerling, Reykjanesta, Katlaraun and Selatangar, Autret et al. (2023) demonstrated a low activation of CBDs in 2015–2016, 2016–2017 and 2017–2018, while the greatest changes occurred in 2018–2019. Nevertheless, the morphological and hydrodynamic survey now underway for 10 years on the Reykjanes Peninsula is still too short to be able to draw any trends on the long-term evolution of storms and their impact on coastal morphology. To address this issue, we would need to accumulate at least 30 to 40 years of survey data, as is the case at Narrabeen-Collaroy beach in Sydney, Australia (Turner et al., 2016) or on the Hasaki coast in Japan (Banno et al., 2020).
5.2 Boulder displacement patterns
As previously indicated, while cross-shore boulder displacement remains the main dynamic of sediment transfers, the results of this survey have also highlighted the importance of longshore boulder mobility, especially along the beachface, which is consistent with the longshore drift generated by low wave refraction relative to the shoreline. In addition, contrasting with the crest and the back-barrier sections where boulder displacements are more episodic, the beachface has undergone morphological changes every winter, regardless of the hydrodynamic conditions, meaning the annual wave energy is sufficient to displace boulders along the barrier. This reflects the high-energy hydrodynamic context of the Southwestern coasts of Iceland and confirms the significant morphogenetic features of meteo-oceanic forcing.
The beachface also experiences significant changes despite the large size of boulders reaching a D50 of b-axis of ~0.71 m, with a max and a min of 2.2 m and 0.33 m, respectively. These findings contrast with data obtained from the boulder beaches at Oia and Laxe Brava in Galicia (NW Spain), where topo-morphological surveys have shown that beachface changes were very low to moderate despite slightly smaller boulder sizes, i.e., D50 of b-axis ranging from 0.6 to 0.66 m in both beaches respectively (Pérez-Alberti et al., 2012; Pérez-Alberti & Trenhaile, 2014, 2015; Gòmez-Pazo et al., 2019, 2021). Even during the winter of 2013–2014, which had the highest storminess in recent decades along the entire western coast of Europe (Masselink, Scott, et al., 2016), including the northern coast of Spain (Pérez-Alberti & Trenhaile, 2015), the authors reported that a large proportion of the boulders forming these beaches did not move. Off the Galician coast, the hydrodynamic conditions are significantly more moderate than on the SW coast of Iceland. For example, wave heights > 5 m account for 3% of the total incident wave regime in Galicia (Pérez-Alberti & Trenhaile, 2015), compared to ~16% close to our study area (see Figure 8). In addition, the Oia boulder beach lies on a broad gently sloping rocky platform that mitigates storm waves (Pérez-Alberti et al., 2012), and presents surface roughness that limits individual boulder movement through sheltering, interlocking and burial effects (Gòmez-Pazo et al., 2021). Conversely, the Valahnúkamöl barrier lies in a steeper foreshore platform with no intertidal rocky outcrops (such as reefs or islets) capable of significantly attenuating storm waves or obstructing boulder movement. Therefore, boulder movements on this barrier are more uniform and mainly explained by hydrodynamics, as a result of direct wave impacts, while the local factors such as boulders' locations on the beach, their relationship with surrounding boulders, their size or shape, seem to play a secondary role.
Overall, this study highlights the changing nature of large boulder accumulations already demonstrated by several authors (Oak, 1984, 1986; Etienne & Paris, 2010; Chen et al., 2011; Pérez-Alberti et al., 2012; Pérez-Alberti & Trenhaile, 2014, 2015), and reveals that these morphological changes are as extensive and frequent as that of gravel/pebble beaches/barriers, as soon as hydrodynamic conditions allow.
5.3 Methodological limitations
If the results obtained from the 2015–2023 survey generally show a good correspondence between the hydrodynamic conditions (Figure 11) and the morphological changes (Figure 9), an exception has been noticed for the winter of 2019. As previously indicated by Autret et al. (2023), the main stormy conditions -in terms of morphogenetic events- recorded during this period occurred from February 20 to 22, 2019. While the topo-morphological monitoring revealed important landward transfers of boulders by overwash, no major storms combined with high spring tide water levels were detected during these three-day period. This observation highlights the limitations of the approach and the potential bias in data used in the analysis conducted to reconstruct hydrodynamic conditions at the Valahnúkamöl barrier. Firstly, the wave data we used were recorded offshore 13 km to the east (i.e., Grindavíkurdufl buoy) and 25 km to the north (i.e., Garðskagadufl buoy) off the study site (Figure 1). These data show significant differences in terms of significant wave height, period and direction (see Figure 8), suggesting strong refraction and/or diffraction effects of the incoming waves caused by the morphology of the nearshore area, particularly the submarine topographic features of the Reykjanes Ridge (Appelgate & Shor, 1994; Höskuldsson, Hey, & Kjartansson, 2007; Keeton et al., 1997; Laughton, Searle, & Roberts, 1979; Parson et al., 1993). To better understand these effects on wave propagation, a more detailed analysis of nearshore and coastal hydrodynamic processes would be necessary, as suggested by Autret et al. (2023). Secondly, a significant bias exists concerning the tide dataset for the period 2015–2023, as the FES2012 model was employed to fill the gap in tide gauge records between April 2017 and March 2019 (see methodological section). As shown by the QQ-plot in Figure 7b, the modelled tide data underestimates water levels for extreme values, which may explain why, according to our approach, no joint wave/tide events were identified during the winter 2019. The bias caused by the use of modelled tide dataset may also have limited the detection of some extreme events during the period from 1979 to 2023, for which water levels are derived from the FES2012 model.
Moreover, as noted by other authors (Almeida et al., 2012; Grieco & DeGaetano, 2019; Harley, 2017; Kümmerer et al., 2023), it is crucial to question the relevance of thresholds based on extreme value distributions (such as % excess or percentiles) that are employed to identify storm events or morphogenetic episodes combining storm waves and high spring tide levels. In this study, morphogenetic events were defined using a statistical analysis of the simultaneous occurrence of significant wave height (Hs) and water levels exceeding the 97th percentile. The relevance of this threshold has been demonstrated in a sandy beach/dune system (i.e., Vougot beach) and a gravel/pebble barrier (i.e., Sillon de Talbert) situated in Brittany - Western France (Suanez et al., 2022, 2023). At this location, the hydrodynamic conditions are less energetic, and the frequency, duration and intensity of storms are lower than those on the southwest coast of Iceland (Betts et al., 2004; Schinke, 1993). For instance, at Grindavíkurdufl, the number of morphogenetic events detected from 1979 to 2023 reached 372, corresponding to a frequency of 7 events per year, while 8 morphogenetic events were detected between 2012 and 2020 on the barrier of the Sillon de Talbert in Western France, i.e., 1 event per year (Suanez et al., 2022), and 11 events from 2004 to 2022 on the sandy beach/dune system of Vougot, i.e., 0.6 event per year (Suanez et al., 2023). These results emphasize once again the significant energetic hydrodynamic context of the southwest coast of Iceland where the high frequency of winter storms promotes joint occurrences of giant waves and high spring tide water levels. These results may also indicate that the approach based on a threshold of 97th percentile, which was calibrated for the Brittany coast, might not be as relevant in the energetic coastal environment context of southwestern Iceland. However, to calibrate a threshold corresponding to the hydrodynamic conditions of the Valanukamöl barrier, it would be necessary to increase the frequency of the survey to monthly, or even bi-monthly, as is the case for the two sites of the Vougot beach and the Sillon de Talbert.
6 CONCLUSION
The Reykjanes Peninsula consists of an excellent natural laboratory for studying the morphogenetic impact of storms on coastal barriers due to the high frequency of high-energy storm events in this region. This high storm frequency increases the likelihood of joint occurrences of high spring tide levels and giant storm waves that may lead to flooding of coastal barriers. These morphogenetic flooding events are accompanied by overwash processes that generate landward displacement of the barriers through rollover. This is shown by the annual topo-morphological survey undertaken since 2015 on the Valahnúkamöl barrier, whose main result points to the good relationship between extreme hydrodynamic conditions and morphosedimentary changes. Analysis of these morphological changes over the last four decades (1979–2023) indicates that the storm of January 8, 2022, remains the most impacting episode over the last four decades on the Reykjanes Peninsula coast. The main morphological functioning of the barrier corresponds to episodic cross-shore displacements inland, interspersed with long periods of stability that favour crest recovery by overtopping. This behaviour is similar to that of gravel/pebble barriers and highlights that accumulations of “mega” boulders (i.e., 256 to 4,096 mm) behave in the same way when wave energy is sufficiently efficient. These results are therefore invaluable in improving our understanding of the morphodynamics of accumulations consisting of boulders, an issue that has remained understudied until now. On a regional scale, this work extends the CBDs survey also undertaken since 2015 along the Reykjanes coast, by broadening the scope of analysis to better characterise the morphological impact of storms on a wide range of coastal types. Ten years of the survey is still too short to detect a possible trend in the morphosedimentary response to changing meteorological and hydrodynamic conditions at the latitudes of SW Iceland. However, in the context of climate change, it would appear crucial to continue this survey, while attempting to increase the frequency of topo-morphological measurements.
AUTHORS CONTRIBUTION
Pierre Stéphan was in charge of the morphological monitoring and the data collection. He processed the morphological data by creating Digital Elevation Models (DEM) with Structure-from-Motion and Multi-View Stereo (SfM-MVS) processing. He conceived of the public release and publication of the morphological dataset and conceptualized and led the writing of the manuscript.
Antoine Le Doeuff was in charge of the hydrodynamic analysis and participated in the 2023 field campaign for the collection of morphological data. He processed the statistical treatments of wave and tide. He participated in the writing of the manuscript.
Serge Suanez initiated the monitoring program. He was in charge of finding all the necessary financing for the realization of the project. He participated in the field campaign for the collection of morphological dataset and supervised/helped in the writing of the manuscript.
Guillaume Dodet supervised and helped with the processing of hydrological data (wave and tide) with Antoine Le Doeuff, and provided useful advices through his expertise in coastal hydrology. He participated in the writing of the manuscript.
David Didier, Ronan Autret, Jérôme Ammann and Clémentine Fanton participated in the annual field campaigns for the collection of morphological data. They helped with the processing of morphological data with Pierre Stéphan.
Sigurður Sigurðarson provided wave and tide data set as responsible for the collection and archiving of these data in the Icelandic Road and Coastal Administration (IRCA). He provided useful scientific advices through his good knowledge of the study site and his expertise in marine and coastal hydrology.
ACKNOWLEDGEMENTS
This research was supported by the “Laboratoire d'Excellence” LabexMER (ANR-10-LABX-0019) and the Interdisciplinary graduate school for the blue planet ISblue (ANR-17-EURE-0015) and co-funded by a grant from the French government under the program “Investissements d'Avenir”, and the region of Brittany, for the period 2014–2018. It was also funded by the “Institut Paul Emile Victor” (IPEV - French Polar Institut) through the research program EXTREMEVENT (Arctic – Project number 1216) for the period (2019–2024). Funding was also provided by the National Research Council of Canada, including a Northern Supplement Grant, the Northern and Arctic Coastal Research Lab at UQAR, Québec-Océan and the Institut France-Québec pour la coopération scientifique en appui au secteur maritime (IFQM). Funding support was also provided by the Chaire de Recherche en Géoscience Côtière and the Fonds de recherche du Québec – Nature et technologies (Postdoc Grant, Université du Québec à Rimouski). We thank Peter Weiss from the University Centre of Westfjords (Ísafjörður) for providing data and logistic help. We also acknowledge the help of Björk Sverrisdottir and Magnùs for their kindness and the always very warm welcome in Grindavík.
CONFLICT OF INTEREST STATEMENT
The authors declare on their honour that they have no conflicts of interest to report.
PERMISSION TO REPRODUCE MATERIAL FROM OTHER SOURCES
The authors grant their permission to reproduce material from other sources.
Open Research
DATA AVAILABILITY STATEMENT
The tide gauge in Sandgerdi Harbor is owned by the harbor, operated by MogT ehf. and overseen by the Icelandic Road and Coastal Administration (IRCA) (https://vedur.mogt.is/harbor/?action=Stations&harborid=8). It samples on 1 Hz and stores the average of measurements over 1 min every 10 minutes.
The Grindavik wave buoy located at 63°48.80’N; 22°27.63′E, in 62 m water depth, is owned and operated by the Icelandic Road and Coastal Administration (IRCA) (https://www.vegagerdin.is/vs/StationsDetails.aspx?ID=100). It registers significant wave height and mean wave period every hour and recently every half an hour.
The Icelandic Road and Coastal Administration (IRCA) runs the MIKE21 SW shallow water wave model from DHI for the coastal area close to Grindavik harbour and the study site (https://www.sjolag.is/grunnslodarsvaedi/grindavik/). The model is forced by wave hindcast date from the European Centre for Medium- Range Weather Forecasts (ECMWF) on the boundary as well as astronomical tides for the area included in the model.
Modelling offshore wave data (WW3 HOMERE) are available in free access through the IFREMER web site: https://marc.ifremer.fr/produits/rejeu_d_etats_de_mer_homere, following a specific procedure: https://forms.ifremer.fr/lops-oc/marc-homere/
Shoreline dataset produced in this study is available for free access on the INDIGEO data infrastructure under this reference: Stéphan P., Suanez S., Autret R., Didier D., Ammann J., Fanton C. (2024). Données de suivi pluriannuel du trait de côte du site de Valahnúkamöl (Reykjanes, Islande). INDIGEO. 10.35110/c00c0709-07d4-4ae7-9d54-72dd1654512a
Orthophotos and Digital Elevation Models produced in this study is available for free access on the INDIGEO data infrastructure under this reference: Stéphan P., Suanez S., Autret R., Didier D., Ammann J., Fanton C. (2024). Suivi pluriannuel du cordon de blocs de Valahnúkamöl (Reykjanes, Islande) à partir de modèles numériques de terrain (MNT) et d'orthophotographies. INDIGEO. 10.35110/005a209e-9cc6-4495-bb27-2323c5ccb637


