Mineralogical characterisation of aeolian sands using multispectral satellite datasets: Implications for dune field evolution, Wahiba Dune Field, Oman
Abstract
The Wahiba Basin of NE Oman has been the focus of numerous studies involving satellite imagery that demonstrate the complex interactions between diverse source terrains and fluvial/marine/aeolian sediment transport pathways. Building upon previous work, our study resolves the mineralogy of the dune field and grain provenance utilising a multispectral dataset derived from visible to near-infrared and short-wave infrared bands of Worldview-3 (WV-3) and Sentinel-2, alongside select thermal infrared bands of Advanced Spaceborne Thermal Emission and Reflection Radiometer (ASTER). Spectral signatures identified from remote sensing were confirmed through selective surface sampling, followed by petrographic analysis, powder X-ray diffraction and grain-size analysis. We employed the spectral angle mapper algorithm (SAM) and band ratio analysis to classify the WV-3 covered megadunes, and validate our scenes with the ground sample data. The spectrally superior WV-3 dataset was resampled and compared, pixel-for-pixel, against a SAM-classified Sentinel-2 scene, providing a framework necessary to expand our observations regionally. The resulting datasets offer spatially expansive classified scenes that provide mineralogical context regionally and at the fine resolution of individual megadunes. Regional observations are mostly consistent with the spatial distribution of mineral phases previously defined across the dune field, highlighting the contemporary influx of sand with mineralogical affinities of proximal source regions that imprint locally. We challenge the prevailing hypothesis that the Al Hajar Mountains to the north of the dune field is the primary supplier of quartz, proposing instead that the siliciclastic-rich Huqf Arch in the south is a more likely contributor. The combined scales of resolution reveal contemporary megadune deflation and sediment reworking that contrasts the mineralogy of the contemporary flux, suggesting that dominant and subordinate regional wind trends were reversed during glacial periods. Our detailed mineralogical observations reveal the sensitivity of contemporary geomorphic surfaces to local sediment dynamics and highlight the value of multi-scale analysis in interpreting dune field evolution.
1 INTRODUCTION
Satellite imagery is a powerful tool for analysing geomorphic landforms and their dynamics within basin-scale aeolian systems. In the Wahiba Dune Field and surrounding region of Oman, satellite imagery, combined with ground data, has been employed to map geomorphic features and investigate their evolution through interactions among diverse source terrains and sediment transport processes (Al Buloshi & Gheith, 2022; Al-Masrahy & Mountney, 2013; Blechschmidt et al., 2009; El-Baz, 2002; Garzanti et al., 2003, 2013; Goudie et al., 1987; Hereher et al., 2020; Maizels, 1988; McBean, 1988; Nairn et al., 2015; Pease et al., 1999; Pease & Tchakerian, 2002; Robinson et al., 2007). Recent technological advancements and increased accessibility to satellite data have further enhanced the ability to remotely explore the Wahiba aeolian system.
This study builds upon previous work (Pease et al., 1999; Pease & Tchakerian, 2002) in the Wahiba Dune Field, which utilised multispectral satellite and ground data to identify spatial patterns of mineralogy at the dune field scale. While earlier studies have laid a strong foundation of knowledge about the Wahiba Dune Field's intricate geomorphology and sediment transport patterns, they were constrained by the coarser spatial resolutions and limited multispectral capabilities of earlier satellite technologies. This research leverages advanced remote sensing techniques, integrating ultrahigh-resolution WorldView-3 imagery (50 cm per pixel) with medium-resolution Sentinel-2 imagery (10 m per pixel), to significantly improve the ability to detect and interpret fine-scale mineralogical variations across multiple spatial scales. These improvements provide unprecedented insights into sediment provenance, transport pathways and the dynamic evolution of this complex aeolian system.
The specific objectives of this study were to (1) collect in situ samples linked to predetermined, representative regions in a multispectral scene, (2) identify and group mineral species per sample location, (3) calibrate the spectral response (reflectance and/or emissivity) of these mineral populations within multispectral scenes to expand observations beyond sampling sites, and (4) interpret sediment provenance and transport pathways and the implications of these on dune field evolution.
Through this study, we identify new insights into Wahiba sediment dynamics and megadune construction. As detailed in sections that follow, the methodology employed allowed the identification of spectral responses characteristic of several dominant mineralogical populations. Regional datasets align closely with observations reported in past studies of mineralogical spatial patterns at the dune field scale. However, the improved resolution reveals spatial heterogeneity at the megadune scale, shedding light on the processes of megadune construction. Expanded scene analyses, combined with sediment transport pathways, suggest that southern source areas played a more significant role in siliciclastic supply to the dune field than previously acknowledged. Combined scales of mineralogical patterns illustrate dune and dune field dynamics where sediment source areas and transport paths to the dune field change temporally with shifting boundary conditions, as does redistribution of the available sediment supply by the wind within the dune field.
2 STUDY AREA
2.1 Geology
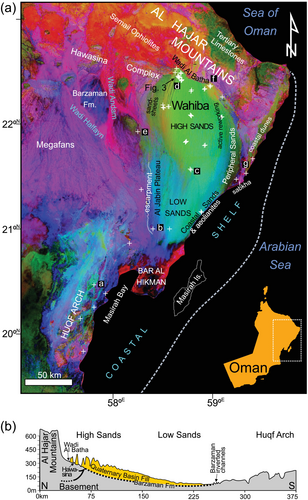
The Wahiba Basin of NE Oman, housing the Wahiba Dune Field and surrounding environments, was formed by regional subsidence between the Al Hajar Mountains to the north and the Huqf Arch to the south (Figure 1) (Immenhauser et al., 2000; Shackleton & Ries, 1990). The Al Hajar Mountains contain a 15-km thick slab of oceanic lithosphere obducted onto the continental margin of Arabia (Bernoulli & Weissert, 1987). They have elevations exceeding 2200 m and are flanked by rugged terrains of the emplaced Semail ophiolite, characterised by Late Cretaceous mafic to ultra-mafic oceanic crust (Glennie, 1988; Hanna, 1990) (Figures 1 and 2). A series of imbricated units of continental margin and/or oceanic origin, known as the Hawasina Nappe Complex, are sandwiched between parautochthonous sequences of the Hajar Supergroup (SG) and the Semail ophiolite (Figures 1 and 2) (Bernoulli & Weissert, 1987; Hansman et al., 2021). The Hajar SG consists primarily of Late Permian to Late Cretaceous carbonate strata and minor siliciclastic components (Béchennec et al., 1992). The Hawasina Complex contains extensive units of limestone and radiolarian chert (Figures 1 and 2) (Béchennec et al., 1988, 1992; Glennie, 1988; Hanna, 1990; Kusky, Robinson, & El-Baz, 2005). Post-obductional Tertiary cover (Tertiary Limestones) includes marine slope to shelf deposits of the Hadhramaut/Dhofar/Fars Groups, consisting of limestone, shale and conglomerate (Figures 1 and 2) (Glennie, 1988; Hansman et al., 2021). Late Eocene to Pleistocene uplift and subsequent drainage from the Al Hajar Mountains resulted in the development of extensive, laterally overlapping alluvial megafans forming the Barzaman Formation (Barzamanite) composed of chert and pedogenically altered limestone and ophiolitic sediments (Figures 1 and 2) (Blechschmidt et al., 2009; Maizels, 1988; Rodgers & Gunatilaka, 2002).
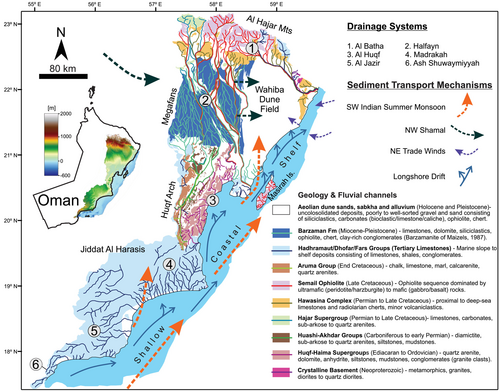
The Huqf Arch, located on the southern margin of the Wahiba Basin, contains outcrops of the oldest known sedimentary sequences of Oman, which uncomformably overlie the Neoproterozoic granodioritic basement (Figures 1 and 2) (Searle, 2019). The Huqf Arch is an anticlinal feature that trends SW–NE and hosts continental siliciclastic to marine sediments of the Huqf-Haima SGs (Ediacaran to Early Paleozoic), the Haushi-Akhdar Groups (Carboniferous to Permian) and the Aruma Group (Late Cretaceous) (Figure 2) (Allen, Leather, & Brasier, 2004; Angiolini et al., 2004; Angiolini, Stephenson, & Leven, 2006; Droste, 1997; Searle, 2019). Outcrops of the Huqf SG and overlying Haima SG dominate the structural high and contain extensive continental quartzose sandstones (fluvio-aeolian), marine carbonates/bioclastics and evaporitic deposits (Allen & Leather, 2006; Gorin, Racz, & Walter, 1982; Leather, 2001). The Huashi and Akhdar Groups occur as isolated outcrops containing polymictic conglomerates, quartzose/bioclastic sandstones, siltstones, shales and carbonates (Figure 2) (Angiolini et al., 2003, 2004; Osterloff et al., 2004; Platel et al., 1992). The Aruma Group lies on the western margin of the Huqf Arch and is dominated by quartzose sandstones, bioclastic limestone/marl and extensive chalk deposits (Figure 2) (Dubreuilh et al., 1992; Platel et al., 1992). South of the Huqf Arch, the Jiddat Al Harasis highlands are made up of the Tertiary Limestone deposits of the Hadhramaut/Dhofar/Fars Groups and mark a period of marine transgressive–regressive pulses (Figure 2) (Dubreuilh et al., 1992).
2.2 Climate and aeolian transport systems
Today, the highland regions of the Al Hajar Mountains host an arid climate (100–200 mm rainfall pa), whereas the low lying Wahiba Basin is classified as hyper-arid, typically receiving less than 100 mm of rainfall annually (Kwarteng, Dorvlo, & Vijaya Kumar, 2009). The east coast of Oman is subject to three seasonal wind modes associated with regional climatic systems (Figure 2) (Fryberger, Hern, & Glennie, 2016a, 2016b; Patlakas et al., 2019): (1) strong and persistent SW winds of the Indian summer monsoon (ISM), (2) Shamal NW winds that persist through the year and (3) NE trade winds of the Indian winter monsoon (IWM). The ISM SW winds are strongest over the Arabian Sea, deflect onshore as southerlies, and diminish toward the interior of Oman. In summer, weak NW Shamal winds form part of the ISM circulation and are relatively consistent. In winter, the Shamal winds occur with periodic frontal systems that originate in the Mediterranean, bringing strong NW winds that sweep across the Arabian Peninsula. Shamal winds generally approach the Wahiba Basin from the W and diminish toward the coast. The moderate IWM NE trade winds rotate inland to approach the Wahiba Basin from the SE (Figure 2).
2.3 Geomorphology and stratigraphy of the Wahiba Dune Field
Various geomorphic provinces characterise the Wahiba Dune Field (Figure 1) (e.g. Fryberger, Hern, & Glennie, 2016a, 2016b; Gardner, 1988; Goudie et al., 1987; Robinson et al., 2007). The northerly High Sands is composed of NNE–SSW trending linear megadunes, separated by interdune corridors, and crossed obliquely by active seif and/or crescentic dunes (Figure 3). The megadunes transition from asymmetrical structures (steep western face) with average heights of ~60 m in the north to more subdued symmetrical structures with average heights of ~30 m in the south. Active reworking is apparent on the eastern margin of the High Sands where infilling of the interdune corridors and mega crescentic features disturb the linear bedforms (Al-Masrahy & Mountney, 2015; Kocurek et al., 2020). At South of the High Sands, the relief lowers and transitions into the Low Sands, dominated by northward migrating crescentic dunes (Figure 1). The deflationary Al Jabin Plateau lies west of the Low Sands and contains variable sandsheet cover separated by aeolianite outcrops that are established as N–S trending yardang landforms (Figure 1). The aeolianite outcrops are dated to glacial and interglacial periods between marine isotope stage (MIS) 7 and 5d (Glennie et al., 2011; Juyal, Singhvi, & Glennie, 1998; Radies et al., 2004). Along the east coast, the Coastal Sands contain NE migrating crescentic dunes with outcrops of aeolianites interspersed within interdune areas (Figure 1). The aeolianites also form beach terraces of up to 20-m high and are dated to the Last Glacial Maximum (LGM) period of MIS 2 (Gardner, 1988; Glennie & Singhvi, 2002; Preusser et al., 2005; Radies et al., 2004, 2005). The Peripheral Sands lies directly north and east of the Coastal Sands and High Sands, respectively, and is composed of barchanoid dunes, linear seif dunes and nabkha (Figure 1).
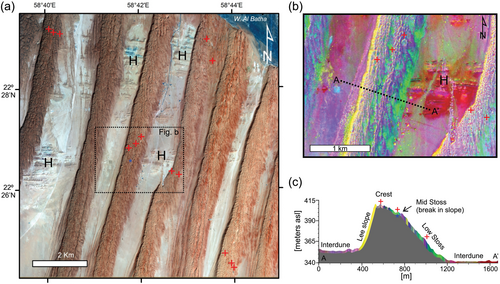
The Wahiba Dune Field accumulation has occurred over at least the past 229 ka, and has been primarily linked to the dominance of the southerly monsoonal winds systems of the ISM (Glennie et al., 2011; Juyal, Singhvi, & Glennie, 1998; Preusser, Radies, & Matter, 2002; Radies et al., 2004). Continuous core and trench sampling have demonstrated that Milankovitch-controlled cyclicity is the dominant signal across the Wahiba Basin (Glennie et al., 2011; Glennie & Singhvi, 2002; Juyal, Singhvi, & Glennie, 1998; Preusser, 2009; Preusser, Radies, & Matter, 2002; Radies et al., 2004). This cyclicity manifests as periods of dune stabilisation during wet interglacial cycles (e.g. MIS 5), and dune reactivation and accumulation during arid glacial periods (e.g. MIS 2 aged stratigraphy in Hern et al. (2018); Figure 3).
2.4 Fluvial and coastal transport systems
The Wahiba Basin sediments include first cycle wadi sands transported from the local highlands to adjacent coasts or interior regions (Figure 2) (Garzanti et al., 2013). Three major drainage systems surround the Wahiba Dune Field: the Halfayn system to the north and west, the Al Batha to the north and east, and the Al Huqf on the south (El-Baz, 2002). The Halfayn (comprising Wadi Halfayn and Wadi Andam) and Al Batha systems are primarily derived from the Al Hajar Mountains, and the Halfayn additionally erodes Barzamanite megafan sediment (Figures 1 and 2). Collectively, these sediments are identified by mafic grains of the Semail ophiolite, and chert and carbonate grains from the Hawsina Nappe and Tertiary Limestones (Garzanti et al., 2003; Goudie et al., 1987; Maizels, 1988; Pease et al., 1999; Pease & Tchakerian, 2002, 2014; Robinson et al., 2007). Paleozoic to Neoproterozoic detritus of the southern Al Huqf drainage system includes rounded monocrystalline quartz, carbonate and chert (Garzanti et al., 2003). The drainage systems either terminate within the portion of the catchment occupied by the Wahiba Dune Field (Halfayn and Al Batha systems), yield to lowland plains (all systems), or drain onto the coastal shelf (Al Batha and Al Huqf systems) (Blechschmidt et al., 2009; El-Baz, 2002; Garzanti et al., 2003; Robinson et al., 2007). The active littoral zone and shallow coastal shelf hosts a mixture of modern bioclastic sediments of the productive Arabian Sea, and continental terrigenous sediments, which are subject to northward longshore transport (Garzanti et al., 2003, 2013; Nairn et al., 2015; Pease et al., 1999; Pease & Tchakerian, 2014).
3 METHODOLOGY AND DATA PROCESSING
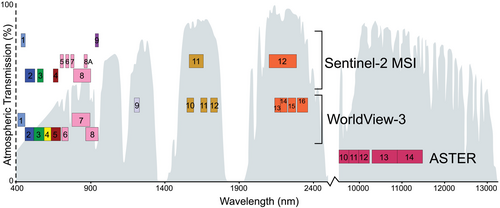
Multispectral datasets utilised in this study consist of the visible and near-infrared (VNIR) to shortwave infrared (SWIR) bands of Worldview-3 (WV-3) and Sentinel-2, and select thermal infrared (TIR) bands of the Advanced Spaceborne Thermal Emission and Reflection Radiometer (ASTER) (Figure 4; Tables 1 and 2). Validation of the spectral data relied on mineralogically resolved ground samples in conjunction with published reflectance spectra of relevant minerals (https://speclib.jpl.nasa.gov/library; Kokaly et al., 2017).
| Worldview-3 | Band | Central wavelength (nm) | Bandwidth (nm) | Spatial resolution (m) | |
|---|---|---|---|---|---|
| PAN | Panchromatic | 625 | 350 | 0.5 | |
| VNIR | V1 | Band 1-Coastal | 425 | 50 | 2 |
| V2 | Band 2-Blue | 480 | 60 | ||
| V3 | Band 3-Green | 545 | 70 | ||
| V4 | Band 4-Yellow | 605 | 40 | ||
| V5 | Band 5-Red | 660 | 60 | ||
| V6 | Band 6-Red Edge | 725 | 40 | ||
| V7 | Band 7-Near-IR 1 | 833 | 125 | ||
| V8 | Band 8-Near-IR 2 | 950 | 180 | ||
| SWIR | S1 | Band 9-SWIR 1 | 1210 | 30 | 7.5 |
| S2 | Band 10-SWIR 2 | 1570 | 40 | ||
| S3 | Band 11-SWIR 3 | 1660 | 40 | ||
| S4 | Band 12-SWIR 4 | 1730 | 40 | ||
| S5 | Band 13-SWIR 5 | 2165 | 40 | ||
| S6 | Band 14-SWIR 6 | 2205 | 40 | ||
| S7 | Band 15-SWIR 7 | 2260 | 50 | ||
| S8 | Band 16-SWIR 8 | 2330 | 70 | ||
| Sentinel-2 | |||||
|---|---|---|---|---|---|
| VNIR | Band 1-Coastal | 443 | 20 | 60 | |
| Band 2-Blue | 490 | 65 | 10 | ||
| Band 3-Green | 560 | 35 | |||
| Band 4-Red | 665 | 30 | |||
| Band 5 - Red edge | 705 | 15 | 20 | ||
| Band 6 - Red edge | 740 | 15 | |||
| Band 7 - Red edge | 783 | 20 | |||
| Band 8 - Near-IR | 842 | 115 | 10 | ||
| Band 8A - Near-IR 2 | 865 | 20 | 20 | ||
| Band 9 - Water vapour | 945 | 20 | 60 | ||
| SWIR | Band 11 - SWIR 1 | 1610 | 90 | 20 | |
| Band 12 - SWIR 2 | 2190 | 180 | |||
| ASTER | |||||
|---|---|---|---|---|---|
| TIR | T1 | Band 10 - TIR 1 | 8291 | 350 | 90 |
| T2 | Band 11 - TIR 2 | 8634 | 350 | ||
| T3 | Band 12 - TIR 3 | 9075 | 350 | ||
| T4 | Band 13 - TIR 4 | 10 657 | 700 | ||
| T5 | Band 14 - TIR 5 | 11 318 | 700 | ||
| Satellite | Scene | Date |
|---|---|---|
| WorldView-3 | 21FEB22064409-P2AS-013467980100_01_P001 | 2/22/2021 |
| 21FEB22064408-M2AS-013467980100_01_P001 | 2/22/2021 | |
| 21FEB22064410-A2AS-013467980100_01_P002 | 2/22/2021 | |
| Sentinel-2 MSI | S2A_MSIL1C_20201228T063301_N0209_R077_T40QGJ | 12/28/2020 |
| S2A_MSIL1C_20201228T063301_N0209_R077_T40QGK | 12/28/2020 | |
| S2A_MSIL2A_20201228T063301_N0214_R077_T40QFJ | 12/28/2020 | |
| S2A_MSIL2A_20201231T064301_N0214_R120_T40QEH | 12/31/2020 | |
| S2A_MSIL2A_20201231T064301_N0214_R120_T40QEJ | 12/31/2020 | |
| S2B_MSIL1C_20201206T064249_N0209_R120_T40QEH | 12/6/2020 | |
| S2B_MSIL1C_20201226T064259_N0209_R120_T40QFJ | 12/26/2020 | |
| S2B_MSIL2A_20201203T063229_N0214_R077_T40QFH | 12/3/2020 | |
| S2B_MSIL2A_20201206T064249_N0214_R120_T40QEH | 12/6/2020 | |
| S2B_MSIL2A_20201226T064259_N0214_R120_T40QEG | 12/26/2020 | |
| S2B_MSIL2A_20201226T064259_N0214_R120_T40QFH | 12/26/2020 | |
| ASTER-TIR | AST_05_00312252020181755_20211221112456_2976888 | 12/25/2020 |
3.1 Dataset preparation
3.1.1 Worldview-3 dataset
The Worldview-3 (WV-3) dataset covers an area of 100 km2 located on the NW margin of the dune field where the linear megadunes are truncated by Wadi Batha (Figures 1 and 3; Table 2). Coverage includes eight NNE–SSW trending asymmetric megadunes, spaced between interdune sandsheets that are commonly crossed by active linear seif to crescentic dunes and contain partial rock outcrops of the Hawasina Group (Figure 3). A portion of Wadi Batha is exposed on the NE corner of the image where the megadunes terminate.
Cloud free and orthorectified WV-3 scenes were acquired from DigitalGlobe Inc. (Colorado, USA). Owing to commercial restriction, the datasets provided were resampled to 0.5, 2 and 7.5 m per pixel in the panchromatic (PAN), VNIR and SWIR bands, respectively (Table 1). Radiometric calibration was performed in order to convert the 16-bit integer digital numbers (DN) into top of the atmosphere radiance data. To compensate for atmospheric effects, the datasets were processed using the Fast Line-of-sight Atmospheric Analysis of Spectral Hypercubes (FLAASH) atmospheric correction module to obtain surface reflectance values (Module, F.L.A.A.S.H., 2009).
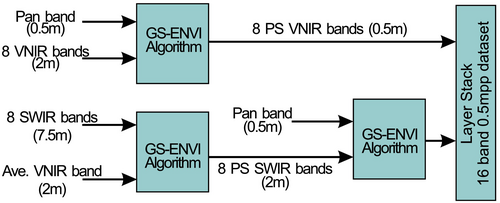
Image interpretation and processing benefited greatly from image-sharpening techniques that increased the spatial resolution of the datasets using high-resolution panchromatic images (Figure 5) (e.g. Kim et al., 2016; Kwan et al., 2017; Park et al., 2020; Park & Choi, 2021; Selva et al., 2015). The pansharpening process aims to fuse a multispectral (MS) and a panchromatic image, the result of which contains the spectral resolution of the former with the spatial resolution of the latter (Vivone et al., 2014). Co-registered WV-3 multispectral datasets were pansharpened to 0.5 m per pixel and layer-stacked following the sequential-parallel fusion process of Kwan et al. (2017), utilising the Gram–Schmidt (GS) algorithm of Laben and Brower (2000) (Figure 5).
3.1.2 Sentinel-2 dataset
Expansion of mineralogical observations within the dune field and the surrounding environments relied upon 11 medium-resolution Sentinel-2 scenes captured around the date of ground sample collection (Figure 4; Tables 1 and 2). Low cloud cover to cloud-free and orthorectified Sentinel-2 Level 1C and Level 2A multispectral scenes were downloaded from the European Space Agency (ESA) Copernicus open access hub (https://scihub.copernicus.eu/dhus/#/home) (Table 2). Where necessary, Level 1C scenes were processed to surface reflectance utilising the Sen2Cor atmospheric correction algorithm of Main-Knorn et al. (2017). As carried out in the WV-3 dataset, the spatial resolution of the multispectral scenes was enhanced to 10 m per pixel resolution using the Sen2Res algorithm of Brodu (2017) and subsequently layer stacked into a composite dataset. The separate Sentinel-2 scenes were mosaiced into a single scene to cover the regional setting and all sample collection sites.
3.1.3 ASTER dataset
Certain minerals (e.g. nonhydrous varieties of quartz) lack good diagnostic absorption features in the VNIR and SWIR spectral regions and therefore required detection in the TIR spectrum, such as the bands available in ASTER's low-resolution thermal sensor (Table 1). A single ASTER tile was employed for comparison with the WV-3 dataset (Table 2).
Atmospherically corrected and orthorectified ASTER level 2 surface emissivity TIR scenes (AST_05T v003) were downloaded from the National Aeronautics and Space Administration Land Processes Distributed Active Archive Center (NASA LP DAAC) (https://urs.earthdata.nasa.gov/) (Table 2). The pre-processed AST_05T datasets are atmospherically corrected, contain five TIR bands between 8 and 12 μm spectral range, and provide surface emissivity values derived from radiance data, with a spatial resolution of 90 m per pixel. For the purpose of this study, ASTER datasets were not processed past the level provided by NASA LP DAAC.
3.1.4 Surface sampling
A total of 56 sites were selected for ground sampling including the High Sands megadunes, Low Sands dunes, surrounding drainage systems, Coastal Sands and sabkha, and the dunes and beaches of the Huqf Arch (Figure 1). Bulk samples of approximately 100 g were collected from the upper 3 cm at each site for a representative surface layer mix. In the High Sands, the megadunes were typically sampled up the east-facing stoss slopes to include a low-stoss, mid-stoss and crestal sample (Figure 3). A total of 13 sediment samples were collected on four separate megadunes in the WV-3 scene and an additional 24 samples located on nine megadunes spread across the High Sands (Figures 1 and 3). To further investigate the spectral heterogeneity evident on the megadunes (Figure 3b), grain size analysis was conducted on all megadune samples. Sampling in the surrounding environments of the Wahiba Basin included seven samples from wadi systems, five samples from the Coastal Sands, one sample from the Low Sands and one sample from the Al Jabin Plateau (Figure 1). Five samples were collected from wadis, dunes and beaches of the Huqf Arch (Figure 1). A location accuracy of approximately 10 m was determined from handheld global positioning system (GPS) devices.
The mineralogy of the surface sediment samples was resolved by powder X-ray diffraction (XRD) and petrographic analysis. XRD analysis was conducted on a Bruker D8 Advance X-ray diffractometer. Qualitative and semi-quantitative characterisation of mineral phases were determined using Profex v. 4.33 (https://www.profex-xrd.org), a graphical user interface for Rietveld refinement of powder XRD data using the BGMN interface (http://www.bgmn.de) (Doebelin & Kleeberg, 2015). Sixteen samples representative of the various environments were sub-selected for thin-sectioning and analysis on a petrographic microscope for further quantitative and qualitative phase validation, grain characteristics and minor phases that are not detectable by XRD. Grain sizes were determined using a CAMSIZER® (http://www.retsch.com) and analysis applied the formulas of Folk and Ward (1957).
3.2 Data validation approaches
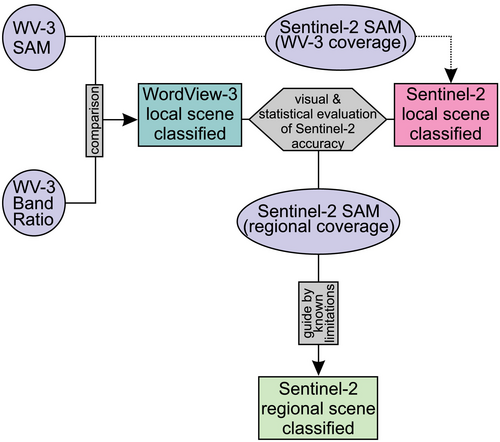
The validation of the WV-3 dataset was accomplished by means of comparing a band ratio analysis against a supervised classification approach using a Spectral Angle Mapper (SAM) algorithm (Figure 6). The band ratio classification is guided by published reflectance spectra of applicable minerals, and the SAM classification utilises the mean spectra over each georeferenced ground sample. Once validated, the WV-3 dataset served as a reference to evaluate the accuracy of a SAM-classified Sentinel-2 dataset for the same region. A band ratio analysis was not conducted for the Sentinel-2 dataset because the satellite only contains two broad SWIR bands (Figure 4). To understand the limitations of the lower resolution Sentinel-2 dataset, both a visual inspection and a confusion (error) matrix analysis was conducted between the two satellites. Finally, a SAM algorithm was run on the regional Sentinel-2 datasets using the mean spectra of each sample location. The final production of the regional classification maps is guided by the known limitations of the lower resolution Sentinel-2 satellite.
3.2.1 Band ratio analysis
Band ratio analysis utilises spectral indices to discriminate and map surface rocks/sediments. Considering that each object has a unique spectral reflectance curve in each wavelength of the electromagnetic spectrum (Figure 7), spectral indices can be used to emphasise the anomaly of a target object by determining the band at which the reflectance is high or at a point of highest absorption (Gupta, 2018; Lillesand, Kiefer, & Chipman, 2015; Mars, 2018); Pour & Hashim, 2015; Prost, 2013; Rockwell & Hofstra, 2008.
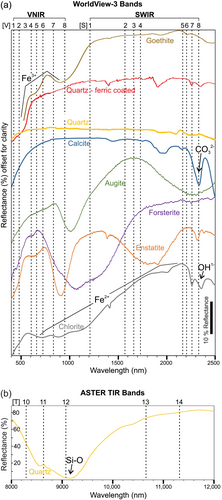
With a total of 16 narrow bands, the WV-3 dataset is ideal for reflectance and absorption that distinguish certain minerals (Figure 7a and Table 1). Ferric iron (Fe3+) leads to strong absorption in the UV to blue wavelength region, while ferrous iron (Fe2+) is known to exhibit some absorption features around 600–2050 nm. Calcium carbonates have absorption features at 2320 and 2510 nm in the SWIR region. Clay minerals also have a characteristic absorption feature in SWIR spectrum of 2100–2400 nm and shifts slightly depending on the clay type. Caution should therefore be exercised in interpreting clays versus calcium carbonate abundance, as both minerals have similar absorption features and common reflectance features around 1550–1750 nm. Quartz consists of a simple silicate tetrahedra, and the absorption bands only occur in the TIR around 8500–9500 nm. However, as WV-3 lacks TIR bands, quartz cannot be directly identified and required the used of the ASTER dataset. (Figure 7b).
To select suitable band ratios, reflectance spectra for the appropriate minerals were obtained from the NASA Jet Propulsion Laboratory (JPL) spectral library (https://speclib.jpl.nasa.gov/library) and the USGS Spectral Library v.7 (Kokaly et al., 2017) (Figure 7). The band ratio application produces a single-channel greyscale image, in which pixels with elevated reflectance values correspond to characteristic minerals. A ‘bright pixel slice’ classification approach was used to delineate the high-reflectance targets.
3.2.2 SAM analysis
The SAM algorithm is a commonly used method in multi-spectral or hyperspectral analysis for comparing the similarity between two different spectral signatures (Kruse et al., 1993). SAM calculates the angle between two spectra and treats them as vectors in a high-dimensional space with dimensions equal to the number of bands in the dataset (Exelis, 2014). The output classification provides a measure of the spectral similarity between different pixels or regions in an image. Mean spectra were extracted from multiple pixels selected at each georeferenced sample location, and a maximum threshold angle of 0.1 rad was set for all spectra in the classification process. The interpretation of the classified SAM pixels relies on the mineralogically resolved surface samples.
4 RESULTS
4.1 Surface samples
Quantitative data of XRD and thin section analyses indicate that quartz, undifferentiated carbonates and mafic material typically make up more than 80% of aeolian dune samples, with increased quantities of clay and/or evaporite minerals present in fluvial, lacustrine and sabkha samples. For simplification and with the aim of spectral characterisation of mixed sediment, the samples in this paper are reported normalised by their total dominant mineralogy (Figure 8).

A total of 14 megadunes with variable heights were sampled across the High Sands. On average, the low stoss, mid stoss and crestal sampling occurred approximately 18, 31 and 50 m above local interdune elevations, respectively (e.g. Figure 3c). Mineralogically, mean values indicate that carbonate and mafic minerals increase upslope, from low stoss to mid stoss and crest, inversely with decreasing quartz (Figure 8a). Samples of the Halfayn system indicate that southward drainage is associated with a decrease in carbonates, mafic material and clay, and increasing quartz content (Figure 8b). Mafic and clay content decrease downstream in Wadi Al Batha drainage, inversely with quartz, until reaching the coastal delta that contains low levels of quartz and high levels of clay and evaporite minerals (Figures 2 and 8b). Carbonate content varies in the Al Batha System with an interdune pond containing the highest levels of carbonate and evaporite minerals. At the Coastal Sands, beach samples are depleted in mafic content, however, contain nearly double the amount of carbonate than the inland coastal dunes that are relatively rich in quartz and mafic content (Figures 2 and 8b). The coastal aeolianite deposit contains similar mineralogy to the carbonate-rich beach sand with a mafic content similar to that of an adjacent active dune (Figure 8b). The coastal sabkha contains high levels of evaporite minerals and relatively high mafic material. In the Low Sands, quartz content increases southwards inversely with carbonate and mafic material. A sampled dune on the proximal Al Jabin Plateau contains a similar carbonate concentration to Low Sands samples but significantly more mafic content (Figures 2 and 8b). At the Huqf Arch, in both wadi and aeolian dune deposits, higher quartz content is inverse with carbonate content in more northerly located regions. The beach sediment of Huqf contains significant amount of carbonate grains and includes evaporite minerals (Figures 2 and 8b).
Thin sections analysis reveals characteristic grain varieties present across environments (Figure 9). Ferric-coated quartz grains (Q) are ubiquitous in all environments and vary from sub-angular very fine sand to silt, to well-rounded fine sand. Carbonate grains are classified into four categories, namely rounded limestone grains (Lr), carbonate aggregate grains (Ag), caliche fragments (Cf) and biogenic fragments (Bf). Lr are found in all environments across the study region and are typically well-rounded fine sand composed of micrite or cement filled tests interpreted as reworked fossil foraminifera. Ag are medium-to-coarse sand-sized grains consisting of an aggregate of micrite cemented Lr grains. Ag range from sub-angular, typical of wadi samples, to more rounded grains identified in the High Sands. Cf are typically sub-rounded, medium to coarse sand and are only identified on megadune low to mid stoss regions. The grains consist of a micrite cement encasing sub-angular very fine sand to silt grains of quartz, biogenic/limestone fragments and minor mafic material. Cf may contain calcite filled cellular clusters indicative of plant roots. Bf include skeletal debris and shallow water benthic foraminifera that may be fairly pristine and are interpreted as modern foraminifera. These fragments are identified on Huqf's beach, the Low Sands including Al Jabin dunes and the Coastal Sands including aeolianite deposits. Ophiolite fragments (Of) consist of olivine and pyroxene, typically in grains of serpentinised harzburgite. Of range from fine sand, generally concentrated on megadune crests along the W and NE margin of the High Sands, to coarse sand through pebble size concentrated in wadis of the Al Batha and Halfayn drainage systems. Varying amounts of pyroxene (Px), plagioclase feldspar (F) and chert (H) grains are identified in most samples.
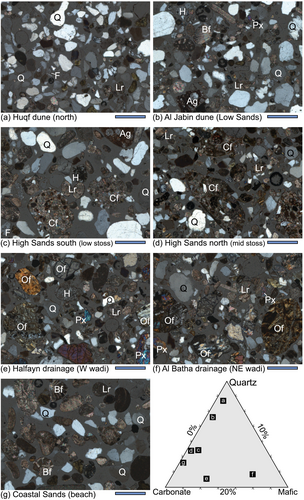
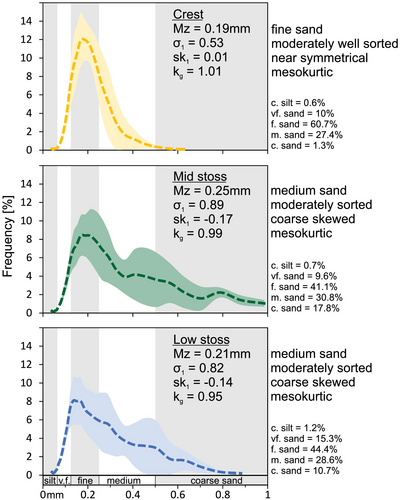
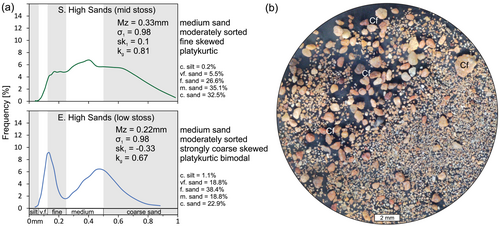
Megadune grain size analysis indicates that upslope variation is present across many metrics that include mean grain size (Mz), sorting (σ1), skewness (sk1) and kurtosis (kg) (Figures 10 and 11) (formulas of Folk & Ward, 1957). On average, both the low- and mid-stoss regions contain a mean grain size of medium sand (low = 0.21 mm; mid = 0.25 mm), are moderately sorted and contain a distribution that is coarse skewed. This is in contrast with crestal sands that consist of fine sand (0.19 mm), are moderately well sorted and have a near symmetrical distribution. All areas have a mesokurtic kurtosis, although the low and mid stoss tend towards flatter distributions (i.e. kg < 1). This is evident in the considerably higher coarse sand fraction on the stoss, with an average of 10% on the low stoss and 17% on the mid stoss, compared to only 1.3% on the crest. The coarse sand fraction is above the typical aeolian load (0.1–0.3 mm) and forms lag deposits on the elevated stoss slopes (e.g. Figure 11a). Stoss samples with a well-developed lag contain increased mean grain size (up to 0.33 mm), are platykurtic (bimodal) and contain variable skewed distributions with a coarse sand fraction up to 32.5% (Figure 11a). Microscope analysis (Figure 11b) reveals that the fraction of lagged grains is typically sub-rounded and dominated by caliche fragments (Cf) (e.g. Figure 9c, d).
4.2 Image classification
4.2.1 WorldView-3 classification
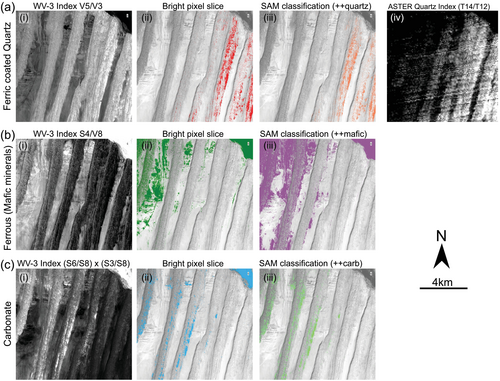
Three distinct band ratios (spectral indices) were utilised in the mineralogical classification of the WV-3 scene (Figure 12): (1) a ferric index to represent ferric-coated quartz minerals that are ubiquitous in all environments; (2) a ferrous index specific to mafic minerals of the Semail ophiolite; and (3) a carbonate index to represent undifferentiated carbonate minerals. Because quartz minerals only contain diagnostic features in the TIR spectrum (Figure 7b), an additional quartz index of the ASTER satellite was utilised to assess the coincidence of quartz with observations of the WV-3 ferric index (Appendix S1). Results from the band ratio analysis were subsequently compared against SAM pixels for locations that contained relatively high proportions of each mineral type (Figure 12) (Appendix S4).
Quartz
Ferric-coated quartz minerals contain a broad set of absorption features centred around 500 nm and 850 to 910 nm, which correspond to WV-3 bands V2–V4 and bands V6–V7 (Figure 7a). The laboratory spectra of both goethite and ferric-coated quartz show a high absorption and reflection feature in band V3 and band V5, respectively (Figure 7a). In order to reveal the ferric-coated quartz distribution, the V5/V3 index was applied. The resulting images (Figure 12a i–ii) show that pixels with elevated reflectance values appear along the megadune stoss slopes on the eastern margin of the image. Subsequently, the resultant SAM classification pixels were selected based on samples containing quartz content in excesses of 55%. A visual comparison shows that the SAM classified pixels are in good agreement with the brightest pixels identified in the ferric-coated quartz index (Figure 12a ii–iii). The ASTER assessment utilised the high absorption feature of quartz, centred about the thermal region of 9000–9400 nm, defined by TIR band T12, and the quartz index T14/T12 was applied (Figure 7b). The ASTER dataset has a considerably reduced spatial resolution of 90 m per pixel; however, the resulting image compares favourably with the WV-3 classification, and elevated reflectance values dominate the megadune stoss slopes along the eastern margin of the image (Figure 12a).
Mafic
Based on thin section analysis and the literature encompassing the Semail ophiolite complex (MacLeod, Johan Lissenberg, & Bibby, 2013; Prigent et al., 2018), olivine forsterite and pyroxene enstatite minerals of mantle harzburgites, and pyroxene augite minerals of crustal gabbro are considered a good representation of mafic spectra (Figure 7a). The molecular structure of these minerals contains characteristic absorption features near 950–1100 nm, corresponding to WV-3 band V8 (Figure 7a). The output image from band index S4/V8 reveals pixels with elevated reflectance values on Wadi Al Batha deposits in the NE, and on the active superimposed dunes along the megadunes of the western margin (Figure 12b i–ii). The SAM classification map was produced from the mean spectra of sampled zones containing more than 9% mafic material, and a spatial agreement exists with the mafic index, particularly on the western margin of the image and in wadi Batha (Figure 12b ii–iii). The higher representation of SAM pixels, however, may be because of spectral interference with more abundant mineral species (Figure 8a).
Carbonate
Carbonate mineral identification utilised the band ratio (S6/S8)*(S3/S8), necessitated by their absorption features in band S8, coupled with relatively high reflectance in bands S6 and S3 (Figure 7a). Results reveal that pixels with elevated reflectance values are concentrated on the megadunes of the western half of the WV-3 scene and decrease eastwards (Figure 12c i-ii). Results are particularly distinct along the N–S trending stoss slopes, in corridors that lack active superimposed dunes, on exposed Hawasina outcrops, and on Wadi Al Batha (Figures 3, 12c i-ii). The SAM classification utilised the mean spectra of zones where samples contained more than 55% carbonate material, and a visual comparison indicates a good accordance with the carbonate index map (Figure 12c ii–iii). The unclassified wadi sediment by SAM is unsurprising, as the proximal Wadi Al Batha sample contains less than 24% carbonate material (Figure 8b). The high index values present over the wadi sediment in the carbonate index map is probably because of interference with a high clay content (42%; Figure 8b), which contains the same absorption feature in band S8 (e.g. chlorite in Figure 7a).
4.2.2 Sentinel-2 classification
With only two bands in the SWIR region of the electromagnetic spectrum, the Sentinel-2 dataset is inherently limited in spectral resolution, reducing the data dimensionality and degrees of freedom available for mineral differentiation. This limitation affects the ability to accurately perform linear spectral unmixing, contributing to challenges in classification accuracy (e.g. Lillesand, Kiefer, & Chipman, 2015; Tompolidi et al., 2020). The quality assessment of Sentinel-2 classification was determined by statistical (Table 3) and visual (Figures 13 and 14) comparisons to the calibrated WV-3 scene. To enable a direct comparison between the two datasets, the Sentinel-2 scene was masked to include the same area as the WV-3 scene (Figure 13), and WV-3 pixels were resampled to 10 m per pixel to match raster resolutions. The scene was further masked to include only the megadunes (excluding interdunes) before running a confusion (error) matrix analysis and calculating a Kappa coefficient (Table 3). Statistically, when comparing all 13 sample spectra run through the SAM algorithm (Figure 13a), a poor overall accuracy of 26.6% with a corresponding Kappa coefficient of 0.18 was observed between the two datasets. However, isolating classes that contain distinct differences in quartz, carbonate and mafic mineralogy (i.e. coloured diamonds in the ternary plot in Figure 13a) yielded a more favourable overall accuracy and Kappa coefficient of 78.8% and 0.69, respectively (Table 3). High producer's and user's accuracy were achieved for both quartz-rich and carbonate-rich sample classes, while much lower accuracy was observed for the mafic-rich sample class. Mafic material is commonly less than 10% of the bulk sample content, and the low accuracies indicate that spectral mixing and confusion between mafic content and other classes is to be expected in Sentinel-2 classifications.
| Sentinel-2 classification | Ground truth pixels (WV-3) | ||||
|---|---|---|---|---|---|
| High mafic | High carbonate | Hiqh quartz | High quartz 2 | User's accuracy | |
| High mafic | 52 | 24 | 14 | 10 | 52% |
| High carbonate | 32 | 129 | 2 | 0 | 79% |
| Hiqh quartz | 5 | 2 | 26 | 9 | 62% |
| High quartz2 | 0 | 1 | 8 | 198 | 96% |
| Total | 89 | 156 | 50 | 219 | |
| Producer's accuracy | 58% | 83% | 52% | 90% | |
| Overall accuracy = 78.79% | Kappa coefficient = 0.69 | ||||

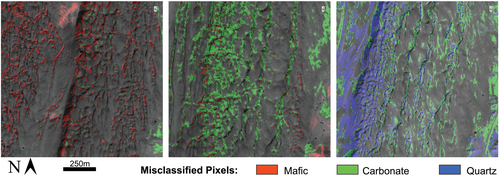
Visually, the SAM pixel classification of VW-3 and Sentinel-2 shows that the general trends across the scene are comparative (Figure 13b, c). Further inspection indicates that misclassified pixels are typically concentrated on smaller superimposed dunes and slip faces (Figure 14). These misclassifications are thought be attributed to a combination of the high angle lee slope affecting spectral reflectance, the lower spatial resolution of Sentinel-2, and differences in scene acquisition dates and active sediment movement. Overall, these observations highlight the sensitivity of the Sentinel-2 dataset to spectral mixing compared with the WV-3 datasets. Subsequent Sentinel-2 dataset classification was therefore conducted by isolating geomorphic provinces and utilising the mean spectra of sampled zones that contain pronounced mineralogical heterogeneity (Figures 15-18).

4.2.3 Sentinel-2 regional maps
Surrounding drainage systems
SAM analysis using the mean spectra of six sample sites from the Halfayn and Al Batha drainage systems (Figures 1 and 2) resulted in 39% of scene classification (Figure 15a). The classified pixels are largely confined within the alluvial–fluvial environments and contain pronounced spectral diversity. Carbonate-rich pixels dominate over the Tertiary Limestones, Hawasina outcrops and exposed Barzamanite megafan sediment, as well as aeolian environments of the Peripheral Sands and coastal dunes in the east. With southward drainage, wadis of the Halfayn system decrease in mafic-rich and carbonate-rich pixels, inversely with increasing quartz-rich pixels. The channels of E to SE flowing Wadi Al Batha are predominantly characterised by mafic-rich spectra, whereas the fluvio-aeolian fans and sandsheet deposits at the base of the Al Hajar exhibit a varied range of spectra.
Huqf Arch
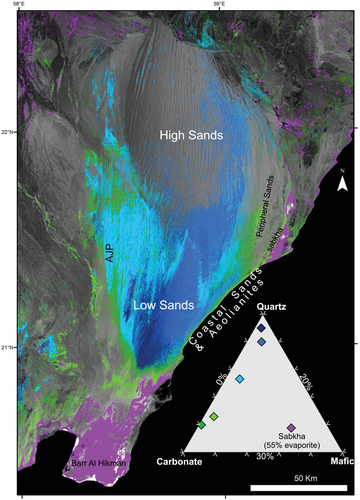
The mean spectra from 21 sample locations with a mineralogically diverse range resulted in a 61% scene classification in the Huqf Arch region (Figure 15b). The classification of the Huqf rock outcrops suggests a prevalence of carbonate-rich spectra, although the siliciclastic-rich stratigraphy of the underlying Huqf-Haima SG is undetected in steep vertical cliff faces (e.g. Rajendran et al., 2018). The spectra of the surrounding fluvial and aeolian systems are, however, more characteristic of the geology provided in Figure 2. This is revealed by pixel classification from samples that contain at least 1.4 times more quartz than carbonate minerals. Linear dunes that extend up to 80 km north of the outcrops towards the Wahiba Low Sands are typically dominated by spectra from sampled regions that contain more than 50% quartz content. Beaches and coastal dunes of NE Huqf are enriched in evaporite minerals (Figure 8b) and classify similarly to the spectra of the Barr Al Hikman and coastal sabkha deposit (Figures 15b and 16).
Low Sands, Al Jabin Plateau, and Coastal Sands
The mean spectra from six sample locations classified 27% of the scene that cover the Low Sands, Al Jabin Plateau (AJP), Coastal Sands and scattered sabkha deposits (Figure 16). Results indicate carbonate-rich sand sheet/nabkha deposits separate the Barr Al Hikman sabkha from the quartz-rich southern Low Sands. Similarly, a carbonate-to-quartz transition occurs sharply at the boundary between the Halfayn drainage system and the aeolianite escarpment of the AJP. On the plateau, the N–S trending aeolianite yardangs are covered by carbonate-rich pixels that contrast sharply with the surrounding active sands. These active sands notably host a higher carbonate content relative to the Low Sands, possibly because of the weathering of the aeolianites. Quartz enrichment occurs in a belt up to 21-km wide centred on the Low Sands and decreases eastwards, towards more carbonate-enriched pixels of the Coastal Sands and aeolianites. Much of the quartz-rich pixels of the Low Sands is also captured along the reworked megadunes of the High Sands eastern margin (Figure 1).
High Sands megadunes
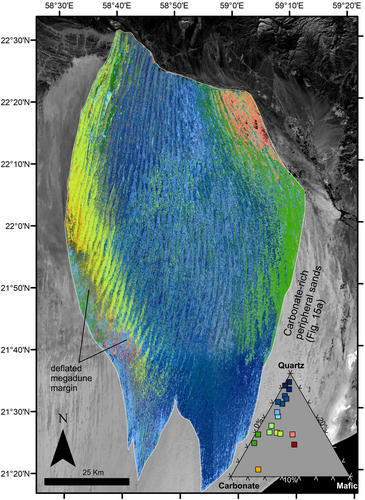
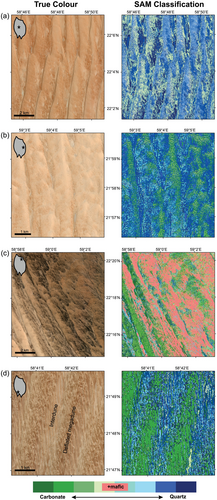
The mean spectra of 18 sample locations classified 56% of the pixels in the isolated High Sands scene (Figures 17 and 18). Mixed carbonate and mafic-rich pixels are conspicuous along the W margin and encompass the megadunes in the north, typically covered in active superimposed dunes, and the deflated southern megadunes. A gradual eastward transition is discernible towards the central High Sands, marked by a general increase in quartz and a corresponding decrease in mafic content. Deflated megadune stoss slopes of the central High Sands contain a sharp increase in carbonate content that dilutes upslope into the active crestal sands (Figure 18a). This is less pronounced to the east where carbonate dominates the megadune crests (Figure 18b), and the pattern gradually transitions into the reworked eastern margin with spectra akin to the carbonate-rich Peripheral Sands (Figures 15 and 17). In the NE margin, proximal to Wadi Al Batha, mafic-rich pixels dominate the reworked megadunes (Figures 17 and 18c). Pronounced megadune deflation is evident on the southern half of the W margin, exposed by an irregular megadune margin (Figure 17). Quartz-rich active linear seif dunes abruptly intersect and override the carbonate-rich deflated megadunes (Figure 18d). In contrast, the linear megadune trend is less obvious on the SE margin, and the area is dominated by active quartz-rich seif dunes that extend from the Low Sands.
5 DISCUSSION
The study highlights the limitations of band ratio analysis, particularly regarding carbonate and clay interferences. In the Sentinel-2 classification, the SAM algorithm faced challenges with the lower spatial resolution in which spectral mixing resulted in pixel misclassification. Ideally, spectral unmixing (i.e. linear deconvolution) approaches could be more affective provided that thermal infrared (TIR) data could be available at the most appropriate spatial and spectral resolution scale and coverage for this study (e.g. Hubbard et al., 2018; Ramsey et al., 1999; Ramsey & Christensen, 1998). Notably, linear deconvolution methods are harder to do using VNIR–SWIR reflectance data because of multiple scattering-related nonlinear mixing effects (e.g. Shipman & Adams, 1987). Despite these challenges, our methodology effectively resolved mineralogical heterogeneity, providing a high-resolution framework for interpreting emission sources, provenance and sediment cycling processes.
The results indicate that quartz, carbonate and mafic minerals are ubiquitous across the High, Low and Coastal Sands, with regional observations largely aligning with the spatial distribution of mineral phases previously defined in the dune field (Goudie et al., 1987; Hereher et al., 2020; McBean, 1988; Pease et al., 1999; Pease & Tchakerian, 2002; Radies et al., 2004). Notably, significant mineralogical diversity is observed in the active sands, particularly in the narrow belts on the western and eastern margins of the High Sands (Figure 17). The western margin inherits a mafic and carbonate-rich composition from the adjacent Halfayn drainage system, with transport driven by W and S winds associated with the Shamal and ISM, respectively (Figures 2, 15a and 17). Similarly, the reworked crescentic dunes in the northeastern High Sands display a mineralogical signature inherited from the mafic-and-carbonate-rich Wadi Al Batha (Figures 2, 17 and 18a).
Strong onshore southerly winds influence the Coastal Sands, transporting bioclastic-rich shelf sediment to the Peripheral Sands and potentially entraining it into the disturbed eastern margin (Figures 2, 15a, 16 and 17). Inland, W and S winds erode aeolianite outcrops of the AJP, as evidenced by yardang landforms, likely contributing recycled carbonate-rich sediment to the Low Sands and the southwestern margin of the High Sands (Figures 16 and 17). The significant decline of mafic minerals towards the central High Sands suggests these minerals have a low survival rate, potentially weathering into clays that are winnowed out. The abundance of iron-rich clays produced through this process may play a significant role in the formation of ferric coatings observed on quartz grains.
Quartz is pervasive throughout the Wahiba Basin, but contributions from the Al Hajar Mountains may have been overstated in previous studies (Allison, 1988; Goudie et al., 1987; Hereher et al., 2020; Pease & Tchakerian, 2002; Robinson et al., 2007). Aside from a relatively small exposure of granodioritic basement on the eastern margin of the mountains, only the Hajar SG in the NW extent of the Halfayn drainage system contains abundant quartzose sandstones (Figure 2). The Miocene to Late Quaternary Barzaman Formation, sourced from the Al Hajar Mountains and currently drained by the Halfayn system wadis (Figure 2), typically contains less than 1% quartz, as reported by Maizels (1988) and Blechschmidt et al. (2009). Furthermore, unconsolidated quartz grains from wadi sediments of the Halfayn and Al Batha drainage systems are characteristically aeolian in origin (Figure 9).
Quartz concentration increases with distance from the Al Hajar Mountains towards the Huqf Arch, a region characterised by substantial quartz-rich formations dominated by recycled Paleozoic shallow marine to continental fluvio-aeolian deposits (Figures 2 and 15) (Garzanti et al., 2003, 2013). Evidence for quartz dispersal from the Huqf Arch includes (1) extensive linear seif dunes extending northward from the outcrops, following the direction of ISM winds (Figure 15b), and (2) sediment deposited by the Al Huqf drainage system onto the shallow coastal shelf, which is subsequently transported northward by longshore drift (Figure 2). The dominance of quartz in the Low Sands and the central core of the High Sands is consistent with dune field construction driven by dominant southern ISM winds, which facilitate sediment transport from southern sources.
Carbonate minerals are present in all direct source regions, making deconvolution of provenance intricate and nuanced (e.g. Pease & Tchakerian, 2014), which is beyond the scope of this study. Our classified maps provide a generalised distribution of undifferentiated carbonate grains across the basin, with further clarification derived from grain characteristics (Figures 9-11). Biogenic fragments (Bf) are found both as modern grains, abundant along the coast, and as reworked components from weathered coastal and Al Jabin aeolianites (Radies et al., 2004). The enrichment of Bf grains in the eastern Peripheral Sands and their absence in the interior High Sands suggest a gradient related to distance from the coastal source, coupled with a low survival rate in the highly abrasive environment. Carbonate grains in the interior High Sands and western margin are dominated by ancient limestone grains (Lr/Ag) originating from the Halfayn and Al Batha drainage systems. These northern drainage systems likely represent the primary carbonate supply to the interior megadunes, aligning with previous studies (Pease & Tchakerian, 2014; Robinson et al., 2007).
At the megadune scale (Figures 3, 17 and 18), mineralogy is typically segregated among: (1) modern quartz-dominated superimposed linear and crescentic dunes, (2) carbonate enrichment at mid-stoss deflation zones and (3) fine-grained sediment at the crest that reflects a mixture or enrichment of proximal environments. The observed segregation is indicative of typical grain-selective transport on the stoss slope (Watson, 1986), but it also reveals a contrast between the mineralogy of the quartz-rich contemporary flux and the mining of older carbonate-rich strata. The erosion appears to rework the ancient megadune core stratigraphy, as evidenced by the caliche fragments (Cf) (Figure 11) and shallow-surface samples of LGM age (Figure 3). This may indicate that significant megadune construction in glacial times was driven by sediment sourced from the proximal carbonate-rich Halfayn drainage system. It remains an open question whether this sediment was recycled from southerly sources and carried northwards by ISM winds, or transported directly from the western megafans by strengthened Shamal winds. Late Pleistocene paleoclimate proxy data suggest that Shamal was the dominant winds during glacial cycles (Caley et al., 2011; Clemens & Prell, 1990; Pourmand, Marcantonio, & Schulz, 2004; Sirocko et al., 1991; Sirocko, Garbe-Schönberg, & Devey, 2000); however, this challenges the prevailing understanding of megadune formation and warrants further investigation of the megadune stratigraphy.
6 CONCLUSIONS
The objective of this paper was to develop a methodology to classify ultrahigh- and medium-resolution satellite datasets and interpret local-to-regional mineralogical trends within the context of the Wahiba Basin of Oman. The methodological approach utilises band ratio analysis and the SAM algorithm on a WV-3 and ASTER dataset and discovers sufficient spectral resolution to determine the dominant absorption features of quartz (Si-O), ferric iron (Fe3+), ferrous iron (Fe2+) and carbonate (CO32−) in mixed sediment. Validation with ground samples and comparison with a Sentinel-2 dataset enabled the expansion of local observations to a regional scale.
The results indicate that dune field zones inherit the mineralogical compositions of adjacent sediment sources. This is notably evident in the following geomorphic provinces: (1) Quartz-rich sediment from the Al Huqf drainage and local Huqf dune fields is transported by northward longshore drift and southern ISM winds, respectively, imprinting on the Coastal Sands, Low Sands, central High Sands and the Halfayn drainage system; (2) bioclastic-rich grains from Coastal Sands are transported by southern ISM winds to the Peripheral Sands, becoming entrained in active reworking zones but not surviving far into the High Sands; and (3) mafic/carbonate-rich sediment from northern drainage systems imprints on the western and northeastern margins of the High Sands, carried by westerly Shamal and south ISM winds, respectively.
Megadunes contribute to their own sediment supply through deflation and reveal underlying mineralogical compositions. This is particularly evident on the western margin and interior core of the High Sands, where increased carbonate content suggests significant reworking of antecedent stratigraphy. The mineralogical signature of the ancient stratigraphy might suggest that glacial dune building was dominated by strengthened westerly Shamal winds sourcing Halfayn sediment, although further field investigation is needed to confirm this hypothesis.
The Wahiba dune field mineralogy reflects a dynamic sediment cycle influenced by climatic and eustatic forces in a basin surrounded by diverse source areas. Detailed mineralogical observations underscore the sensitivity of contemporary geomorphic surfaces to local variations in sediment dynamics, such as deflation and accumulation. The ability to observe these characteristics at multiple scales proves invaluable in interpreting dune field evolution.
ACKNOWLEDGEMENTS
In memory of Professor Emeritus Gary Kocurek, whose invaluable guidance has greatly impacted this research. Gary's extensive contribution to aeolian sciences continues to inspire and guide our research. We are grateful to the Ministry of Heritage and Tourism, Oman, for their hospitality and assistance in sample collection. This study was funded by Shell Exploration and Production Company.
CONFLICT OF INTEREST STATEMENT
The authors declare that they have no known competing financial interests or personal relationships that could have appeared to influence the work reported in this paper.
Open Research
DATA AVAILABILITY STATEMENT
Derived data supporting the findings of this study are available from the corresponding author on request.


