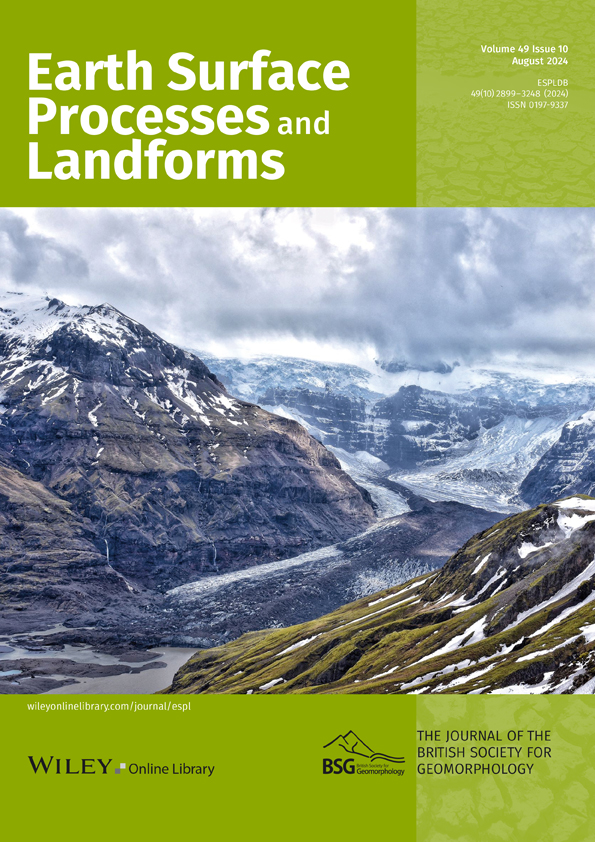
Predisposing, triggering and runout processes at a permafrost-affected rock avalanche site in the French Alps (Étache, June 2020)
Abstract
Although numerous recent studies have explored the relationship between permafrost degradation and rock slope failure, there is still a need for in-depth investigations to develop relevant hazard assessment approaches. We investigate the predisposing, triggering and propagation processes of a rock avalanche (c. 225,000 m3) that occurred in Vallon d'Étache (France) on 18 June 2020, whose scar was coated by ice and water. Weather records and energy balance models show that the rock avalanche occurred right after the warmest spring and winter since at least 1985, but also right after the spring with the highest water supply anomaly (snowmelt and rainfall). Measured ground surface temperature and geoelectrical surveys reveal that relatively ice-rich permafrost could exist in the NW face (release area) while it is inexistent below the SE face, contradicting certain permafrost maps. Heat transfer simulations suggest that the rock avalanche occurred during a transition from cold to warm permafrost conditions at failure depth (30 m), with a temperature increase of up to 0.6°C per decade since 2012 (when considering potential snow cover effect), and current temperature ranging between −3 and −1°C, depending on the applied model forcing. This warming certainly contributed to predispose slope to failure. In addition, the shift towards warm permafrost and water infiltration potentially enhancing permafrost degradation along fractures through heat advection or favouring the development of high hydrostatic pressures may have played as triggering factors. Finally, propagation simulations show that the rock avalanche involved several phases with different rheological properties due to the incorporation of snow and material segregation within the deposit. These new insights at various scales highlight the complexity of the triggering and propagation processes of rock slope failure occurring in high mountains, a significant part of which can be linked to snow effects on ground temperature, water supply and rheological properties.
1 INTRODUCTION
In the European Alps, the air temperature has increased by 2°C on average between the end of the 19th and the beginning of the 21st century, with an acceleration since 1980 (Beniston et al., 2018; Böhm et al., 2010; Nigrelli & Chiarle, 2023). High mountain environments are highly sensitive to this rapid climate change and the degradation of mountain permafrost is one of the consequences (Etzelmüller et al., 2020; Magnin et al., 2024). In steep alpine rock slopes, permafrost degradation is thought to be responsible for an increase in rockfall and rock avalanche frequency (e.g., Gruber & Haeberli, 2007; Huggel et al., 2010; Ravanel et al., 2017; Ravanel & Deline, 2011; Savi et al., 2021; Stoffel et al., 2024; Tapia Baldis & Trombotto Liaudat, 2019). The ongoing cryosphere degradation results in new landscapes of bare bedrock, unconsolided and unstable materials and new lakes (Haeberli et al., 2017). In this context, major rock slope failures can generate cascading processes such as debris flows or glacial lake outburst floods (Haeberli et al., 2016). These high-magnitude and chain-reaction hazards are sometimes responsible for major damage and numerous casualties, as shown by some recent examples around the world (e.g., Byers et al., 2018; Huggel et al., 2005; Shugar et al., 2021; Svennevig et al., 2020; Zheng et al., 2021). For instance, in the European Alps, the rock avalanche of Piz Cengalo in 2017 (3 × 10⁶ m3, Switzerland) killed eight people and the resulting debris flows destroyed part of the village of Bondo (Mergili et al., 2020; Walter et al., 2020). This is a striking example that echoes historical events such as the rock avalanches on the Brenva Glacier (Italy) in 1920 and 1997 (Deline et al., 2015).
In high mountain environments, mid-sized rock slope failures (a few hundreds to a few tens of thousands of cubic metres) have shown an increase in their frequency in concomitance with increasing air temperature since the 1990s (Fischer et al., 2012; Ravanel et al., 2010; Ravanel & Deline, 2011), especially during the recent summer heat waves (Fischer et al., 2012; Legay et al., 2021; Paranunzio et al., 2019; Ravanel et al., 2017; Temme, 2015) or after climate anomalies (Paranunzio et al., 2016). Numerous thermo-hydro-mechanical processes are possibly causing the destabilisation of permafrost-affected rock-walls (Gruber & Haeberli, 2007; Krautblatter et al., 2013). The weakening of ice-filled fractures cementing bedrock compartments has been extensively investigated through laboratory experiments (e.g., Davies et al., 2001; Mamot et al., 2018, 2021) and can directly explain failures occurring in warm permafrost conditions (i.e. > − 2°C; e.g., Deline et al., 2011; Frauenfelder et al., 2018; Legay et al., 2021). Other processes related to water infiltration may locally degrade the permafrost through heat advection, and erode the ice-infill in fractures, even under cold permafrost conditions (i.e. < −2°C; Hasler, Gruber, & Haeberli, 2011). Water circulation can also cause hydrostatic pressures of several hundreds of kPa (Magnin & Josnin, 2021), which is enough to trigger rock slope failure in an ice-sealed rockwall (Stoll et al., 2020). These processes are more difficult to appraise because of their non-linearity, but some documented events suggest that hydrostatic pressure may have played a role in their triggering (e.g., Fischer et al., 2010). The frequent presence of ice and water in scars, observed shortly after rock slope failures, is another evidence of the potential role of these different processes (e.g., Deline et al., 2011; Frauenfelder et al., 2018).
In spite of the demonstrated relationship between increasing air temperature, permafrost degradation and rockwall instability, notably through laboratory experiments (Davies et al., 2001), there is still a lack of in-situ data and observations to obtain a clear physical understanding of the triggering and propagation mechanisms (Krautblatter et al., 2012). In this respect, detailed multi-scale and multi-method documentation of specific events is an essential step to assess the initiation and development of rock slope failure in order to develop relevant approaches for hazard assessment. In-depth analyses of individual events were previously reported (e.g., Etzelmüller et al., 2022; Fischer et al., 2010; Frauenfelder et al., 2018; Deline et al., 2011) but further studies are still needed to improve the understanding of the underlying processes and to relate field observations to the theoretical understanding of permafrost-related mechanisms in the development and triggering of failure in steep rock slopes. Furthermore, investigation methods such as Electrical Resistivity Tomography (ERT) or numerical modelling of permafrost are rapidly progressing and their use in understanding rock slope failure needs to be regularly appraised (Buckel et al., 2023).
For this purpose, the present study focuses on a rock avalanche that occurred on 18 June 2020 in the Vallon d'Étache (Savoy, French Alps). The classification of this event as a “rock avalanche” is debatable due to its modest volume (c. 225,000 m3), especially when compared to major events reported in the literature (e.g., Coe et al., 2018; Dufresne et al., 2016; Shugar et al., 2021; Walter et al., 2020). Even if the mobility of the flow (height/length ratio 0.56) in relation to its volume is low compared to other events (Scheidegger, 1973; Selby, 1993), the characteristics of the deposit detailed in Section 2, nonetheless point toward a granular flow process, which is a distinctive characteristic of a rock avalanche (Deline et al., 2022; Hungr et al., 2014). Consequently, we have characterised this event as a moderately large rock avalanche, and we will explore and discuss the propagation characteristics in the subsequent sections of the paper (Sections 2 and 5).
The objective of this study is to take advantage of the Étache event to illustrate how the combination of advanced geophysical and modelling methods can help to improve the understanding of the predisposing, triggering and flowing mechanisms involved in rock avalanches in high mountain regions. These are essential steps to develop operational solutions to anticipate and mitigate the risks associated with these processes (Krautblatter et al., 2012).
We purposely leave out the analysis of predisposing factors associated with geologic settings that are common to all rock slope failures (McColl, 2012) in order to focus on the hydrological and thermal mechanisms possibly associated with permafrost dynamics. Furthermore, the Étache rock avalanche is a complex event which has propagated through distinct granular and fluid phases. Deposit remobilisation has been minimal since its occurrence, providing a remarkable study case to investigate the propagation of the rock avalanche. We thus aim to reproduce the full extent of the deposit with different friction parameters during the granular and fluid phases in order to understand the propagation characteristics of the event.
To address these two goals, we analyse climate, meteorological and permafrost conditions before the failure occurrence. We combine in-situ ground temperature measurements, geoelectrical survey and petrophysical analysis, and use energy balance and permafrost modelling approaches to assess the ground thermal regime and its recent evolution around the detachment zone, as well as its potential interaction with water infiltration. In addition, propagation simulations with a depth-averaged flow model are conducted based on three-dimensional (3D) topographical models acquired by photogrammetry, to provide detached volume and runout characteristics of the event. These simulations will improve our knowledge of the thermo-hydromechanical processes involved in a rock avalanche occurring in permafrost conditions, and provide a better understanding of a relatively complex flow process.
2 STUDY AREA AND CHARACTERISTICS OF THE ROCK AVALANCHE
A comprehensive overview of the geographical, geological and geomorphological setting of the study site is first presented (Section 2.1). Subsequently, the detailed characteristics of the rock avalanche that took place on 18 June 2020 are shown (Section 2.2). Finally, the volumes of the rock avalanche, encompassing both the scar and deposition areas, are estimated using high-resolution 3D models (Section 2.3).
2.1 Geographical, geological and geomorphological setting
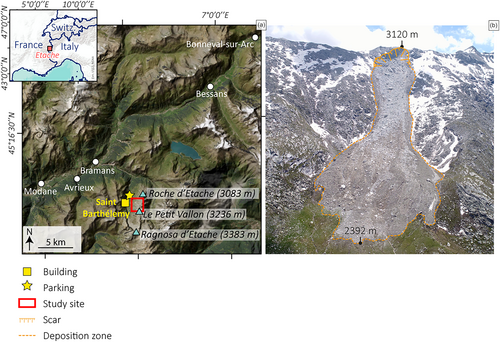
The Vallon d'Étache is located in the Northeastern French Alps, south of the Vanoise massif (Figure 1). Oriented N-S, it reaches its highest point at Ragnosa d'Étache (3,383 m a.s.l.). The valley floor is drained by the Étache stream, and the valley sides are used for pastoral and recreational activities, particularly hiking. A road follows the valley floor and leads to the chalets of Saint Barthélemy with a parking area and hiking trails.
The bedrock is mostly composed of quartzites, micaschists, metamorphic sandstone, conglomerate and gneiss. A fault-oriented NE–SW is located on the failure scar, with contact between micaschists on the NW and quartzites on the SE (Figure 2a). According to McColl (2012), the fault could be a predisposing factor for the rock avalanche occurrence.
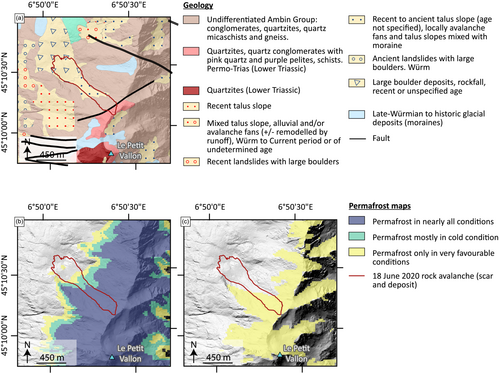
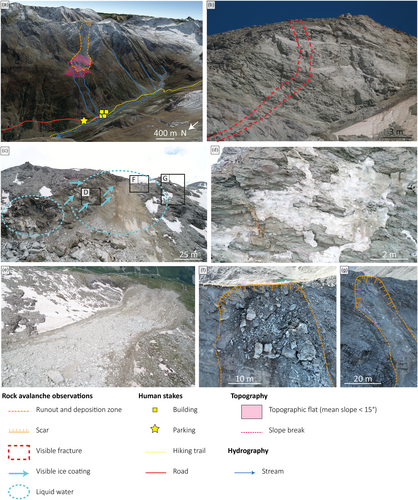
Glacial and periglacial processes strongly shaped the landscape of the Vallon d'Étache, which was a glacial valley during the Quaternary. Tills are still covering the bottom part of its S side, whereas tills and moraines on both sides of the crest line likely correspond to glacier extent during and after the Little Ice Age (LIA). Airborne images show that the volume of ice around le Petit Vallon has strongly decreased between 1953 and 2019 (SI.1). Gelifluction lobes and gelifracts supplied by freeze–thaw cycles to talus slopes reveal that periglacial conditions are now predominant. This confirms the Permafrost Favourability Index (PFI) from Marcer et al. (2017); Figure 2b), calibrated with rock glacier inventory, climatic and topographic data, which suggests that the rock slope failure occurred in an area favourable to permafrost in all conditions, whereas the permafrost model by Boeckli et al. (2012a, 2012b), calibrated with rock surface temperature measurements and climate parameters, suggests that it occurred in an area of permafrost occurrence only in favourable conditions (Figure 2b,c). However, the PFI tends to overestimate permafrost favourability in current climatic conditions because the active rock glaciers used for the model calibration are inherited from the LIA climate conditions. The permafrost model by Boeckli et al. (2012a) designed for rock walls that are typically considered as directly coupled with the atmosphere (i.e., no consideration of surface cover such as snow or debris) was implemented with the 1981–2010 air temperature provided by Météo France using S2M meteorological and snow cover reanalysis (Vernay et al., 2022). The permafrost favourability index calculated from this model can be interpreted as “permafrost only in favourable conditions”, which are typically highly fractured and partially snow-covered bedrock (Boeckli et al., 2012b) and that can host a relatively large amount of ice, delaying the permafrost's response to air temperature. The presence of permafrost is confirmed by visual observations of ice in the scar in June 2020, alongside water flow marks (Figure 3c,d).
2.2 Characteristics of the rock avalanche
On 18 June 2020, a rock avalanche was triggered at 3126 m a.s.l. from a scar-oriented NW on the crest line between Roche d'Étache (3,083 m a.s.l.) and Le Petit Vallon (3,236 m a.s.l.) summits in the Vallon d'Étache. No earthquake has been recorded at this date according to the SismAlp observation network (Isterre, France; https://sismalp.osug.fr/). The rock avalanche propagated down to an altitude of 2,392 m a.s.l. for the lowest boulders of the deposit. No significant damage to infrastructure occurred; the deposit covered part of a pasture area that was used by local farmers and destroyed 10 sheep pens. Airborne pictures taken 2 days after the rock avalanche show that sporadic snow cover was still present on the NW slope (Figures 1b and 3e), suggesting that the rock avalanche could have propagated over a layer of snow in some areas and that some snow could have been transported and incorporated into the flow itself. In the source area, the rock is highly shattered and fractured, and a large fracture is visible, suggesting that additional volumes of rock could be released in the near future (Figure 3b). The rock avalanche propagated over a drop height of 728 m and a total runout length of 1,296 m, giving an apparent coefficient of friction H/L of 0.56 and an Energy Line Angle (ELA; Heim, 1932) of about 29°.
The rock slope failure was triggered on an average slope angle of c. 43° (calculated from a 20 cm resolution Digital Elevation Model [DEM] from the IGN, Institut national de l'information géographique et forestière). The mean slope angle of the entire deposition area is 27.5°, with an upper topographic flat surface of 130 m in length, located 900 m (horizontal distance) and 580 m (vertical distance) away from the top of the scar (Figure 3a). The front of the deposit reached a lower flat surface whose slope is < 15° (Figure 3a).
The rock avalanche stopped 150 m upstream of a slope break (Figure 3a), and 600 m upstream of the chalets of Saint Barthélemy (vertical distance: 390 m), a car park and a hiking trail (Figures 1a and 3a).
Since the June 2020 failure, other instabilities have been identified in the source area. For instance, in August 2022 (the date is based on the testimonies of shepherds), minor rockfalls occurred in the vicinity of the scar (Figure 3f,g), causing a retreat of the crest line. Additionally, visible fractures in the ground and bedrock (SI.2) suggest a regressive erosion of the crest line and a predisposition to future failures.
2.3 Geometry of the rock avalanche scar and deposit: 3D volume reconstruction, thickness map and surface roughness index
The volumes of the scar and the deposit of the Étache rock avalanche are calculated by comparing the IGN 20 cm DEM from 2015 with a post-event high resolution (20 cm) 3D model of the area built by photogrammetry on the basis of two drone surveys carried out in 2021 and 2022. Two methods have been employed. The first one compares raster maps from the photogrammetric model and the IGN DEM, while the second one directly compares the 3D point clouds. The detailed 3D calculation of both methods and their results are given in Appendix A. Given the apparent instability of the scar since the rock avalanche occurred, there may have been minor events such as boulder falls between 18 June 2020 and the drone surveys, that cannot be differentiated from the main event.
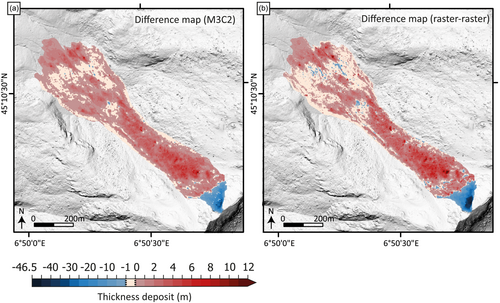
The scar ranges from 3,126 m to 3,000 m a.s.l, with a width of 180 m. With the raster comparison method, the volume of the scar is 229,261 m3 with an average thickness of the scar of 14.7 m and a maximum thickness of 46.5 m. With the point cloud comparison method, the volume of the scar is 221,862 m3. The deposited volume is estimated to be 314,300 m3 with the raster comparison method and 337,600 m3 with the Multiscale Model to Model Cloud Comparison (M3C2) method (Lague et al., 2013; Appendix A). Thus, both calculation methods provide consistent results with 6.9% uncertainty. The difference between the volume of the deposit and that of the scar can be explained by an expansion coefficient of 1.37. The expansion coefficient is in agreement with other studies (e.g. Knapp & Krautblatter, 2020). In other words, under the assumption of negligible erosion processes during the propagation, the density of the flowing material involved in the avalanche propagation decreased by about 37% from the release area to the runout area. The deposit surface is 175,535 m2. The average thickness of the deposit is 1.8 m, and the maximum thickness is 12.6 m. Maximum thicknesses are observed in the upstream-central part of the deposit, which also concentrates most of the volume (230,000 m3; Figure 4a). Furthermore, thickness in the lower part is highly variable, with areas characterised by very thin thickness and surface roughness on the break in slope (Figure 4b, where the surface roughness is calculated as relative values of the blocks in relation to each other with a “Terrain Roughness Index” [QGIS tool]) and a thicker deposit with coarser materials on the two flats areas and the terminal front. This distribution of deposits is similar to the one observed for the rock avalanche in Crammont (Italy) in 2009 (Deline et al., 2011). The slightly negative values are in Figure 4a (ranging between −1 and 0 m) may not correspond to erosion but to areas where the deposit was very thin, as observed in photos taken in the post-event days (Figure 3e). These slightly negative values could also result from the time gap between the rock avalanche and the drone survey (2021 or 2022, depending on the deposition sector), during which thin material was removed from the deposit.
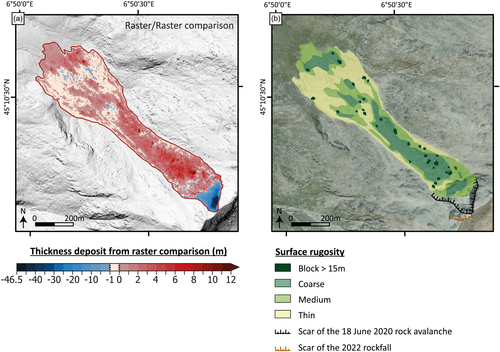
Observation of the rock avalanche deposit from drone photographs (Figure 3e) shows grain-size segregation, with the largest blocks mainly located in the upper part of the deposit and an apparent larger fine content in the lower part. The surface roughness index computed from the post-event 3D model (Figure 4b) shows coarse and medium material upstream and in the central part of the deposit, whereas fine material is visible at the front and on the edges of the deposit. The roughness index can be considered as a proxy of the surface grain-size, thus confirming that most of the coarser debris appears to have accumulated in the thick upper and middle parts of the deposit, while the thinner lower parts are mostly constituted of fine material. This contrasts with fronts of granular flow deposits that are generally enriched with large boulders due to segregation mechanisms. Lastly, the highest values of the roughness index correspond to zones with the thickest deposits, and vice versa. All these specific features of the Étache rock avalanche deposit may be related to the incorporation of snow within the material during the propagation. This point will be further discussed in Section 5.
Finally, the deposit shows several features suggesting a flow-like propagation process corresponding to a (moderately large) rock avalanche: (i) a continuous and relatively thick deposit with well-defined contours, (ii) a significant flow runout, even if a significant fraction of the volume remained in the upper part of the zone and (iii) a mixture of blocks of different sizes with patterns of grain-size segregation.
However, the overall shape and contours of the avalanche deposit remain rather simple, with no observation of levee formation or fingering.
3 METEOROLOGICAL CONTEXT
Climate and weather conditions prior to the failure are here used to assess their potential role in the rock avalanche predisposing and triggering. We use records from the closest weather stations, which are at Bessans (1713 m a.s.l.; heated weather station), c. 20 km NE of the study site and Bonneval-sur-Arc (1830 m; 27 km NE; Figure 1). At Bessans, the precipitation time series began in 1981, and air temperature measurement in August 1984. Snow depth has been recorded since 2009 at Bonneval-sur-Arc with a gap in the records from 01 January to 25 April 2018. We adopted the 30-year reference period of 1991–2020 for this study.
3.1 Air temperature
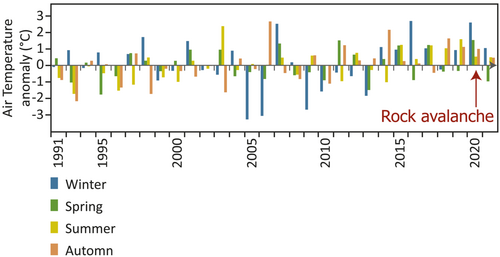
The years prior to the rock avalanche were characterised by significantly higher air temperature than that of the reference period (1991–2020), with yearly averages frequently exceeding the average of the reference period by 1°C. In the years 2015, 2018, 2019 and 2020, the temperature was particularly high, with values respectively 1.07°C, 0.85°C, 0.78°C and 1.24°C higher than the average of the reference period. The annual average for 2020 (5.36°C) was the warmest since 1985 (the beginning of meteorological records). In 2019, the summer (June to August) and autumn (September to November) were notably warm, with temperatures exceeding the average for the period of 1991–2020 by +1.59°C and +1.13°C, respectively. The 2020 winter (December to February) and spring (March to May) were respectively the second warmest (+2.6°C compared to the 1991–2020 average) and warmest (+1.54°C) since 1985 (Figure 5). The entire period (i.e. summer 2019 to spring 2020) has been the warmest on record with the average air temperature exceeding by 1.74°C that of the previous summer to spring periods of 1991–2020.
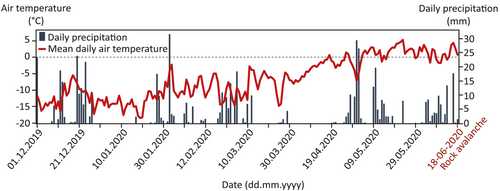
Assuming an adiabatic lapse rate of about 0.6°C per 100 m (Rolland, 2003) between the Bessans weather station and the rock avalanche scar location, the mean daily air temperature remained regularly above 0°C from 04 May to 18 June 2020 (Figure 6). During the month preceding the event (19 May to 18 June 2020), the mean air temperature at the scar location was estimated around 1.8°C, with a maximum daily average temperature of 5.3°C on 23 May and a minimum of −1.7°C on 9 and 10 June.
To sum up, the rock avalanche occurred during a period of positive temperature anomalies, aligning with the global increase of temperature in the Alps (Beniston et al., 2018; IPCC, 2019) and on a global scale (IPCC, 2021). Many studies demonstrated that climatic factors could indeed play a role in the triggering of rock slope failures (e.g., Legay et al., 2021; Paranunzio et al., 2016). In light of our meteorological analysis, the identified climatic anomalies have partly contributed to the occurrence of the rock avalanche in the Vallon d'Étache.
3.2 Precipitation and snow depth
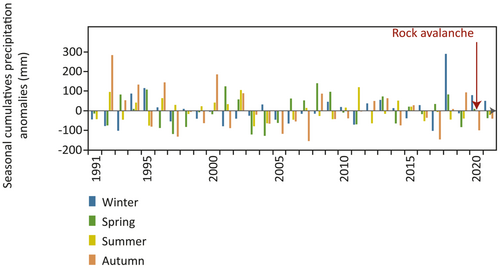
Since 2014, there has been a consistent pattern of below-average cumulative annual precipitation compared to the reference period in Bessans weather station, with the exception of 2018 and 2019, which were, respectively, +38.2% and +1.1% above average. In 2018, extreme winter precipitation (481 mm) was recorded, with cumulative precipitation (290 mm) + 151.4% above the winter average for the reference period. The cumulative precipitation records during the 2020 winter (December to February: 271.2 mm) are +41.6% (80 mm) higher than the average of winter cumulative precipitation during the reference period, while the spring records (March to May; 224 mm) show that the cumulative precipitation was only +4.4% (10 mm) higher (Figures 6, 7). However, heavy precipitation episodes occurred during the weeks preceding the event, especially from 30 April to 2 May (65 mm) and from 9 to 18 May (61 mm), while 36 mm of precipitation was recorded the week prior to the event (12–18 June 2020), representing 15% of the spring 2020 precipitation. Finally, there was significant precipitation within the 3 days prior to the event (16–18 June 2020; 19 mm), representing 8% of the spring 2020 precipitation (Figure 6). But these values are recorded at Bessans weather station, which is 1,400 m lower in altitude than the rock avalanche scar. Considering an adiabatic lapse rate of 0.6°C per 100 m on the study site, the extrapolated daily temperature is sometimes below 0°C (Figure 6), thus precipitation was maybe snowfall near the rock avalanche starting zone.
At Bonneval-sur-Arc weather station, the snow depth measured from December 2019 to May 2020 was +47.7% higher than in the previous 10 years (+130 cm compared to the 2010–2019 period; Figure 8). The snow depth over the winter period was on average 186 cm, which is +48% (60 cm) higher than that during the 2010–2019 winter period. In spring 2020, the mean snow depth was 217 cm, which is +18% (24 cm) higher than the average snow depth recorded in spring between 2010 and 2019.
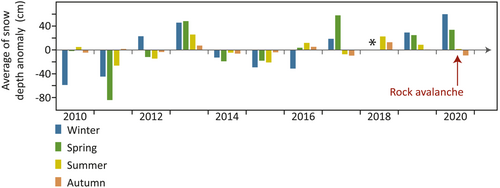
Analysis of precipitation and snow depth data in Bessans and Bonneval-sur-Arc, and air temperature extrapolated to the altitude of the scar, suggests that the rock avalanche predominantly occurred during a period of snowmelt, precipitation and possible rain on snow events, possibly leading to substantial water infiltration and runoff within the weeks and days preceding the event. The liquid water visible in Figure 3c supports this hypothesis, and the models presented in Sections 4.2 and 4.3 will help to test this hypothesis.
4 GROUND THERMAL CONDITIONS
To determine ground thermal conditions around the failure area, we combined four methods: in-situ temperature measurements (Section 4.1), energy balance modelling (Section 4.2), 2D physic-based thermal modelling (Section 4.3) and a geoelectrical survey combined with petrophysical analysis (Section 4.4).
4.1 Ground surface temperature
4.1.1 Ground temperature measurement
In order to characterise the ground thermal regime and permafrost conditions around the release area, Ground Surface Temperature (GST) was monitored using miniature temperature data loggers (IButton®, DS1925LF5#). Thirteen loggers were installed at c. 10 cm below the surface to avoid direct solar radiation heating, with an elevation range from 2,675 m to 3,116 m a.s.l., and different ground and sun-exposure conditions (SI.3). Temperature was monitored hourly from 6 July 2021 to 7 October 2022, parameterising the sensor with a 0.0625°C precision (Figure 9a,b). The MAGST calculation is based on data from 01 October 2021 to 30 September 2022, corresponding to one hydrological year.
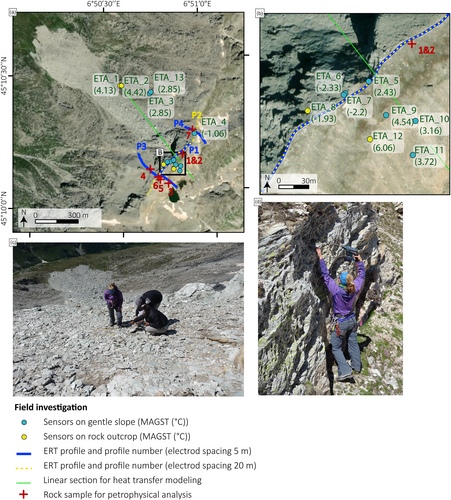
Nine loggers were installed in gentle slopes where a snow cover effect is expected (e.g., Figure 9c), while the 4 others were installed on rock outcrops or steep slopes where snow-free conditions are expected (e.g., Figure 9d).
4.1.2 Ground surface temperature analysis
At the scar altitude, mean annual ground surface temperature (MAGST) computed over the 2021–2022 hydrological year (01 Oct. to 30 Sept.) ranges from −2.33 to −1.93°C on the NW face and is 2.43°C on the SE face. Sensors installed at lower altitudes to measure lapse rate show a MAGST ranging from 2.85 to 4.42°C and from 3.16 to 6.06°C on the NW and the SE faces, respectively. Mean daily GST over the 2021–2022 hydrological year are displayed in Figure 10. Sensors affected by snow are visible through dampened daily oscillation or through persistent sub-zero temperature in winter and spring (ETA_3; ETA_4; ETA_5; ETA_9; ETA_10; ETA_11; ETA_13; Figure 10a,b). Some of these sensors have also recorded relatively low temperatures in winter, as ETA_ 4 with GST of −4.6°C under snow (from 01 Dec. 2021 to 31 May 2022) which suggests permafrost at depth (Haeberli, 1973). The sensors which have recorded the lowest MAGST are ETA_6 (−2.33°C) and ETA_7 (−2.2°C), located at 3112 m a.s.l. and oriented NW. These sensors are placed on a gentle slope area and are likely affected by snow. Nevertheless, they both recorded large temperature ranges during the winter and spring (Figure 10c). This is probably due to the fact that they are placed on a crest, where the wind likely erodes the deposited snow, preventing the onset of a thick snowpack.
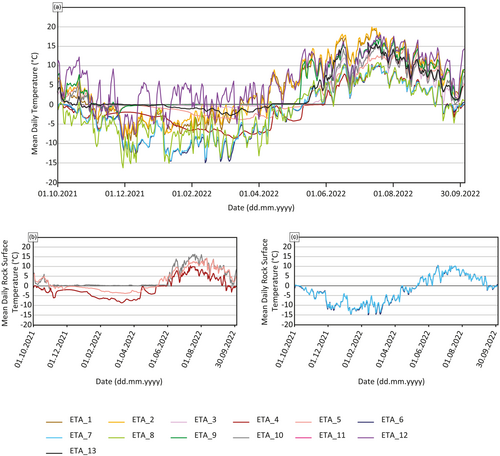
Since the recorded air temperature during the 2021–2022 hydrological year was 0.9°C above the average temperature of the 1991–2020 period, the temperature at depth is probably lower than the MAGST measured during 2021–2022 as a result of the past colder decades.
While this temperature dataset gives a detailed overview of the site, its spatial and temporal representativeness are limited. Thus, to reconstruct temperature over time and space, thermal models must be used; but these measurements remain essential to constrain them (see Sections 4.3 and 4.4).
4.2 Energy balance modelling
4.2.1 Model ensemble: S2M SAFRAN, CROCUS and CryoGRID
In order to assess the potential water infiltration (quantity and timing) from snowmelt and rainfall, and to create a surface temperature time series to force the heat flow simulations (Section 4.3), we calibrated a model ensemble that was recently adapted to steep mountain slopes (Ben-Asher et al., 2023).
The CryoGrid model simulates the ground thermal regime and water mass balance (Westermann et al., 2023) using the finite-difference method. Previous studies successfully used versions of the CryoGrid model to simulate processes in steep rock walls and mountainous regions (Legay et al., 2021; Magnin, Josnin, et al., 2017; Myhra et al., 2017; Schmidt et al., 2021). Recently, it was adapted to simulate the hydrological mass balance in steep rock slopes (Ben-Asher et al., 2023).
The ground domain, representing the rock slope, is simulated as a 1D gridded column with a depth of 100 m. Ground temperatures are calculated using diffusion and advection by vertical water flow in the rock, based on Richard's equation of unsaturated flow (Richards, 1931). The lower boundary condition is provided by a constant heat flux, based on field measurements, to account for possible lateral heat fluxes coming from surrounding rock faces (Legay et al., 2021). A low porosity value was applied (1%) to limit infiltration in the model and conserve the full potential of excess water at the surface in each time step (i.e. the amount of water that could potentially infiltrate).
The upper boundary is calculated by a surface energy balance using the S2M-SAFRAN (Vernay et al., 2022) and ERA5 (Hersbach et al., 2020) datasets for the atmospheric forcing. In addition to surface energy balance, the CryoGrid model is implemented with the state-of-the-art CROCUS snow scheme (Vionnet et al., 2012), which provides representations of snow cover dynamics, and water drainage. To account for steep slopes, where snow accumulation is affected by gravity, a threshold value of maximum snow thickness was applied using a linear function of slope angle (Ben-Asher et al., 2023). Between angles of 45° to 75°, maximum snow thickness linearly decreases from 0.8 m to 0 m.
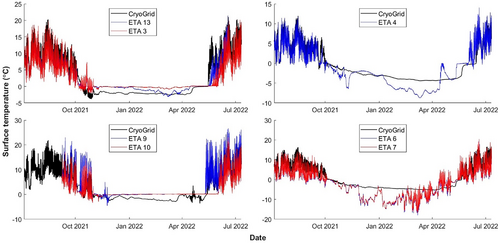
The model was calibrated using measured surface temperature data from field sensors (ETA_3; ETA_4; ETA_6; ETA_7; ETA_9; ETA_10) that recorded from July 2021 to October 2022. The calibration was made by changing the variables of snow accumulation factor (ratio between snowfall and snow accumulation), ground roughness length and rock albedo within constraints. More details and model parameters are provided in Appendix B.
In the model output, two potential sources of water were considered for infiltration into rock fractures: rainfall and snowmelt.
4.2.2 Simulated ground surface temperature and water supply anomalies
Figures 11 and 12 display the simulated ground surface temperature and water supply for a ground surface point representative of the pre-failure slope (elevation 3,108 m; aspect 320°, slope 32°). The simulated GST data are then used as forcing data for heat transfer simulation (Section 4.3).
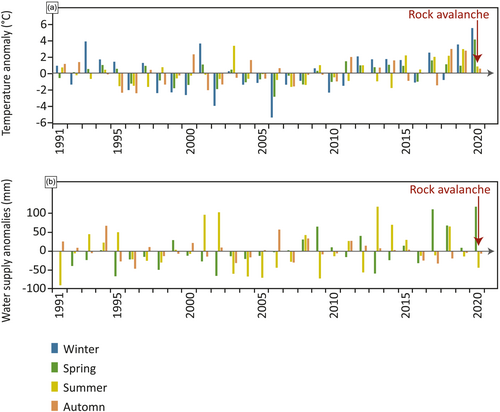
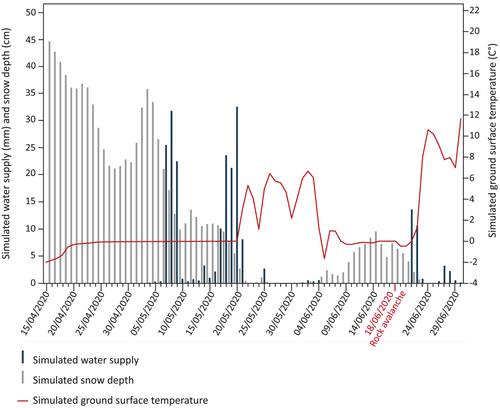
At the seasonal timestep/scale, the energy balance simulation shows that the 2020 winter (December to February) and spring (March to May) recorded the warmest GST compared to the 1991–2020 reference period. Comparison of the seasonal averages during this period shows that winter 2020 was +5.5°C warmer, and spring 2020 was +4.1°C warmer (Figure 11a); these are respectively 2.9°C and 2.6°C higher than the air temperature anomaly. Beyond the reference period, spring 2020 also had the largest available water supply (rainfall and snowmelt) since 1958 (the beginning of the S2M_SAFRAN data series), surpassing the average for the reference period of 1991–2020 by 120 mm (Figure 11b).
At the daily timestep, the model revealed a significant water supply available for infiltration during May 2020 (Figure 12), extending up to 14 days prior to the event. This period coincided with substantial precipitation (Section 3.2) and snowmelt. Water supply started after the onset of snow melting because, in the modelling approach, the snow pack first absorbs the meltwater and water runoff only occurs when the snow pack is saturated (Ben-Asher et al., 2023). Figure 12 further illustrates that the model simulated an accumulation of snow in the days prior to the rock avalanche, transforming the observed heavy rainfall at Bessans Automatic Weather Stations (AWS) into snowfall at the scar location. This implies two potential scenarios: either there was a time lapse between infiltration and triggering (supported by observable water traces in the scar as shown in Figure 3c), or the simulated snowfall was entirely or partially rainfall under real-world conditions. In the latter scenario, the model would have failed to accurately represent this aspect due to its uncertainty around the 0°C threshold. In the latter case, an immediate response to water infiltration occurred, but was not captured by the model, thereby underscoring its limitations for short-term analysis. It is furthermore noteworthy that substantial snowmelt was simulated 3 to 6 days after the event.
Based on these simulations, the rock avalanche happened after a winter and spring with outstandingly high GST, well higher than the air temperature. The GST records are unprecedented since the start of the modelled time series (1958). The rock avalanche also occurred during the spring with the greatest water supply ever simulated since 1958. These exceptional ground thermal conditions and water supply for infiltration could have played a major role in the occurrence of the rock avalanche.
4.3 Modelling permafrost evolution
In order to estimate the thermal state of the release area when the rock avalanche happened, we modelled the temperature evolution in the source area using the (hydro) thermal model Feflow (DHI, version 7.4; Clausnitzer & Mirnyy, 2015; Feflow user guide, 2016). The two-dimensional (2D) domain was defined using the IGN 20 cm resolution DEM (resampled at 1 m resolution; Section 2.3), with a linear section oriented NW-SE which intersects the rock avalanche scar (green line on Figure 9). The domain was extended down to 5 km below the surface to include the geothermal flux in a realistic way (Figure SI.4). A triangle mesh gradually coarsening with depth was applied. The water flow was not taken into account in the simulations. Instead, the entire domain was constrained in order to be fully saturated, by applying a constant hydraulic head of 3,140 m (slightly higher than the maximum elevation, though) as a boundary condition at all surface nodes. A very low hydraulic conductivity of 10−12 m s−1 is also applied to the entire domain so that no significant flow is allowed. Freeze and thaw effects are accounted for through the piFreeze (version 1.001) extension included in Feflow. The main parameters are shown in Table 1.
| Parameter | Value | References |
|---|---|---|
| Porosity | 5% | Magnin & Josnin, 2021 |
| Heat capacity of liquid water | 4.2 × 10⁶ J m−3 K−1 | Magnin & Josnin, 2021 |
| Heat capacity of rock | 1.8 × 10⁶ J m−3 K−1 | Magnin & Josnin, 2021 |
| Heat capacity of ice | 1.86 × 10⁶ J m−3 K−1 | Petrenko & Whitworth, 2002 |
| Thermal conductivity of water | 0.65 J m−1 s−1 K−1 | Magnin & Josnin, 2021 |
| Thermal conductivity of rock | 3 W m−1 K−1 | Magnin & Josnin, 2021 |
| Thermal conductivity of ice | 2.2 W m−1 K−1 | Petrenko & Whitworth, 2002 |
| Latent heat of freezing | 334 × 103 J kg−1 | Magnin & Josnin, 2021 |
| Freezing temperature | 0°C | |
| Freezing temperature interval | −1 °C to 1°C | |
| Geothermal flux | 7 × 10⁻² W m−2 | Mommessin, 2015 |
| Mesh elements | 5,460 | |
| Mesh nodes | 3,132 |
The model was first run with constant temperature forcing at the surface, for a sufficiently long time to reach equilibrium (Figure SI.4).
4.3.1 Forcing data and simulations
We performed two simulations, which differ by the forcing boundary conditions applied at the surface. In Simulation 1, we used the time series of air temperature measured in two surrounding Automatic Weather Stations (AWS), linearly fitted to the rock surface temperature measured by sensors (Section 3): Bessans (Section 3.1) and Avrieux (1,102 m a.s.l.; Figure 1). Bessans air temperature shows the best correlation with Rock Surface Temperature data (RST) at daily timestep (0.88 against all sensors, 0.92 against the subset of 6 sensors which show no snow coverage; SI.3. But records at Bessans started in August 1984, and to further extend the temperature reconstruction, we used air temperature data from Avrieux AWS, which operates since October 1948 (correlation coefficient 0.87 against all sensors, 0.91 against the subset of 6 sensors). The air temperature data from both AWS is linearly interpolated. The y-intercept was adjusted for SE and NW slope, so that the resulting temperature time series have the same average value as the measured one (Section 3) over the 1 October 2021 to 30 September 2022 year (SI.3). For this purpose, the annual mean of sensors ETA_8 (for the NW side at 3110 m a.s.l.) and ETA_12 (for the SE side at 3088 m a.s.l.) were selected since they are both unaffected by snow and placed on outcrops. Last, an adiabatic gradient of 6°C km−1 was further applied to account for the altitudinal effect and create a surface temperature time series for all model nodes. It does not account for the presence of snow. Conversely, in Simulation 2, the surface temperature boundary condition is provided by the energy balance modelling outputs (Section 4.2.2), which account for the snow effect. The main parameters of both simulations are summarised in Appendix B.
4.3.2 Results and interpretation
The results of both simulations are presented in Figure 13. Overall, simulation 1 exhibits a strong temperature gradient between the SE and NW sides (Figure 13a), which is the direct consequence of the temperature offset between both aspects: the mean annual temperature was almost 8°C warmer on the SE side than on the NW side in snow-free conditions (SI.3). The temperature difference between SE and NW slopes can extend to several Celsius degrees, leading to a strong horizontal heat flow (Noetzli et al., 2007). Consequently, one should anticipate both warming and water infiltration from the warmer side towards the permafrost on the colder side of the mountain, penetrating deep within it. Simulation 2 exhibits a smoother pattern, with a less pronounced gradient between both aspects (Figure 13b). Both simulations agree with (i) the absence of permafrost on the SE side, and (ii) the presence of permafrost at depth on the NW side, with a minimum temperature which would be comprised between −2°C and −3°C. Taking into account the uncertainties of these simulations, the permafrost in the detachment zone could thus be cold or warm.
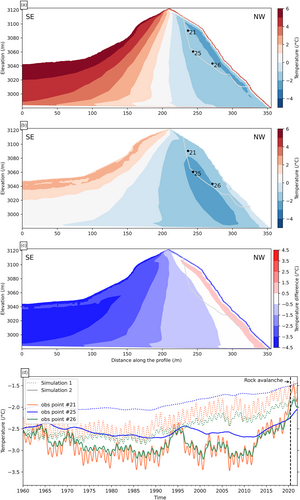
The temperature difference between both simulations is plotted in Figure 13c. Interestingly, despite the conceptual differences in temperature boundary conditions, the temperature simulated in the detachment zone is similar in both simulations. This figure also clearly illustrates the effects of snow, which can be twofold (Magnin et al., 2015; Magnin, Westermann, et al., 2017). During the winter season, the snow cover has an insulating effect which limits ground cooling. Conversely, the high albedo of snow can significantly delay the seasonal thaw, leading to an overall cooling effect. This second effect depends on the aspect and on the slope: for instance, an N face with a steep slope has no or little sun exposure, thus the albedo effect of snow cover will have a very limited impact. Conversely, on a S-facing slope, the albedo effect is much more pronounced. Figure 13c shows that the SE side is up to 4°C cooler in simulation 2, which means that the albedo (cooling) effect is much more important than the insulating (warming) effect. Conversely, the NW side is c. 1°C warmer because the albedo effect is very limited. On the NW side, the insulating effect of the snow is thus dominant.
Figure 13d shows the time series of temperature computed at three observation points located close to the rock avalanche scar, for both simulations. Overall, Simulation 1 shows a steady temperature increase from 1990, while Simulation 2 shows a temperature decrease between 1996 and 2012 and a sharp temperature increase from 2012 onward. The seasonal signal is smoothed at observation points #21 and #26 and is no longer visible at observation point #25, which thus mostly shows a longer-term temperature trend. For points #21 and #26, located respectively 13.5 and 17 m below the surface, the annual trend simulated within Simulation 2 from 2012 to 2022 is 0.096 and 0.114°C a−1. For point #25, located c. 30 m below the surface, the annual trend is 0.06°C a−1. In Simulation 1, the warming rate is significantly lower for this period (0.022, 0.021 and 0.015°C a−1 for observation points #21, #26 and #25, respectively), but sustained for more than three decades, resulting in a net warming of the same magnitude in both simulations (see SI.5 for the same figure with trends). These trends are in good agreement with measured temperature in Alpine boreholes (Etzelmüller et al., 2020; Haberkorn et al., 2021; Magnin et al., 2024).
Qualitatively, it is also striking to see that for the three observation points, the temperature simulated at the time of the rock avalanche had never been reached in the previous decades, with a particularly strong warm anomaly prior to the event. Overall, these simulations consistently show a cold to warm permafrost transition in the detachment zone, during the years and months before the event. These results clearly come as a strong argument to support the hypothesis of a short-term change in conditioning due to permafrost warming, leading to the rock avalanche.
The temperature at the end of the LIA (1850) is estimated by applying a − 1°C offset on the boundary conditions of surface temperature, as compared to the 1961–1990 average (Auer et al., 2007; Böhm et al., 2010; Magnin & Josnin, 2021). The modelled temperatures are presented for both simulations in SI.6. Simulation 1 suggests that there was no permafrost beneath the SE slope, while Simulation 2 (which includes snow cover) indicates the presence of warm permafrost at depth, below the SE slope.
These simulations are obviously simplified, especially since the processes related to the advection of heat along with water flow are not taken into account in the model. For both simulations, the forcing time series of surface temperature have been fitted or calibrated based on a single year of field measurements, potentially leading to an error. In Simulation 2, the two main parameters controlling the snow accumulation (fraction of precipitation accumulating as snow and maximum snowpack height) have been adjusted based on our expertise, but without field measurements available to validate these assumptions. On top of this, constant values of both parameters have been used for the entire simulation, while they may vary through time: especially, high wind conditions might significantly change the snow deposited fraction and/or the snowpack height (as discussed in Section 4.1.2). Despite these current limitations in the presented simulations, the associated biases are expected to be rather stable in time, with interannual variations being smoothed out when considering the thermal state of the area at depth.
To conclude, these results strongly support the hypothesis of a rock slope failure predisposed by a steady permafrost warming and potentially triggered both by the transition towards warm permafrost that is recognised as mechanically unstable (Davies et al., 2001; Krautblatter et al., 2013) and water infiltration possibly causing heat advection and enhanced permafrost degradation along fractures, and substantial hydrostatic pressure (Magnin & Josnin, 2021). Both simulations show that the event affected fairly frozen bedrock. It is also interesting to note that these simulations reveal that the permafrost map based on the rock model from Boeckli et al. (2012b) presented in Section 2.1 displays an underestimation of permafrost extent. Our investigations have led to a more accurate description of permafrost distribution, offering improved insights into both surface and subsurface conditions. Especially, accounting for the effect of snow by combining the energy balance model output as input of the thermal model leads to a more realistic representation of surface conditions as compared to Simulation 1 which does not account for the snow effect. However, it should be kept in mind that the face is a mix of steep slopes and gentler slopes covered with snow and that the temperature at depth is the result of highly variable energy balances.
4.4 Geoelectrical survey and petrophysical analysis
4.4.1 Field acquisitions
In September 2022, we performed an ERT survey to investigate the extension of permafrost in the area of interest in the vicinity of the scar. The main characteristics of these measurements are summarised in Table 2.
| Profile 1 | Profile 2 | Profile 3 | Profile 4 | |
|---|---|---|---|---|
| Date (dd.mm.yyyy) | 06.09.2022 | 06.09.2022 | 08.09.2022 | 08.09.2022 |
| Orientation | NE – SW | NE – SW | SE – NW | NW – SE |
| Number of electrodes | 64 | 32 | 80 | 48 |
| Electrode separation (m) | 5 | 20 | 5 | 5 |
| Profile length (m) | 320 | 640 | 400 | 240 |
| Array of quadrupoles | WS | WS | WS | WS |
| Number of measurements | 1937 | 337 | 2,910 | 965 |
| Number of inverted measurements | 1930 | 337 | 2,910 |
965 |
Four profiles were carried out. Two of them are oriented NE–SW along the crest while the two others are oriented normally to the crest (Figure 9a,b). We used an ABEM Terrameter LS2 for the acquisition. The measurement protocols combine Wenner-α and Schlumberger quadrupoles, with a multichannel acquisition (maximum of four measured channels per current injection). The GPS position of every electrode was measured during the acquisition.
4.4.2 Petrophysical analysis
In order to compare the resistivity changes associated with the formation of ice in the rock, we performed laboratory measurements on the rock samples collected from the rock outcrop, following the methodology developed by Duvillard et al. (2018). Six rock samples of micaschists were therefore taken along the ERT surveys (Figure 9a,b) to measure their resistivity in the laboratory in saturated conditions. The core samples were first cut into 4 cm cubes. Then they were dried for 24 hours at 58°C. Finally, they were saturated under a vacuum with melted snow water (in order to get a range of ionic content as close as possible to the fieldwork conditions). The samples are left 1 month in their pore water solution in order to reach equilibrium. Complex resistivity is measured with a high-precision impedance analyser ZEL-SIP04-V02 (Zimmermann et al., 2008) in the frequency range of 0.01 to 45 kHz. The samples are then equipped with gel carbon electrodes and immersed in a thermally controlled bath (see details of the protocol in Coperey et al., 2019). We investigate the complex resistivity (including polarisation effects) over a temperature range from +20°C to −15°C (Figure 14a).
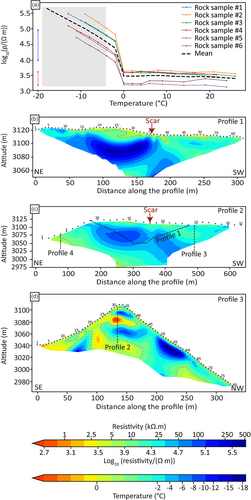
Knowing the rock sample volume, the weight difference between dry and saturated samples allows us to estimate the porosity. The porosity of the six rock samples ranges from 1.2 to 4.3% (average value of 2.3%). The resistivity of unfrozen saturated rock is in the range from 1.3 to 4.7 kΩ m (log values between 3.1 and 3.6). The resistivity of frozen (between 0°C and −15°C) saturated rock is in the range 8.6 to 306 kΩ m. However, the thermal model study (Section 4.3) suggests that the lowest temperature in the surveyed region is likely higher than −4°C. Using this reduced temperature range for frozen saturated rock (between 0°C and −4°C) the resistivity inferred from the laboratory measurements ranges from 8.6 to 104 kΩ m (log values between 3.9 and 5.0). Thus, according to these laboratory measurements, the transition occurs between 5 and 8 kΩ m (log values between 3.7 and 3.9), which allows to interpret the resistivity tomograms shown in Figure 14 in terms of permafrost presence or absence. While these values are very useful to interpret the ERT acquired in the field, it must be highlighted that the resistivity of these saturated rock samples has limited representativeness as compared to the measurements carried out on the field in (at least partly) unsaturated rock, and fractured areas.
4.4.3 Data inversion and results
The raw datasets collected in the field were first filtered to eliminate negative resistivity values, as well as outliers in the pseudo-sections. However, most of the data are characterised by high signal-to-noise ratios and very few points were filtered out (see details in Table 2). The inversion was carried out using Res2Dinv (version 4.8, see Loke & Barker, 1996). The resistivity tomograms are presented in Figure 14b–d for the profiles 1–3, while the fourth profile is shown in SI.7. To help interpretation, the resistivity – temperature relation inferred from the laboratory measurements is shown on the second colour bar at the bottom of Figure 14.
4.4.4 Interpretation of results
Profile 1 exhibits resistivity values larger than 15 kΩ m except at shallow depth, which is consistent with the presence of permafrost in this area, and the presence of an active layer. On the left side of the profile, a maximum resistivity as high as 360 kΩ m cannot be explained solely by the temperature effect: indeed, this would correspond to a temperature as low as ~ − 17°C, which is not realistic (see also Figure SI.8 showing the temperature on the tomograms). This suggests that the ice content is higher than what was measured in the lab. In other words, the macroscopic porosity in the surveyed area is likely exceeding the microscopic porosity of the rock samples analysed in the laboratory. Another striking feature that can be seen on Profile 1 is a clear sub-vertical discontinuity around a distance of 175 m along the profile, which roughly matches the centre of the rock avalanche scar. This raises the question of potential water circulation into a fault, which may have played a role in the destabilisation of the rock wall. Another hypothesis to explain this vertical discontinuity could be a thermal effect of the rock avalanche scar since the ERT surveys were carried out over 2 years after the rock avalanche. We addressed this hypothesis by running additional thermal simulations with, and without the rock avalanche volume, between June 2020 and September 2022 (see SI.9). This shows that the thermal effect is significant, but only in a shallow layer beneath the rock avalanche scar. It is thus unlikely that the discontinuity observed in this ERT profile is due to this localised warming of the scar.
The pattern in Profile 2 is consistent with that of the resistivity distribution exhibited by Profile 1, except that the resistivity values lie in a slightly narrower range, which is explained by the fact that the electrode spacing was four times larger in Profile 2 (Table 2). Nevertheless, the high resistivity values on the left half of the tomogram, and the vertical discontinuity roughly matching the rock avalanche scar location are also clearly visible on this tomogram.
Profile 3 shows a clear difference between the SE and the NW aspects, with low resistivity values below the SE slope which indicates the presence of unfrozen material, while high resistivity values on the NW slope are consistent with the presence of permafrost. Interestingly, the discontinuity observed at a distance of 190 m along the profile roughly matches the location of the fault observed in the scar (see Figure 3b), which again raises the question of the role played by water circulation. Below the crest, the high resistivity values are most likely explained by unsaturated material.
To summarise, these results bring new insights regarding the permafrost distribution as compared to the existing maps (Section 2.1 and Figure 2). Indeed, resistivity profiles confirm the presence of permafrost on the NW side and along the crest (exceeding 100 m depth, extending both vertically and normal to the steep surface), but suggest no permafrost (or only localised patches) on the SE side. Additionally, the scar is located within the permafrost area suggesting that the rock avalanche took place in a warming but not thawed permafrost area. These ERT results are also in good qualitative agreement with the temperature patterns simulated by the thermal model (Section 4.3) and reveal complex structures, such as faults, that are confirmed by field observations and/or geological maps. The combination of models and ERT survey thus brings complementary insights to understand the thermal state and complex structures in the surveyed area.
5 ROCK AVALANCHE PROPAGATION MODELLING
5.1 Methods
Propagation modelling of the Étache rock avalanche was attempted, with the aim of gaining insights into the flow process. Given the overall characteristics of the deposit suggesting a flow-like propagation, and following current practice for modelling rock avalanches (e.g., Peruzzetto et al., 2022; Pirulli & Mangeney, 2008; Sosio et al., 2012), a continuous hydraulic was used and the flowing material was assumed to behave as a granular material. Simulations are performed using a depth-averaged model with a Voellmy friction law (see details in Appendix C). The material is characterised by the two rheological parameters (dry friction coefficient) and (turbulent friction coefficient, in m s−2).
Simulations are performed on the pre-event DEM with a spatial resolution of 0.5 m. The DEM is corrected in the scar to remove the material mobilised by the event. Simulated flows are initiated by releasing a volume of material uniformly distributed over the scar area. In most simulations, we consider a flow volume of 320,000 m3, which corresponds to the total volume of deposited material estimated from DEM differences (see Section 2.3). Note that since flow density is assumed constant in the model, we could not account for the expansion between the volume of the scar and that of the deposit, and hence the final volume value is considered.
Preliminary simulations showed that, while the runout and the distal shape of the deposition zone can be reproduced fairly well using appropriate choices of the friction parameters and , it is not possible to accurately capture the observed distribution of volume in the deposit. Looking for an optimal calibration of these parameters therefore seems pointless, and we limit ourselves to qualitative comparisons between the simulation results and the observed data. In particular, the sensitivity of the simulations to the friction law employed and the associated parameters can provide interesting insights into the complexity of the avalanche flow process.
5.2 Results and interpretations
Figure 15 illustrates three different parameter combinations for which the simulated deposits match relatively well with the observations in terms of total flow runout and shape of the deposition area on the two flat zones. Simulation A ( and m s−2) and B ( and m s−2) correspond to a different balance between the dry and turbulent friction terms, while Simulation C ( and m s−2) effectively corresponds to an almost purely frictional rheology (see Appendix C). Note that the value of the dry friction coefficient in this latter case is relatively close to the value of the apparent friction coefficient given by the ratio H/L (0.56, see Section 2.1), which could be expected. It can also be noted that Simulation B, with a low value of , leads to a larger lateral spread on the right side of the deposit, but with very low thickness values. These three results illustrate the non-uniqueness (or equifinality) of the Voellmy parameters when the extent of the deposit is the only information considered for the calibration (see also Aaron et al., 2019; Zhao & Kowalski, 2022). Additional data relative, e.g., to flow dynamics (propagation time, velocity data, etc.), would be required to improve the selection of the friction parameters.
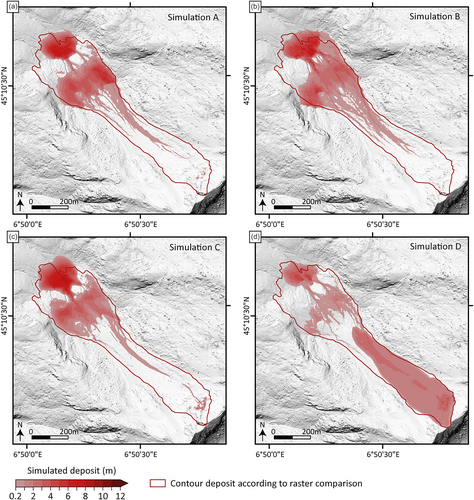
None of the tested parameter combinations, however, could reproduce the actual thickness distribution of the deposit. In the simulations, the thickest parts of the deposits are always located in the two flat zones, especially in the distal lobe whose simulated thickness can reach 8 m (Figure 15; Simulations A, B and C). In contrast, in the observed deposit, most of the volume (i.e. approx. 230,000 m3; Figure 4) accumulated in the upper-central part of the deposit. Only a relatively small fraction of the material propagated further downstream and reached the two flat surfaces, with a thickness that does not exceed 3 m in these zones (apart from very localised patches) and a disperse deposition pattern characterised by areas in which the deposited thickness remained very small (Figure 4).
This inability of the simulations to reproduce the actual distribution of the deposit can be interpreted as an indication that the flow model is oversimplified, and fails to account for important physical processes that were at play during the avalanche propagation. Here, these discrepancies could be related to the observation of a grain size segregation in the deposit, with coarser blocks mainly located in the upper part and relatively finer material in the lower parts (see Section 2.3). Such heterogeneity could have been caused by different mechanisms (e.g., mobilisation of source areas with different material characteristics, flow-induced grain-size sorting). In the present case, we point that flowing over a layer of snow and incorporation of this snow in the front of the avalanche (see Section 2.3) is likely to have played a role in this process, by changing the rheological properties and increasing the mobility of the frontal part relative to the tail of the flow. The role of snow incorporation in the mobility of rock avalanches was also highlighted by Deline et al. (2011) in their analysis of the 2009 rock avalanche at Crammont (Italy), which has many similarities with the event in the Vallon d'Étache (see Section 2.3). In both cases, the coarse material in the upper part of the deposit can also be explained by a second phase of smaller instabilities.
Such complex mechanisms would require more sophisticated modelling tools based, typically, on multiphase approaches (e.g., Deline et al., 2011; Pudasaini & Mergili, 2019). The use of such models, which imply the calibration of numerous additional parameters, goes beyond the scope of the present study. Nevertheless, to assess the plausibility of the proposed interpretation, we performed additional test simulations in which the propagation of the upper and lower parts of the avalanche was modelled separately. For the upper part, a volume of 230,000 m3 was considered. Furthermore, in order to reproduce the relatively homogeneous deposit thickness along the upstream gully, the Voellmy law was enriched by adding a cohesive stress to the frictional contributions (see Appendix C). For the lower part, a volume of 90,000 m3 was considered with a simple Voellmy law. Simulation D in Figure 15 corresponds to the merged deposit obtained with m2 s-2, and m s-2 for the upper part, and and m s-2 for the lower part. Again, the overall shape of the deposit is in reasonable agreement with the observations, but in this case, the thickness distribution also appears to be better reproduced, at least qualitatively. Specifically, the simulated deposit is thicker in the upper-central area as well as at the lower front (compared with Figure 4). Conversely, most of the deposit on the flat zones exhibits comparatively smaller thicknesses. Even if the physical basis of this composite simulation remains debatable, the result thus seems to confirm that the propagation of the Étache rock avalanche involved distinct materials characterised by markedly different rheological properties.
Hence, these numerical simulations allow us to highlight a relatively complex flow process. Consistently with observations of grain-size segregation within the deposit, the results suggest an evolution of the effective rheological properties along the flow, which could be due to the entrainment of snow by the rock avalanche (confirming the use of the term “rock avalanche” for this event). The Voellmy friction law, which is usually employed to model rock avalanches, appears insufficient to fully reproduce the observations. Note that the overall flow runout could nevertheless be accurately reproduced by the model, using different combinations of friction parameters. We would however warn against the direct extrapolation of these results to investigate other scenarios, e.g., for hazard evaluation and anticipation, as the oversimplification of the physical processes at play will likely result in strong uncertainties.
6 CONCLUSIONS
By developing a comprehensive approach combining cutting-edge methods at several space–time scales, we have obtained unique information to decipher the processes that potentially predisposed, triggered and propagated the moderately large rock avalanche of 18 June 2020 in Vallon d'Étache.
The combined analysis of ground surface temperature measurements, permafrost modelling and geophysical sounding strongly support that the main predisposing factor is warming permafrost. Geophysical profiles surrounding the rock avalanche scar reveal high resistivity values (> 10 kΩ m), that correspond to frozen materials. Values exceeding those measured in the laboratory (> 250 kΩ m) likely reveal a relatively high ice content around the rock avalanche scar. While heat transfer simulations confirm the presence of permafrost below the NW face, they also indicate a significant warming trend over the past decade. The simulations show a potential transition from cold to warm permafrost, occurring from a few years to a few months prior to the event, that could be conducive to destabilisation (Davies et al., 2001; Krautblatter et al., 2013). Indeed, permafrost temperature has increased since the 1990s, with a particularly sharp increase observed since 2012 at the depth of failure (reaching up to +0.06°C y-1 at 30 m depth according to the simulation accounting for snow effect at the surface). Both the presence of an ice-rich layer and the steady warming of permafrost have certainly set preconditions for the rock avalanche.
The implementation of an energy and hydrological balance model recently adapted to steep mountain slopes (Ben-Asher et al., 2023) and heat transfer simulations points the combination of water infiltration and intensified permafrost warming as possible triggering factors of the rock avalanche. Meteorological data shows exceptional precipitation and snowfalls record in winter and spring 2020. The energy balance model showed that GST and water supply anomalies during the weeks prior to the event exceeded by far those calculated from meteorological records. Water infiltration may have favoured the development of high hydrostatic pressure or the erosion of cleft-ice as investigated by some previous studies (Fischer et al., 2010; Hasler, Gruber, Font, & Dubois, 2011; Magnin & Josnin, 2021), acting as triggering factor for the event. Preferential water paths have potentially been revealed by the geophysical soundings through the presence of low conductivity layers underneath the possibly ice-rich layers. The depth of these layers could align with that of a fault identified on the geological map. Furthermore, the exceptionally warm winter and spring prior to the rock avalanche may have contributed to the weakening of the rock mass and the occurrence of the rock avalanche.
Simulation of the propagation mechanisms highlights the crucial role of the snow cover. Furthermore, high-resolution DEM from photogrammetric surveys that provided a map of the deposit, its thickness and its surface roughness played a key role in understanding the propagation mechanisms. The cross-comparison between the observed characteristics of the deposit (grain size segregation, highly non-uniform thickness between edges, tail and centre of the deposit) and the dense flow propagation model suggests that the propagation of the rock avalanche probably involved several distinct phases characterised by different rheological properties. The incorporation of snow may have likely changed the rheological properties, contributing to the changing phases and increasing the mobility of the frontal part relative to the tail of the flow.
To conclude, our study points out the crucial role of snow in permafrost dynamics and in the triggering (through water supply) and propagation processes (multiphase approach for complex flow processes). Snow characteristics and evolution thus remain key elements to be taken into account to better understand rock avalanche occurrence and impact in high mountains. A perspective could be high-resolution monitoring to analyse the spatial and temporal distribution of snow cover to improve all modelling steps used in this study.
Finally, our multi-method approach allows to obtain valuable information and data for the scientific communities interested in permafrost and rock slope failure hazard assessment. It highlights the complexity of the processes that can lead to slope failures on different spatial and temporal scales and thus underlines the need for more studies both on a comprehensive approach to specific events and on the detailed analysis of specific processes such as the effects of permafrost warming and related water infiltration.
AUTHORS CONTRIBUTIONS
M. Cathala performed the geomorphological analysis, the meteorological records analysis, the energy balance simulation analysis and the surface temperature data analysis took part in all the fieldwork with the support of other co-authors and made the global analysis. She wrote the main body of the manuscript. J. Bock performed the geophysical data acquisition, processing and analysis. He performed energy balance simulation analysis; and heat transfer simulations and wrote the related parts of the text. F. Magnin conceptualised the study, guided the different steps and significantly edited the text. L. Ravanel performed the preliminary characterisation of the rock avalanche and contributed to the conceptualisation of the study. M. Ben-Asher performed the energy balance simulations. L. Astrade, X. Bodin, P. Deline and S. Jaillet performed the drone survey. K. Genuite significantly contributed to the photogrammetric analysis. G. Chambon and T. Faug performed the propagation simulations. J-Y. Josnin significantly supported the implementation of heat transfer models. A. Revil contributed to geophysical data analysis. J. Richard performed the petrophysical analysis. All authors revised the manuscript carefully.
ACKNOWLEDGEMENTS
This study was funded by the Alpes Ingé SARL (http://alpes-inge.com/), the French Agency for Research and Technology (ANRT) under the PhD CIFRE (Convention Industrielle de Formation par la REcherche) scholarship n°2019/1803, the General Department for Risk Prevention (DGPR) of the Ministry for Ecological Transition and Territorial Cohesion (MTECT) and the French National Agency for Research through the WISPER project (ANR-19-CE01-0018). This research benefited from the scientific framework of the University of Bordeaux's IdEx “Investments for the Future” program/GPR “Human Past”. The authors acknowledge J. Bazin (ONF-RTM), C. Casotti (EDYTEM), C. Coutelle (EDYTEM), Q. Da Silva (ONF-RTM), T. Duvanel (EDYTEM), T. Geay (ONF-RTM), E. Malet (EDYTEM), S. Marpot (EDYTEM), B. Moritz (EOST), S. Roudnitska (ONF-RTM) for their help with fieldwork. The authors thank G. Menard (EDYTEM) for providing coring datasets that were used to estimate the geothermal flux in the studied region. The authors thank Wafaa Bouits for preparing rock samples for petrophysical analysis. The authors also acknowledge the editorial committee for handling the manuscript and the anonymous reviewers for their constructive comments and corrections on the manuscript.
CONFLICT OF INTEREST STATEMENT
Competing interest: The authors declare no competing interests.
APPENDIX A: POINT CLOUD MATCHING AND VOLUME CALCULATION
We used two different topographic acquisitions in order to calculate the volume differences in the rock avalanche scar and in the deposition area. The first survey comes from the airborne LiDAR IGN survey database. It provides 20 cm data over the entire Vallon d'Étache before the rock avalanche event (see Figure A1). The second topographic survey was acquired by drone photogrammetry after the rock avalanche event. It provided a 20 cm dense point cloud over the entire area affected by the failure, covering the rock avalanche scar, the deposit area and its surroundings.
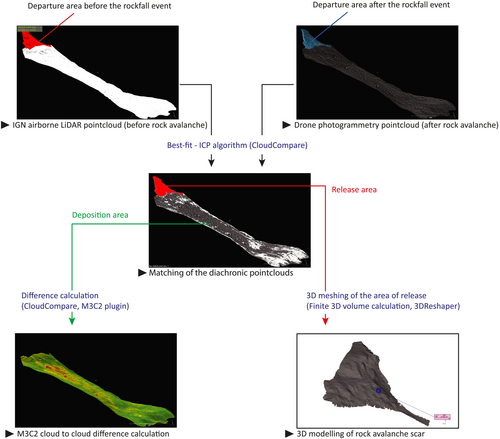
In order to provide comparable data, acquisitions were converted into point clouds with a 50 cm density and replaced in a common 3D environment. In order to overcome the inner limitations of differential GPS georeferencing (dGPS) in high-mountain environment, especially for the drone photogrammetry survey, the final conjoining of the two data was processed by a best-fit (Besl & McKay, 1992) using the CloudCompare software (Girardeau-Montaut, 2016). The best-fit was processed on areas outside of the rock avalanche in order to finely match the point clouds on areas that are not supposed to have moved. The best-fit delivered an RMS error of 50 cm, which is consistent with the previously defined density of the point clouds. The point clouds are therefore well aligned for estimating the rock avalanche volumes.
In order to provide volume estimations both for the rock avalanche scar and the area of deposition, different methods were used. For the rock avalanche scar, because of the importance of the volume, its relatively simple geometry and the quite visible difference between the two point clouds in this area, a Delaunay 3D mesh was applied to the area after having cut and merged the point clouds in a single structure. The mesh was able to provide a finite volume that was calculated at 221,862 m3. By comparing raster maps, the volume of the scar is 229,261 m3 with an average thickness of the scar of 14.7 m and a maximum depth of 46.5 m. Both values differ by less than 4%, which can be considered as insignificant.
For the deposition area, the general geometry is flat and elongated. Consequently, the same method is more difficult to apply. We used the M3C2 distance CloudCompare plugin (Lague et al., 2013) which proposes point cloud-to-point cloud 3D comparisons, using the automatic default parameters: Normals: 14; projection: 14; max depth: (70 m - default); max thread count: 16/16.
The M3C2 map result was then rasterized at 50 cm and a positive/negative value calculation was performed on the SAGA-GIS volume plugin. A positive value of 337,600 m3 was obtained. A similar value of 314,309 m3 was achieved with a simple raster-raster difference map calculation. Both values are similar with 23,291 m3 of difference, which represents less than 7% of the difference (Figure A2).
APPENDIX B: WATER BALANCE SIMULATIONS
The CryoGRID toolbox has a modular structure that makes it suitable for a wide range of terrestrial cryosphere settings and is mainly applied in permafrost environments. The snow module is based on the CROCUS scheme (Vionnet et al., 2012) that simulates snow dynamics as it allows for the transient representation of internal snow properties as well as interaction processes with the atmosphere and ground. Snow surface mass fluxes are also computed with the consideration of energy balance and include latent heat fluxes from evaporation and sublimation following an approach by Boone and Etchevers (2001). Water flow in the snowpack was simulated with a scheme that includes a threshold value of field capacity. At values below the threshold no flow occurs, and above it, flow is governed by gravity and the hydraulic conductivity of the snow. Excess water (potential for infiltration) was set to be produced during snowmelt and rainfall when snow water content exceeds its saturated field capacity if snow cover exists.
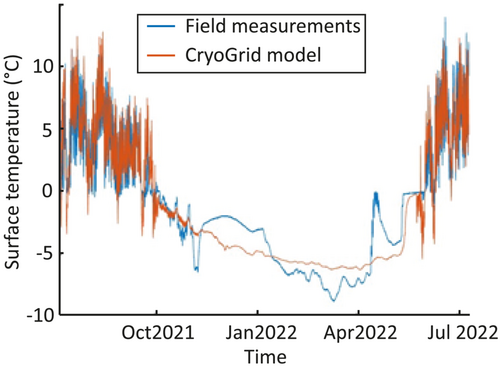
The parameters used in the model are provided in Table B1, an example of simulated surface temperature against measured temperature is given in Figure B1, and the model calibration is explained in Figure B2.
| Parameter | Value | Units | Source |
|---|---|---|---|
| snowfall multiplication factor | 0.25/0.5 | calibrated | |
| heat flux at lower boundary at S/N face | −0.4/+0.4 | W/m2 | Magnin, Josnin, et al. (2017)a |
| Ground albedo | 0.4 | calibrated | |
| surface emissivity | 0.92 | Mineo & Pappalardo (2021) | |
| roughness length at S/N face | 0.01/0.4 | m | calibrated |
| maximum snow depth | 1 | m | Ben-Asher et al. (2023) |
- a Calculated from temperature gradient measured with T sensors. See Legay et al. (2021) for more detail.
APPENDIX C: PROPAGATION MODELLING
Voellmy law was initially proposed for snow avalanches (Voellmy, 1955), and has since then been applied to model numerous other types of granular-type mass flows such as rock avalanches and debris flows (e.g., Pirulli & Mangeney, 2008; Sosio et al., 2012). For rock avalanches, typical values of the friction coefficients and lie in the range 0.05–0.3 and 100–1,000 m.s−2, respectively (Sosio et al., 2008, 2012). An alternative choice of rheology could be the use of a Coulomb friction law, characterised by a single friction parameter (Lucas et al., 2014; Peruzzetto et al., 2022), which is equivalent to considering an infinite value of in Equation (1). To account for the cohesive properties of the material, Equation (1) can also be completed by adding the contribution of constant yield stress .


