Consumer-grade UAV solid-state LiDAR accurately quantifies topography in a vegetated fluvial environment
Abstract
Unoccupied aerial vehicles (UAVs) with passive optical sensors have become popular for reconstructing topography using Structure from Motion (SfM) photogrammetry. Advances in UAV payloads and the advent of solid-state LiDAR have enabled consumer-grade active remote sensing equipment to become more widely available, potentially providing opportunities to overcome some challenges associated with SfM photogrammetry, such as vegetation penetration and shadowing, that can occur when processing UAV-acquired images. We evaluate the application of a DJI Zenmuse L1 solid-state LiDAR sensor on a Matrice 300 RTK UAV to generate digital elevation models (DEMs). To assess flying height (60–80 m) and speed parameters (5–10 ms−1) on accuracy, four point clouds were acquired at a test site. These point clouds were used to develop a processing workflow to georeference, filter and classify the point clouds to produce a raster DEM product. A dense control network showed that there was no significant difference in georeferencing from differing flying height or speed. Building on the test results, a 3 km reach of the River Feshie was surveyed, collecting over 755 million UAV LiDAR points. The Multiscale Curvature Classification algorithm was found to be the most suitable classifier of ground topography. GNSS check points showed a mean vertical residual of −0.015 m on unvegetated gravel bars. Multiscale Model to Model Cloud Comparison (M3C2) residuals compared UAV LiDAR and Terrestrial Laser Scanner point clouds for seven sample sites demonstrating a close match with marginally zero residuals. Solid-state LiDAR was effective at penetrating sparse canopy-type vegetation but was less penetrable through dense ground-hugging vegetation (e.g. heather, thick grass). Whilst UAV solid-state LiDAR needs to be supplemented with bathymetric mapping to produce wet–dry DEMs, by itself, it offers advantages to comparable geomatics technologies for kilometre-scale surveys. Ten best practice recommendations will assist users of UAV solid-state LiDAR to produce bare earth DEMs.
1 INTRODUCTION
Unoccupied aerial vehicles (UAVs; Joyce, Anderson, & Bartolo, 2021) have been transformative in providing a platform to deploy sensors to quantify the topography of the Earth's surface, for investigations from the spatial scale of individual landform features upwards (Piégay et al., 2020; Tomsett & Leyland, 2019). Where logistical or legislative constraints allow flying, and spatial coverage can be achieved timeously, UAV-mounted sensors have largely superseded alternative approaches to surveying, including terrestrial laser scanning (TLS; Brasington, Vericat, & Rychkov, 2012; Williams et al., 2014; Alho et al., 2011). Sensors that have been mounted onto UAVs to acquire data to map topography can be grouped into two remote sensing categories: passive and active (Lillesand, Kiefer, & Chipman, 2015). To date, the former category has dominated geomorphological applications, but technological developments in LiDAR technology herald the potential for the return of more active remote sensing methods for topographic reconstruction.
Passive sensors include digital cameras that are used to acquire images that are subsequently used in Structure from Motion (SfM) photogrammetry (Smith, Carrivick, & Quincey, 2016). Although SfM photogrammetry has enabled a plethora of geomorphic investigations (e.g. Bakker & Lane, 2017; Cucchiaro et al., 2018; Eschbach et al., 2021; Llena et al., 2020; Marteau et al., 2017), there are aspects of SfM photogrammetry that limit what can be achieved to reconstruct topography. The passive nature of the technology poses particular problems for reconstructing bare earth topography; imagery cannot penetrate vegetation cover, and vegetated areas are typically associated with poorer processing quality due to weaker image matching (Carrivick, Smith, & Quincey, 2016; Eltner et al., 2016; Iglhaut et al., 2019; Resop, Lehmann, & Cully Hession, 2019). Shadows caused by vegetation and/or topographic features also reduce and sometimes eliminate the effectiveness of SfM photogrammetry in what are often key areas of a survey such as steep and geomorphologically dynamic river banks (Kasvi et al., 2019; Resop, Lehmann, & Cully Hession, 2019). Whilst workflows to minimise potential systematic errors, such as large forward and lateral overlap of imagery, as well as double grid flying patterns (James & Robson, 2014; Wackrow & Chandler, 2011) have been established, these do not overcome localised errors that arise from image quality, and in many situations, they significantly add to UAV flight time.
In contrast to SfM photogrammetry, active remote sensing offers a direct survey of topography. Airborne Light Detection and Ranging (LiDAR) surveys (Glennie et al., 2013) that have been acquired using sensors mounted on crewed planes or helicopters have been transformative in enabling the construction of digital elevation models (DEMs) at spatial scales >1 km2. Such datasets have been widely used for a variety of geomorphological investigations (Clubb et al., 2017; Jones et al., 2007; Sofia, Fontana, & Tarolli, 2014). Although the importance of these sensors cannot be understated (Tarolli & Mudd, 2020), the cost of the instruments and associated deployment logistics have limited most geomorphologists to using archival airborne LiDAR datasets (Crosby, Arrowsmith, & Nandigam, 2020). Early integration of LiDAR sensors on UAV platforms was demonstrated in forestry applications (Jaakkola et al., 2010; Lin, Hyyppä, & Jaakkola, 2011; Wallace et al., 2012). More recently, UAV LiDAR including topographic–bathymetric systems has been demonstrated across several fluvial environments and applications (e.g. Islam et al., 2021; Mandlburger et al., 2020; Resop, Lehmann, & Cully Hession, 2019; Resop, Lehmann, & Hession, 2021). Despite these pertinent examples, the growth trajectory of UAV LiDAR surveys remains significantly slower than that of UAV SfM photogrammetry when it was in its geomorphic application infancy (Babbel et al., 2019; Pereira et al., 2021), due to the relatively high entry cost of LiDAR sensors and associated large payload UAV platforms required. However, a new generation of cheaper, solid-state LiDAR sensors (Štroner, Urban, & Línková, 2021) offers potential for a return to active remote sensing of dry topography, now using UAV platforms. However, this technology has not yet been applied and assessed in geomorphic environments.
LiDAR measurements in their traditional form consist of a pulse or wave being emitted from a laser sensor, which is steered across an area of interest using moving components (i.e. mirrors) that are precisely aligned and regularly calibrated. Either the time-of-flight between the emission of the laser and its subsequent reflection or variability in the reflected laser frequency is then used to determine range. Many LiDAR sensors can also detect multiple returns (Resop, Lehmann, & Cully Hession, 2019; Wallace et al., 2012), usually based on the intensity of the return. In contrast to traditional LiDAR, solid-state LiDAR systems feature few or no moving parts, being composed of modern electronic components instead. They use an array of aligned sensors, which when combined enable significantly increased scanning rates (Velodyne LiDAR, 2022). The development of solid-state LiDAR can be traced back to obstacle avoidance and navigation for autonomous vehicle development in the mid-2000s when the limited scanning rate of mechanical LiDAR systems was deemed insufficient for these tasks (Pereira et al., 2021; Raj et al., 2020). The difference between mirror-based mechanical and solid-state LiDAR systems parallels the difference between traditional whiskbroom and newer push-broom scanning systems found on space-based satellites (Abbasi-Moghadam & Abolghasemi, 2015). The change in internal components from mechanical to electronic resolves limitations in mounting LiDAR units on UAVs due to the relatively large size, fragility and the cost of mirror-based sensors. Indeed, the escalating demand for solid-state LiDAR units from automotive, robotic production line and autonomous delivery industries (Kim et al., 2019) has necessitated scalable manufacture of these units and a subsequent reduction in unit cost. Moreover, automotive specifications for this technology have demanded a wide field-of-view (FOV) and fine angular resolution to enable higher detail at longer range, meaning solid-state instruments are often of comparable or better quality than their traditional mechanical counterparts.
The aim of this paper is to evaluate the performance of a consumer-grade solid-state LiDAR sensor mounted on a UAV to reconstruct the topography of a vegetated fluvial environment. Our first objective is to acquire and process LiDAR point clouds using a variety of UAV flight heights and speeds and assess their associated horizontal and vertical errors, for a test site, an artificial grass football pitch. Our second objective is to acquire and assess a LiDAR survey of a 3-km-long reach of the braided River Feshie to quantify dry topography. In the discussion, we (i) reflect upon the advantages of consumer-grade LiDAR compared with the existing set of geomatics technologies that are available for geomorphologists to quantify the form of the Earth's surface, (ii) discuss errors in vegetated areas and approaches that could be used to quantify topography in wet areas and (iii) offer recommendations for acquiring airborne LiDAR surveys with UAVs.
2 LIDAR SENSOR AND FIELD SETTING
We focus upon testing a DJI Zenmuse L1 solid-state LiDAR sensor, which integrates a Livox AVIA solid-state LiDAR module, a high-accuracy Inertial Measurement Unit (IMU), and a camera with a 1-inch Complementary Metal Oxide Semiconductor (CMOS) sensor on a 3-axis stabilized gimbal. The DJI L1 solid-state LiDAR sensor was mounted on a DJI Matrice 300 Real-Time Kinematic (RTK) UAV platform, which is capable of undertaking mapping flights of around 35 min with the sensor payload. The aircraft and sensor were linked to a D-RTK 2 GNSS base station by radio to enable the receipt of accurate RTK-GNSS position data.
Testing of the DJI L1 solid-state LiDAR system was undertaken at the University of Glasgow Garscube Sports Campus (Figure 1b) to assess the positional accuracy of the system. An artificial sports pitch was chosen as the initial test site, given the relative flatness of the football pitch, the abundance of pitch markings for check points and the ability to easily distribute and position a further dense grid of ground control targets.
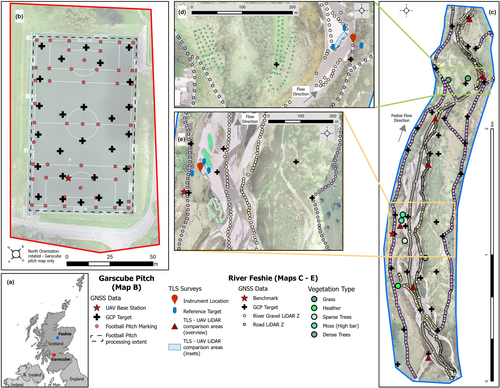
A braided reach of the River Feshie, Scotland, was chosen to assess the LiDAR system in a natural vegetated fluvial environment (Figure 1c). This reach is iconic as a site to assess geomatics technologies for the quantification of topography, including RTK-GNSS (Brasington, Rumsby, & McVey, 2000), aerial blimps (Vericat et al., 2008), TLS (Brasington, Vericat, & Rychkov, 2012), wearable LiDAR (Williams, Lamy, et al., 2020) and RTK-GNSS-positioned UAV imagery for SfM photogrammetry (Stott, Williams, & Hoey, 2020), as well as geomorphological application to quantify sediment budgets (Wheaton et al., 2010) and to shed light on the mechanisms of channel change (Wheaton et al., 2013). This history of innovation, and the low vertical amplitude of topographic variation, made this both an ideal and challenging site to test the use of the LiDAR in a natural environment. The Feshie reach is characterised by a D50 surface grain size of 50–110 mm (Brasington, Vericat, & Rychkov, 2012). At the time of survey, the reach featured a network of shallow anabranches, which were up to c. 1 m in depth and occupied ~15% of the active width. The active reach features a number of vegetated bars, colonised with grasses, sedges and heather, as well as Scots Pine (Pinus sylvertris), silver birch (Betula pendula) and common/grey alder (Alnus glutinosa/Alnus incana). Across the River Feshie riverscape, woody vegetation densities are generally increasing across the valley bottom, including within and on the banks of the active channel, due to an active and ongoing approach to manage deer numbers (Ballantyne et al., 2021). The presence of a variety of vegetation, with different heights and densities, presents a useful applied context for evaluating the ability of the LiDAR system to detect ground returns through vegetation canopies and for point cloud processing algorithms to filter vegetation returns.
3 METHODS
3.1 UAV LiDAR data collection
Flights were planned directly in the DJI Pilot app on the aircraft controller, using imported KML polygon areas. Automated IMU calibration was activated; LiDAR scan side overlap was set to 50%; and triple returns were recorded, with a sampling rate of 160 kHz. The flight path pattern was aligned at both sites to remain within UK CAA Visual Line-of-Sight recommendations for flying UAVs. Moreover, the flight path patterns ensured that sufficiently frequent sharp turning (every 100 s or every 1000 m with a flight speed of 10 m/s) was undertaken for IMU calibration purposes, in line with the manufacturer recommendations. The LiDAR data were stored on an SD card within the DJI L1 solid-state LiDAR sensor.
This initial testing at Garscube consisted of four flights over a synthetic football pitch and surrounds, each with different flying heights (60 and 80 m) and speed variables (5 and 10 m/s; Table 1). At the River Feshie site, the required flight path pattern resulted in the reach being split into six flight blocks (Table 1), which were spaced longitudinally along the valley bottom. Flight lines were orientated in a transverse direction across the valley bottom (approximate maximum for DJI M300 RTK aircraft with L1 solid-state LiDAR sensor payload; 40 mins covering up to 0.4 km2). These separate flights were subsequently merged at later processing stages.
| Flight blocks | Flight parameters | Pre-processing | Post-thinning | |||
|---|---|---|---|---|---|---|
| Flying height (m above takeoff) | Speed (m/s) | Initial number of points | Point density (pts/m2) | Thinned number of points | Point density (pts/m2) | |
| Garscube 1 | 80 | 5 | 7 948 865 | 645 | 1 576 001 | 128 |
| Garscube 2 | 60 | 5 | 10 994 366 | 887 | 1 369 374 | 111 |
| Garscube 3 | 60 | 10 | 5 803 970 | 470 | 1 359 296 | 110 |
| Garscube 4 | 80 | 10 | 4 262 304 | 346 | 1 165 226 | 95 |
| Feshie 1 | 167 801 385 | 403 | 32 417 397 | 82 | ||
| Feshie 2 | 153 049 016 | 370 | 27 223 825 | 66 | ||
| Feshie 3 | 70 | 10 | 76 774 455 | 341 | 16 411 617 | 73 |
| Feshie 4 | 111 741 189 | 343 | 23 009 919 | 73 | ||
| Feshie 5 | 79 409 092 | 333 | 17 002 397 | 71 | ||
| Feshie 6 | 166 018 675 | 358 | 27 331 428 | 62 | ||
3.2 GNSS data collection
Twenty-six chessboard pattern ground control targets were laid in a semi-regular pattern across the Garscube sports pitch (Figure 1b) and measured with a Leica Viva GS08 survey-grade RTK-GNSS, positioned with a bipod for stability. Furthermore, an extra 48 points were collected at distinct sports pitch markings (e.g. at corners; Figure 1b). All the GNSS points collected used the nearby GLAS reference station across Leica SmartNet mobile network corrections, resulting in an average horizontal and vertical quality of <1 cm for the ground control targets, and slightly larger, c. 1 cm for the measurements of sports pitch marks.
Thirty-four GCPs were laid across the Feshie study area to provide XYZ quality checks (Figure 1c–e). These targets were positioned using a Leica 1200 Series RTK-GNSS unit with a bipod for stability. The Feshie GNSS points were corrected using a Leica GS16 in base station mode located over a well-established ground mark that has been used in previous surveys. This resulted in average reported point qualities of <1 cm in both horizontal and vertical. Similar to the football markings, a large sample of points was collected along most of the main estate vehicle tracks within the study site as well as along the dry gravel sections of the river channel area using RTK-GNSS without a bipod and a shorter occupancy (Figure 1c–e). Furthermore, sample points were taken within five types of vegetation cover (grass, heather, sparse tree, dense trees and high bars with moss) to enable assessment of the LiDAR in vegetated areas (Figure 1c–e).
3.3 UAV LiDAR data processing
The Garscube datasets were used to develop a data processing workflow from the point cloud through to an output digital terrain model (DTM; Figure 2); this workflow was subsequently applied to process the River Feshie data. The data were first processed in DJI Terra software to create an initial LAS point cloud file and flight path trajectory files. In this step, processing involved the initial georeferencing of the point cloud, based on the RTK-GNSS onboard the aircraft (direct georeferencing; Dreier et al., 2021), using the Optimise Point Cloud Accuracy setting. The point cloud was then exported in WGS84 latitude and longitude coordinates with ellipsoidal heights. Next, the data were imported into TerraSolid software and processed using the Drone Project wizard in the TerraScan module. In this step, the LAS file output from DJI Terra, as well as flight path trajectory files, were projected to a local coordinate system: OSGB36(15) British National Grid (EPSG:27700) for horizontal position and Ordnance Datum Newlyn (ESPG:5701) for orthometric height.
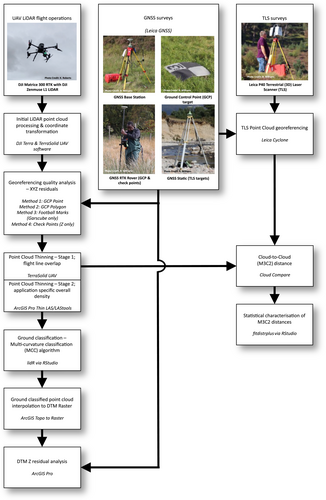
The point cloud data were thinned (Resop, Lehmann, & Cully Hession, 2019) using two processes to reduce and balance the point density such that processing over larger areas (e.g. Feshie study area = c. 1.5 km2) did not become computationally cumbersome because of the high point densities (Table 1). Firstly, overlapping points captured whilst flying along adjacent flight lines were removed using a tool in the TerraScan Process Drone Data wizard, which establishes the closest overlapping point relative to the nearest flight line and discards the other overlapping points, thereby minimising noise in these overlap areas. The data were then further thinned using the Thin LAS tool in ArcGIS Pro to reduce the point density to a point every 15 cm in both the horizontal and vertical, which approximated the required resolution for the geomorphological context of the survey. A similar open-source tool is available through LASTools (rapidlasso GmbH, 2021).
3.4 XYZ residual analysis: GCPs
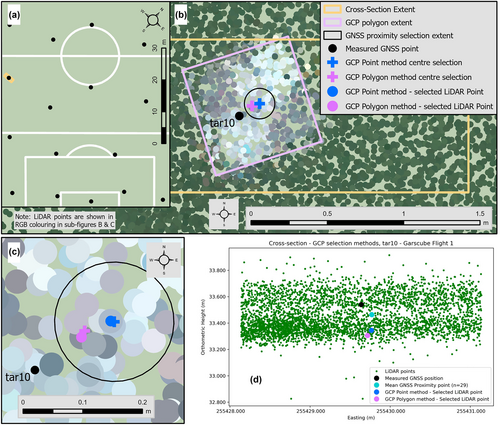
Two methods were used to select LiDAR points from each pre-thinned point cloud for comparison to the known GNSS coordinates in all three dimensions (Easting/Northing/Height). First, a point-to-point method, referred to hereafter as GCP Point, involved digitising a point selection at the centre of the ground target in the displayed LAS file in ArcGIS Pro software. This is similar to the method of GCP selection in SfM photogrammetric processing (e.g. with Pix4D software; Stott, Williams, & Hoey, 2020). The second point-to-point method, referred to hereafter as GCP Polygon, involved digitising a polygon of the extent of the ground control target (c. 0.61 m × 0.61 m) from the displayed LAS data. The centre point of the digitised polygon was calculated and used as the single selection point. At Garscube, the additional GNSS measurements taken on the football pitch markings were also used for residual analysis. A point was digitised at the centre of the intersecting pitch lines (pitch lines were 0.114 m wide), in the same manner as the GCP Point method. This analysis will be hereafter referred to as Football Marks. For all three of these methods, the coordinates from the nearest LiDAR point (in XY) to the GCP selection were subtracted from the GCP coordinates to determine the individual residual for that GCP in each dimension, and summary statistics were calculated for each flight (Mayr et al., 2019).
3.5 Z residual analysis: GCPs and check points
Upon initial inspection of some of the orthometric height results from the point-to-point methods described above, some significantly larger residuals were identified. Further investigation determined that it was caused when the selected LiDAR point was not quite representative of the local sample of points and their recorded orthometric heights (Figure 3d). Therefore, an additional method of residual analysis was devised that used a sample of the LiDAR points located within a 0.1-m radius of the selected location (GCP or check point) to enable the calculation of the mean orthometric height of the LiDAR points within this search radius prior to differencing with the measured GNSS height. This method is herein referred to as GNSS Proximity (Figure 3b/c). For the Feshie, the additional GNSS measurements along the vehicle tracks, dry river bars and in vegetation were used to supplement the GCPs and provide further data to assess the vertical consistency of the LiDAR data across a variety of surface types.
3.6 Ground classification and DTM creation
DTMs were created from the Garscube and Feshie point cloud data. For Garscube, a DTM was created for each of the four test flights, and in the Feshie, a single DTM was created from the combination of the six individual DTMs for each flight block.
To create a DTM from the point cloud, it first needed to have a subset of points classified as ground returns. The lidR library (Roussel & Auty, n.d.; Roussel et al., 2020) within R software (R Core Team, 2021) was used to classify ground returns in the point cloud. This library was used to test different input parameters and ground classification algorithm options, using the Garscube Flight 1 dataset and part of the Feshie point cloud. The tests were undertaken for three algorithm options: the Cloth-Simulation Function (CSF; Zhang et al., 2016), Progressive Morphological Filter (PMF; Zhang et al., 2003) and Multiscale Curvature Classification (MCC; Evans & Hudak, 2007). Once the MCC algorithm was chosen, further testing using various values for curvature and scale parameters was undertaken using on Garscube and Feshie test areas. Default parameters identified by Evans and Hudak (2007), scale (λ or s) of 1.5 and curvature (t) of 0.3, were used based on the findings of these tests. Due to the intensity of computational processing, each of the six River Feshie point clouds was processed separately to extract a subset of ground-classified points.
The ground-classified point clouds (four at Garscube, six at Feshie) were then interpolated into a raster DTM of 0.2-m resolution using the Topo to Raster tool in ArcGIS Pro (Hutchinson, 1989; Smith, Holland, & Longley, 2003). Three flight blocks at the Feshie were merged into a single interpolation meaning only two halves needed merged, using the centre of the overlap zone between Flight 3 & Flight 4. The Feshie and Garscube DTMs were then also assessed for vertical accuracy against the known GNSS heights using data from all the various surface and target types.
3.7 TLS comparison—River Feshie
TLS data collected at seven sample sites across the River Feshie were used to quantify the M3C2 differences (Lague, Brodu, & Leroux, 2013) between the UAV LiDAR and the TLS point clouds (Babbel et al., 2019; Dreier et al., 2021; Mayr et al., 2019). The seven samples varied in spatial extent (n = 148 687 to 3 116 779 point samples), but all focused on gravel bar areas within the active river zone with vegetation and areas outwith the control targets removed prior to further analysis (blue polygon, Figure 1d,e).
The M3C2 differences were calculated in CloudCompare (CloudCompare, 2022) using the default algorithm and settings (Lague, Brodu, & Leroux, 2013; TLS as reference point cloud). The calculated M3C2 standard deviations were used to visualise the minimum and maximum expected values for the M3C2 distributions. Subsequently, the seven samples were combined, and the overall M3C2 distribution was approximated empirically following the procedure presented in Williams, Lamy, et al. (2020). The fitdistrplus R-package (Delignette-Muller & Dutang, 2015) was used to identify reasonable candidate distributions and select the best-fit (Supplementary Materials C).
4 RESULTS
4.1 Garscube XYZ residual results
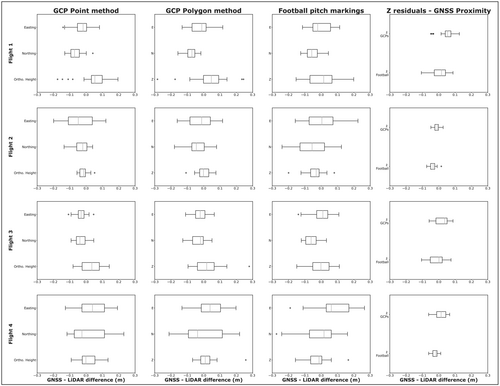
Initial testing of the positional uncertainty of the DJI L1 solid-state LiDAR system undertaken at the synthetic football pitch at Garscube demonstrated sufficiently accurate and precise results with respect to both the horizontal and vertical residuals. These results are summarised in Figure 4, which shows the consistent centimetric-scale accuracy in all dimensions across the four different flight tests, as well as the four different GCP Point, GCP Polygon, Football Marks and GNSS Proximity residual methodologies. The magnitude of the errors across the four flights and three different XYZ comparison methods (ranging between −0.076 and 0.077 m in horizontal and −0.040 and 0.057 m in vertical) are mostly within several guideline thresholds you could expect and consider for this type of data collection (e.g. The Survey Association, 2016; also see Table 2). Firstly, the planimetric and vertical accuracy of the GNSS measurements (Supplementary Materials A) used to calculate the positional residuals of the LiDAR data are comparable. Secondly, considering the average point densities of the pre-thinning point clouds (Table 1), the residual errors of the LiDAR data are again of a similar magnitude as the spacing of LiDAR points (varying between 0.088 m [Garscube Flight 1] and 0.127 m [Feshie Flight 6] spacing between LiDAR points). As a third and final point, our controlled test results here at the Garscube football pitch exceed those quoted by the manufacturers of the equipment, DJI (horizontal: 10 cm at 50 m; vertical: 5 cm at 50 m). The DJI test conditions were similar to those used at the football pitch, with the differences being flying height (DJI = 50 m; Garscube 60 and 80 m), and this work also evaluated a slower flight speed (DJI = 10 m/s only; Garscube 5 and 10 m/s).
| Geomatics technology | Study site | Area of study (km2) | Mean survey density | Error statistics | Reference | |||
|---|---|---|---|---|---|---|---|---|
| Mean horizontal error (μHz, m) | Standard deviation–horizontal error (SDHz, m) | Mean vertical error (μZ, m) | Standard deviation–vertical error (SDZ, m) | |||||
| UAV solid-state LiDAR | River Feshie, Scotland | 1.49 | 358 pts/m2 | −0.050 to 0.011 | 0.055 to 0.112 | −0.048 to −0.002 | 0.037 to 0.058 | This paper |
| Satellite photogrammetry | Cook River, New Zealand | ~15.6 | 0.5 m panchromatic images (Pleiades 1A) | - | - | 0.04 to 0.08 | 0.68 to 0.85 | Zareei et al., 2021 |
| Aerial photogrammetry (crewed aircraft/helicopter) | Davos, Switzerland | 26.35 & 119.0 | Ground Sampling Distance (GSD)–0.25 m | 0.03 to 0.21 | - | 0.10 to 0.33 | - | Bühler et al., 2015 |
|
Aerial infrared (λ = 1550 nm) LiDAR (crewed aircraft/helicopter) |
Tisza River, Hungary | 1.3 | 4 pts/m2 | - | - | −0.15 | 0.17 | Szabó et al., 2020 |
| Terrestrial laser scanning | Rangitikei River, New Zealand | 500 m length reach | 20,000 pts/m2 @ 50 m range | 0.00244a | 0.00139a | - | - | Lague, Brodu, & Leroux, 2013 |
| Mobile laser scanning | River Feshie, Scotland | 0.125 | 50 pts/m2 | 0.014 to 0.025 | 0.019 to 0.038 | 0.051 | 0.028 | Williams, Lamy, et al., 2020 |
| Real-time kinematic GNSS | River Feshie, Scotland | 0.013 | 0.64–1.10 pts/m2 | 0.072 to 0.085 | 0.019 to 0.020 | 0.085 | 0.026 | Brasington, Rumsby, & McVey, 2000 |
| UAV SfM photogrammetry | River Feshie, Scotland | 1.0 | GSD = 23 mm | 0.014 to 0.021 | 0.022 to 0.024 | 0.054 to 0.057 | 0.069 to 0.072 | Stott, Williams, & Hoey, 2020 |
| Leopold Burn, Pisa Range, New Zealand | 0.4 | DEM resolution = 0.15 m | 0.013 to 0.037 (RMSE) | - | 0.022 to 0.046 (RMSE) | - | Redpath, Sirguey, & Cullen, 2018 | |
| Robotic total station | Lemhi River, Idaho | ~0.002 to 0.023 | DEM resolution = 0.1 m | - | - | 0.001 to 0.008 | 0.030 to 0.042 | Bangen et al., 2014 |
- Abbreviations: pts, points; RMSE, root mean square error.
- a TLS target (XYZ combined) errors.
At Garscube, four flights were conducted with one of the objectives being to establish any significant difference between different flight parameters, namely flying height and speed. These parameters influence the point density of the data, as well as the possible coverage area during a single flight or a larger survey campaign with multiple flights (Babbel et al., 2019; Resop, Lehmann, & Cully Hession, 2019). To establish if one of these combinations was optimal based on the above geometric residual results, the Easting, Northing and Orthometric Height residuals of all the GNSS measurements for the four flights were combined (GCP Point, GCP Polygon and Football Marks methods) and statistically compared using a Kruskal–Wallis, non-parametric test. The results of these tests concluded no statistical difference between any of the flights for any of the three dimensions (Easting, Northing or Orthometric Height).
Further investigation of the residuals shows minor variability between the flights in terms of the directionality of the various residuals calculated, notably in the Easting and Northing dimensions. However, the magnitude of this variability was still minimal (c. 0.06–0.08 m) and remained within the expected tolerances described above. Although the same programmed flight path was used for all Garscube flights with the use of the D-RTK base station for the aircraft, the actual flight paths displayed some minor variability, which could be attributed to environmental conditions like the light wind and associated corrections to maintain the flight path to the plan. This variability in flight path may go some way to explaining the minor variance between the different flights that are not explained by changes in flying height and speed.
4.2 River Feshie XYZ residuals
The magnitude and variability of the geometric residuals for the River Feshie site (Figure 5) were comparable with those seen during the Garscube testing, for non-vegetated areas (GCPs, Road, River Gravel; ranging between −0.050 and 0.011 m in horizontal and −0.048 and −0.002 m in vertical). Residuals for vegetated areas were, however, more complex. For these areas, in addition to summarising geometric residuals for all the sample points (Figure 5), Figure 6 shows representative cross-sections through the point cloud for each vegetation type. The residuals of the pre-thinned point cloud in these vegetated areas show significant offsets between the measured GNSS points and selected point cloud data. However, all the trends in the residuals are similar to the magnitude of the vertical dimensions of these different vegetation types. For example, LiDAR data collected in areas with moss (on gravel bars) had a mean average vertical residual of −0.007 m, whereas areas of heather (without trees) had a mean average offset of −0.290 m. With respect to the latter, this is indicative of the LiDAR measurements not penetrating through heather to the ground level, which can be seen in a representative cross-section through the point cloud for this vegetation type (Figure 6). Residuals for grass are similar to those associated with heather, albeit of a smaller magnitude (−0.116 m), most attributable to the lesser density of the vegetation structure. For canopy-type vegetation, residuals demonstrate that the LiDAR is capable of partial penetration through sparse trees but not dense trees; the mean average vertical residuals were respectively −0.297 and −0.883 m for these vegetation types.
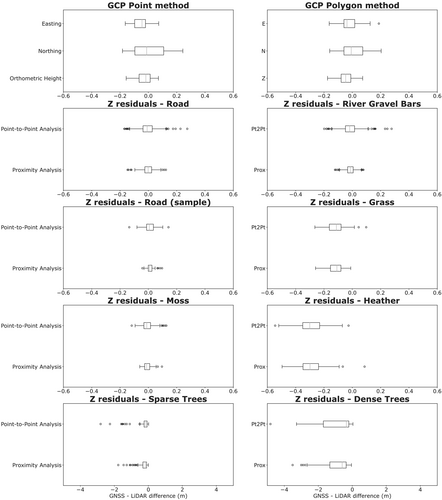
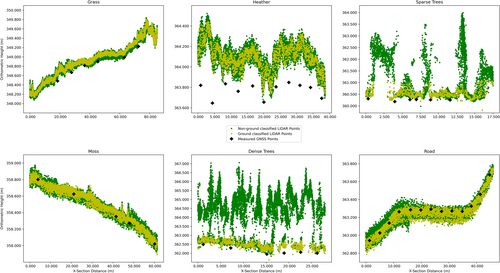
Figure 6 shows several cross-sections from the different vegetated areas, showing how the LiDAR penetrated through canopy-type vegetation, but could only capture the top surface of denser vegetation types like heather.
4.3 Ground classification and DTM creation
Ground classification is a key step to produce a realistic terrain product for further use. Therefore, particular attention was paid to selecting the best algorithm and parameters for the variety of features seen in vegetated fluvial environments.
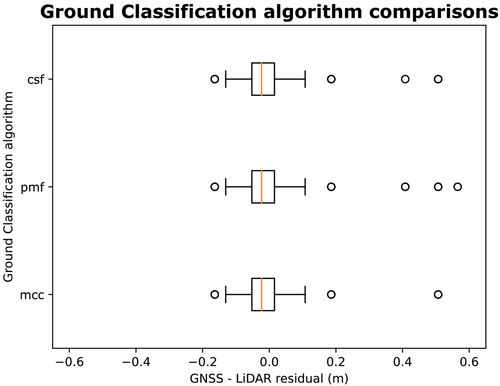
Three different ground class algorithms and a range of associated parameters were tested on Garscube Flight 1 and a test area within the River Feshie site. This resulted in 146 test point clouds being created, with nearly 2500 residual calculations. These residuals were then tested to see if there was any statistically significant difference between any of the algorithms across all parameter settings. Figure 7 shows the distribution of residuals plotted for each algorithm, and almost no difference can be seen between them. All three algorithms converge around minimal to no elevation residual when compared against the GNSS measurements. The performance of the three algorithms could not be statistically separated. The MCC algorithm was chosen (using λ = 1.5 and t = 0.3 as input parameters) for this ground classification for two reasons. First, it gave the best qualitative result by removing non-ground features like buildings and trees from the test sites used. Second, it also did not remove too much data, resulting in large holes in the point cloud that were associated with other alternative algorithms and parameter settings.
Converting point cloud data into continuous gridded raster products required an appropriate interpolation method. Further analysis was undertaken with all four Garscube flights, comparing the Topo to Raster interpolation, available in ESRI ArcGIS products (Hutchinson, 1989; Smith, Holland, & Longley, 2003) and another common methodology in geomorphological applications, converting point data via a triangulated irregular network (TIN) to raster.
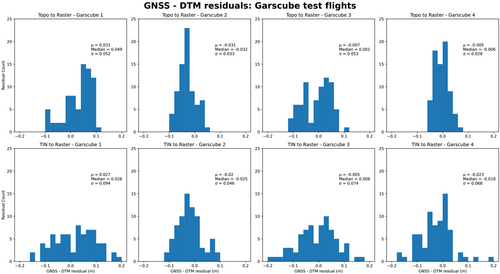
Quantitative analysis of the DTM residuals from the GNSS measurements (Figure 8) across the football pitch showed no obvious difference between the methods. However, Topo to Raster interpolation had a tighter distribution of residuals (indicated by the standard deviations; Figure 8) across all four flights, despite the mean and median of some flights being lower for the TIN to Raster method. Consequently, Topo to Raster was chosen with no drainage corrections applied.
4.4 M3C2 differences
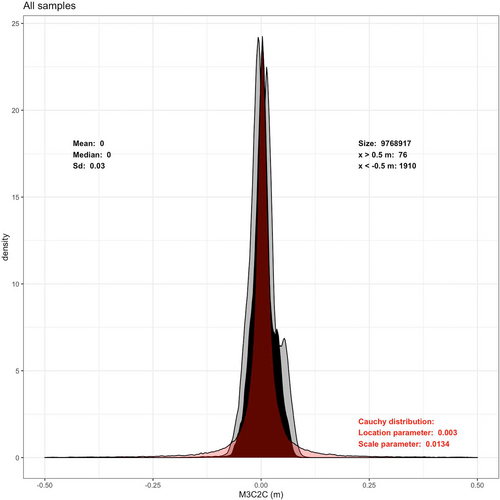
The local M3C2 calculations for the seven sample sites, which compared the UAV LiDAR and TLS point clouds, showed the dominance of marginally zero M3C2 residual values for all the sub-areas. The mean M3C2 residuals ranged from −0.02 to 0.05 m, respectively, with equally low median residuals varying between −0.01 and 0.05 m and tight standard deviations of these M3C2 residual distributions between 0.02 and 0.04 m. Outlier residuals, defined as M3C2 differences greater than 0.5 m, were also minimal across all the sample sites, only representing between 0.007% and 0.04% of the local samples.
The distribution fitting shows how a Cauchy distribution (location parameter = 0.003; scale = 0.0134) outperforms the corresponding Gaussian fitting, for the approximation of the combined M3C2 difference from all areas (Figure 9). The latter is strong evidence for the marginally zero type of the M3C2 difference between the two point clouds (UAV LiDAR and TLS), because the Cauchy distribution is characteristically leptokurtic.
5 DISCUSSION
5.1 Reach-scale topography
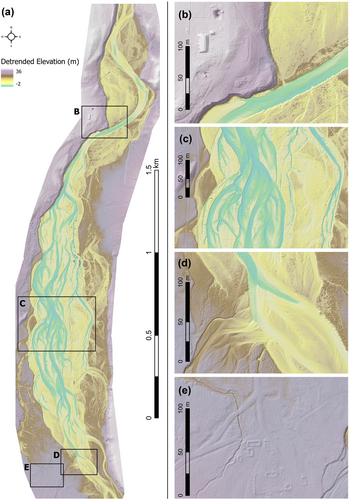
Figure 10a shows the reach-scale DEM of the River Feshie collected using the DJI L1 solid-state LiDAR sensor in September 2021. This figure also highlights particular areas of interest to illustrate the overall quality of the topographic reproduction (Figure 10c,d), some areas where the automated point cloud classification algorithm does not remove all surface objects (Figure 10b) and where historic anthropogenic features can be revealed (Figure 10e). The ground control and vertical check point error assessments at the River Feshie demonstrate that the horizontal and vertical accuracy of point data acquired by UAV solid-state LiDAR is at least comparable with equivalent surveys undertaken on the same reach using SfM photogrammetry (Stott, Williams, & Hoey, 2020) and ground-based laser scanning (Williams et al., 2014). The magnitude of the residuals is comparable with the feasible level of detection in a fluvial gravel-bed river environment due to the surface grain size. Moreover, the residuals must be considered within the context of the LiDAR point spacing, which ranges from c. 0.034 to 0.055 m for Garscube and the River Feshie, respectively. These point spacings are dense for aerial topographic surveys, but the inherent noise in the point cloud data (Figure 6) will likely occlude opportunities for grain size mapping from elevation distributions as demonstrated in a range of investigations that have developed empirical relationships between detrended surface roughness and grain size (e.g. Brasington, Vericat, & Rychkov, 2012; Pearson et al., 2017; Reid et al., 2019).
The UAV solid-state LiDAR to TLS point cloud comparison clearly indicates marginally zero residuals in unvegetated areas. Thus, future geomorphic applications of the DJI L1 solid-state LiDAR sensor need not conduct error analysis assessment to the degree that has been undertaken here to quantify horizontal and vertical residuals. Table 2 summarises the errors from this investigation relative to those from alternative geomatics technologies. The errors reported here, for the River Feshie, using UAV solid-state LiDAR are comparable with those from the other geomatics technologies detailed. However, the UAV solid-state LiDAR system also enables a larger extent to be covered at a much higher survey density. Although the workflow is not fully streamlined into one software application, it is both reproducible and modifiable. Indeed, since data collection and processing of the Garscube and River Feshie datasets, updates to DJI Terra software could further streamline the processing workflow with respect to coordinate conversions, datums and point cloud densities.
5.2 Vegetation and bathymetry
An advantage of using active remote sensing techniques, such as LiDAR, is their penetration of vegetation and thus the ability to derive a bare earth DTM instead of vegetated DSM. In this paper, we demonstrate that the error in vegetated areas varies (−0.007 to −0.883 m; Figures 5 and 6) depending upon the density of vegetation. Several other investigations (e.g. Babbel et al., 2019; Crow et al., 2007; Evans & Hudak, 2007; Javernick, Brasington, & Caruso, 2014; Resop, Lehmann, & Cully Hession, 2019) have found similar limitations related to ground/vegetation classification related to vegetation density, particularly the presence of dense understory vegetation, which significantly reduced LiDAR penetration to ground level. To obtain a true ground measurement, the laser pulse from the instrument has to pass through any canopy and understory vegetation in both directions (i.e. away from the sensor and on return). This can be considered partially a function of the LiDAR sensor's power specification. The DJI L1 solid-state LiDAR sensor produces around 30 W with a maximum of 60 W; our investigation has demonstrated the capabilities of this sensor for penetrating sparse vegetation and the limitations for penetrating dense vegetation. Several authors have described potential considerations, which may improve data collection using LiDAR in vegetated areas including a methodology for canopy and ground penetration estimation, scan angle including overlap percentage (Babbel et al., 2019; Crow et al., 2007) and FOV, seasonal flying during the winter period with less foliage (Crow et al., 2007; Resop, Lehmann, & Cully Hession, 2019) and flight orientations in areas of linear vegetation growth (e.g. plantation forests; Crow et al., 2007). For types of vegetation that are similar to those found in the River Feshie, further experiments could be conducted to assess improvements to vegetation penetration by flying lower, increasing the flight overlaps to >50%, changing the scanning pattern, altering point cloud thinning to ensure more oblique points originating from an adjacent flight line with the FOV are used more and flying after autumnal foliage dieback. The latter is, however, species-specific and would not overcome problems with heather because it does not die back. Overall, it is thus recommended that users always conduct a pre-survey investigation of their site to assess the best approach to minimise errors arising from dense canopy and/or understory vegetation.
A key limitation of the DJI L1 solid-state LiDAR is that returns from terrestrial targets are of direct use without further processing considerations. Returns in wet areas of the Feshie, such as anabranches, had a sporadic distribution of return densities, with some areas having no returns (Babbel et al., 2019; Passalacqua, Belmont, & Foufoula-Georgiou, 2012; Resop, Lehmann, & Cully Hession, 2019), whereas other areas have similar densities to adjacent terrestrial targets (e.g. gravel bars). The identification of wet areas from the LiDAR data alone is not trivial given the inconsistency of return densities. Similar to Pan et al. (2015), in this survey, we conducted a post-survey digitisation to map water extent from the orthomosaic image produced by the camera in the L1 solid-state LiDAR sensor, which was also further supported by measured RTK-GNSS positions along the channel edge. However, several other semi-automated approaches could also be considered to identify the extent of wet areas such as the use of spectral information from the orthomosaic image to colour the LiDAR point cloud (Carbonneau et al., 2020; Islam et al., 2021), waveform feature statistics and neighbourhood analysis (Guo et al., 2023) or using a more advanced geometric approach (e.g. Passalacqua et al., 2010). All these suggested semi-automated approaches currently utilise raster data formats (i.e. orthoimagery or a Digital Elevation Model), but there may be potential to explore the use of the original LiDAR point cloud data. Once the wet area extent has been established, there are three broad approaches that could be applied to reconstruct the topography of wet areas, which could subsequently be fused (Williams et al., 2014) into the dry bare earth DTM. First, wet topography could be directly surveyed using robotic total station, RTK-GNSS or echo-sounding (e.g. Williams et al., 2014; Williams, Bangen, et al., 2020). Second, RGB images that are acquired as part of the DJI L1 solid-state LiDAR survey, to colourise the point cloud, could be used to produce an orthomosaic image and depth could then be reconstructed using spectrally based optimal band ratio analysis (OBRA; Legleiter, Roberts, & Lawrence, 2009), a technique that has been operationalised by Legleiter (2021) in the Optical River Bathymetry Toolkit (ORByT). This approach requires glint-free images, or images with glint removed (Overstreet & Legleiter, 2017), and independent depth observations to select the band ratio that yields the strongest correlation between depth and the image-derived quantity. Finally, the third approach is to acquire a set of RGB images from the UAV platform that can be processed using SfM photogrammetry and then corrected for light refraction through the water column using either a constant refractive index (Woodget et al., 2015) or by deriving refraction correction equations for every point and camera combination in an SfM photogrammetry point cloud (Dietrich, 2017). All three approaches require water surface elevation to be reconstructed before bed levels are calculated; this requires diligence and can be a source of significant error (Williams et al., 2014; Woodget, Dietrich, & Wilson, 2019). Of these three approaches, optical empirical bathymetric reconstruction requires the least additional data collection and processing; direct survey involves time-consuming ground-based sampling, whereas bathymetric correction techniques require images and computational overheads associated with SfM photogrammetry. All these techniques are widely established and have been applied to a range of rivers; it is thus beyond the scope of our investigation to demonstrate these techniques here for the Feshie.
5.3 Best practice recommendations
Table 3 presents a set of 10 best practice recommendations based on our experience of deriving a bare earth DTM of the River Feshie using UAV solid-state LiDAR. The recommendations are organised around the key steps in the workflow that was developed and applied in this investigation. The first three items relate to surveying considerations. Flight planning considerations include the choice of the UAV navigation app and how the UAV will be operated. The length of flight lines needs to stay within relevant UAV flying laws and guidance. This may also be influenced by sensor requirements; for example, the DJI L1 solid-state LiDAR sensor requires flight line length to be <1000 m so that the IMU is regularly calibrated during turning. For large survey areas, such as the 3-km River Feshie reach, battery logistics become important as flight duration is greater than the power that one set of batteries can provide (Resop, Lehmann, & Cully Hession, 2019); locations for flight landing and take-offs to replace batteries need to be accessible and planned. Sensor operation considerations are closely related to flight planning considerations. Flight lines need side overlap of at least 50% but increasing overlap too much, for example to the 80% suggested for SfM photogrammetry (James et al., 2019; Woodget et al., 2015), will result in much longer flight times. Flying lower and slower yields a higher sampling rate and thus greater point density, but this increased sampling rate will result in the use of more battery power. A choice also needs to be made about the number of results to record; the L1 sensor's single outgoing pulse can be received as triple returns. Although not investigated here, these returns can be analysed to characterise vegetation type and density (Resop, Lehmann, & Cully Hession, 2019; Wallace et al., 2012). The third consideration is the acquisition of independent survey data. Appropriate equipment (e.g. RTK-GNSS, total station, TLS) needs to be deployed to sample surfaces that are subjected to error analysis.
| Item | Considerations |
|---|---|
| 1. Flight planning |
|
| 2. Operation of sensor |
|
| 3. Independent survey data |
|
| 4. Coordinate transformation |
|
| 5. Cloud thinning |
|
| 6. Point classification |
|
| 7. Manual point cloud editing |
|
| 8. Interpolation to raster |
|
| 9. Accuracy assessments |
|
| 10. Wet areas |
|
The fourth and fifth considerations are coordinate transformation and cloud thinning. Raw point cloud data need transformation if output in a local or national coordinate system is required. In this investigation, TerraSolid software was used to transform the raw point cloud into the required coordinate system, British National Grid (BNG). However, a recent software update to DJI Terra now offers transformation to BNG, which simplifies this processing workflow. Point cloud thinning needs to consider the point density that is required as output, possibly based off gridded DTM resolution, and the algorithm that is subsequently used to thin both overlap and the overall point cloud.
Consideration seven concerns the approach to point classification; a key step in the process of deriving a high-quality DTM because this determines which points are selected to represent bare earth. This investigation trialled 146 separate algorithms and parameter settings combinations before settling on the default MCC algorithm (Evans & Hudak, 2007). This algorithm was specifically developed for natural, forested areas. This contrasts with classification approaches for more anthropogenically developed areas, where sharper curvatures (e.g. building walls and roofs) are considered, as opposed to softer curvatures with topography and vegetation. As the name suggests, Multiscale Curvature Classification utilises a curvature threshold method to assess and classify ground versus non-ground returns at multiple scales within a local neighbourhood. Haugerud & Harding (2001) developed a similar curvature-based classification algorithm known as Virtual DeForestation (VDF) and suggested that the curvature tolerance parameter (t) should be set at around four times the interpolated cell size. Based on the scale of sediment features in the River Feshie requiring a spatial resolution of around 20 cm for geomorphological analyses, an appropriate curvature tolerance of 0.8 was trialled for the various algorithms. This was found to be quantitatively inseparable from residuals obtained from other parameters but appeared qualitatively inferior to other settings, particularly those outlined by Evans and Hudak (2007) and other lidR package documentation. Sinkhole-type artefacts, seen in some of our early test results with other anthropogenically focused algorithms (e.g. in TerraSolid), were elucidated in Evans and Hudak (2007) as negative blunders resulting from scattering of the LiDAR pulses. The sinkhole artefacts tended to be most obvious on harder surfaces such as road and gravel bars, because of the uniformity of these surfaces. These sinkholes appeared to result from commission errors (classifying non-ground point as ground, false positive) using erroneous points that were below the actual ground and caused these significant artefacts in the first tests of gridded raster terrain model outputs. These sinkhole artefacts did not appear to be replicated in the more natural algorithms like MCC, which was used in the final product, although anthropogenic areas (e.g. farm buildings, Figure 10b) did have artefacts that were of less concern given the topographic context.
Item 8 considers the algorithm choice to interpolate to a raster. Item 9 focuses on accuracy assessment. At the same stage as flight and independent survey data planning, the accuracy assessment requirements need to be considered. It is recommended that these are split into three stages: pre-processing to assess the survey, post-processing to assess the ground classification and raster interpolation to assess the gridded product. Finally, the approach for reconstructing wet areas, if required, needs to be determined. Options are discussed above, in Section 5.2, and may influence flight planning and a need to acquire depth data.
6 CONCLUSION
This investigation has evaluated a new consumer-grade UAV solid-state LiDAR sensor for topographic surveying and geomorphic characterisation of fluvial systems. Given that this new type of LiDAR technology has mainly been used outwith topographic surveying until very recently (Kim et al., 2019; Raj et al., 2020; Štroner, Urban, & Línková, 2021), the importance of our investigation lies in the extensive geolocation error evaluation across study areas with different degrees of topographic complexity.
Our results suggest that, in unvegetated areas, the accuracy of the DJI Zenmuse L1 solid-state UAV LiDAR system is comparable with other current UAV or aerial-based methods such as SfM photogrammetry, and statistically indistinguishable from detailed ground-based TLS surveys. It is possible to produce DEMs that achieve sub-decimetre scale (<0.1 m) geolocation accuracy from the RTK aircraft position alone, even when surveying in fluvial environments that are characterised by ‘noise’ from surface roughness associated with sediment and sparse canopy-type vegetation. However, the solid-state LiDAR sensor was unable to penetrate dense ground-hugging vegetation like heather or thick grass, resulting in elevation bias in areas characterised by these types of vegetation.
Our investigation provides an initial processing workflow for UAV solid-state LiDAR data, when applied to vegetated parts of the Earth's surface. Although the workflow is currently discontinuous, using a variety of different software to process and assess the dense point clouds that are acquired using these sensors, further software development will likely improve processing efficiency. This will enable the characterisation of the topography, and objects such as vegetation, using the increased density of data that UAV solid-state LiDAR provides, and the increasingly large areas that can be surveyed with contemporary UAV platforms.
AUTHOR CONTRIBUTIONS (CRediT)
Conceptualization—Richard David Williams, Craig John MacDonell, Mark Naylor; Data curation—Craig John MacDonell, Kenny Roberts; Formal Analysis—Craig John MacDonell, Georgios Maniatis; Funding acquisition—Mark Naylor, Richard David Williams; Investigation—Craig John MacDonell, Kenny Roberts, Richard David Williams; Methodology—Craig John MacDonell, Georgios Maniatis, Kenny Roberts; Software—Craig John MacDonell; Visualization—Craig John MacDonell, Georgios Maniatis; Writing—original draft—Craig John MacDonell, Richard David Williams, Georgios Maniatis; Writing—review and editing—Richard David Williams, Mark Naylor, Craig John MacDonell, Georgios Maniatis, Kenny Roberts.
ACKNOWLEDGEMENTS
Naylor, Williams and MacDonell were funded through NERC grants NE/S003312/1 and NE/T005920/1. Williams was also funded by Carnegie Research Incentive Grant RIG007856. RTK-GNSS equipment was provided through NERC Geophysical Equipment Facility Loan 1118. The authors would also like to acknowledge field assistance by Geoffrey Hope-Thomson and also thank Glenfeshie Estate for their ongoing support of our fieldwork. University of Glasgow Sport is thanked for allowing access to the sports field facilities.
CONFLICT OF INTEREST STATEMENT
The authors certify that they have no conflict of interest in the subject matter or materials discussed in this manuscript.
Open Research
DATA AVAILABILITY STATEMENT
The UAV and TLS georeferenced point clouds, GNSS check points and final DEM have been made available from the digital depository at the lead author's institution, with an associated DOI (https://doi.org/10.5525/gla.researchdata.1433). Requests for additional data from other processing stages can be made via email to the corresponding author.


