A century of channel change caused by flow augmentation on Sixth Water Creek and Diamond Fork River, Utah, USA
Abstract
The Diamond Fork River in central Utah, USA experienced extreme flow augmentation via transbasin flows. Beginning in 1916, irrigation water was delivered through a tributary, Sixth Water Creek, with daily summer flows regularly exceeding a 500-year flood at the point of introduction. Flows were dramatically reduced by management action in 2004 but with mandated minimum flows. We examined the geomorphic response of Sixth Water and Diamond Fork using aerial imagery, lidar, topographic cross sections, and sediment transport measurements. River channel response varied with valley confinement and with position in the watershed, which determined the magnitude of augmented flow relative to natural floods and the amount of sediment supply. Confined, steep sections of Sixth Water incised many meters into bedrock, whereas partially confined and unconfined sections developed a braided form even under conditions of general incision. With the removal of flow augmentation, smaller natural floods on Sixth Water are unable to transport bed material and the channel remains static. On the alluvial lower Diamond Fork, a lower slope, upstream sediment supply, and larger natural floods produced a dynamic shifting channel that widened in response to natural floods. After flow augmentation, a coarsened bed is partially mobile and channel narrowing appears to be limited by artificial baseflow, which prevent vegetation establishment in the channel.
1 INTRODUCTION
Beginning with the seminal work of Leopold and Maddock (1953), a central topic in fluvial geomorphology is the flow that determines channel dimension. Hydraulic geometry, which describes the relationship between discharge and channel dimension, is a common method to characterize river geometry. Compilations of hydraulic geometry find that channel width typically scales with discharge to the one-half power (Dunne & Jerolmack, 2020; Leopold & Maddock, 1953; Pelletier, 2021). However, there is considerable variability around the average trend, as a number of factors, from hydrologic variability to morphologic complexity, complicate this relationship (Phillips et al., 2022). For example, relatively small floods of long duration or repeat occurrence can alter channel width (Andrews, 1980; Eagle et al., 2021; Gervasi et al., 2021; Slater et al., 2019; Wolman & Miller, 1960). And exceptionally large floods can produce either negligible change or extreme and long-lasting channel change, depending on the timing and geomorphic setting (Dethier et al., 2016; Pizzuto, 1994; Schumm & Lichty, 1963; Wolman & Eiler, 1958; Wolman & Gerson, 1978).
Large flows from transbasin flow augmentation provide a useful perspective on the connection between high flow and channel dimension. Rather than a disturbance and recovery pattern typical of floods, large augmented flows impose a new regime toward which the channel will adjust. Although the duration of high flow is the defining difference between floods and flow augmentation, there are other differences of note. Floods typically increase in magnitude with increasing drainage area, whereas augmented flow is generally introduced at one point in a drainage network such that the magnitude of augmentation relative to natural floods is larger upstream than downstream. Further, if the augmented flow is introduced without sediment, the upstream impact is likely to be erosional, thereby increasing sediment supply to downstream reaches. Downstream reaches thus experience augmented flows, increased sediment supply, and reduced influence of floods smaller than the augmented flows. When floods larger than the augmentation do occur, recovery proceeds in the presence of increased flow and sediment transport capacity.
Channel response to high flows can be strongly influenced by local conditions, including lithology, valley confinement, valley slope, preexisting channel condition, and the prevalence of riparian vegetation (Brierley & Fryirs, 2004; Brunsden & Thornes, 1979; Dethier et al., 2016; Parida et al., 2017; Pfeiffer et al., 2019; Phillips, 2009; Schumm, 1973). Kellerhals et al. (1979) found that channel response to flow augmentation in bedrock systems was controlled by lithologic strength and valley geometry, whereas channels in unconsolidated terrace deposits rapidly established new channel forms as a function of the type of material and the preexisting channel slope. Response in alluvial channels varied from increased channel dimension for smaller augmentations to a transition from meandering to braided for larger augmented flows.
Other studies of channel response to flow augmentation illustrate the combined effect of high flow, preexisting channel form, and local valley conditions. A 2–3 times increase in mean annual flow on the Kemano River, British Columbia promoted channel widening and a reduction in sediment mobility, making the channel more susceptible to a large flood that incised and narrowed the channel (Church, 1995). Channel response to flow augmentation in Rocky Mountain streams in Colorado is controlled by slope, valley setting, and channel grain size. Widening, coarsening, incision, and loss of riparian vegetation occurred primarily in low slope, unconfined reaches (Abbott, 1976; Dominick & O'Neill, 1998; Wohl & Dust, 2012). Bradley and Smith (1984) documented some widening and an increase in meander migration rate on the Milk River, Alberta in response to a threefold increase in summer baseflow, even though high flows remained unchanged. The Little Bow River, Alberta, experienced slight widening and changes in vegetation in response to a threefold increase in augmented flow magnitude (Hillman et al., 2016).
Though the influence of flood flows on channel geometry is well-studied, fewer studies have explicitly considered the influence of low flows on channel geometry. However, there is evidence that elevated baseflows on regulated rivers can influence channel dimensions via feedbacks with vegetation. In arid environments, increased baseflows provide root water for plants, which promotes riparian growth and narrowing (Friedman, 2018; Kui et al., 2017; Sankey et al., 2015). At the same time, persistent inundation can drown out plants, creating a channel with bare sediment to the extent of inundation (Chin et al., 2002; Friedman & Auble, 1999; Lenhart et al., 2013; Sankey et al., 2015).
We report here on channel response to an exceptionally large flow augmentation of long duration on Diamond Fork River (Utah, USA). Starting in 1916, transbasin flows for irrigation were delivered May–September into Sixth Water Creek, a tributary of the Diamond Fork River. The relative magnitude of the introduced flow was larger than any natural flood high in the Sixth Water drainage, decreasing to a 5- to 10-year flood at the mouth of the Diamond Fork River. The augmented flows were highly erosional in Sixth Water Creek, incising the channel and delivering sediment to the Diamond Fork River. The magnitude of the augmentation largely eliminated any influence of natural floods on Sixth Water Creek. Diamond Fork experienced a complex change driven by upstream sediment supply, long-term flow alteration, and large magnitude floods. Augmented flows were removed from most of the Sixth Water drainage in 1997 and from the entire river network in 2004, with the exception of legally mandated minimum flows that are substantially larger than natural baseflows.
Diamond Fork River offers the opportunity to examine channel response to 87 years of exceptionally large augmented flows, followed by the removal of those flows, and the possible influence of elevated baseflows. Our goals in this paper are to document channel response to this flow history, to evaluate how key factors influence channel response, and to assess the efficacy of hydraulic geometry under extreme circumstances. These factors include along-stream variation in the relative magnitude of flow augmentation compared to natural floods, upstream sediment delivery, variations in lithology, and variations in valley slope and confinement.
2 STUDY AREA AND STREAMFLOW HISTORY
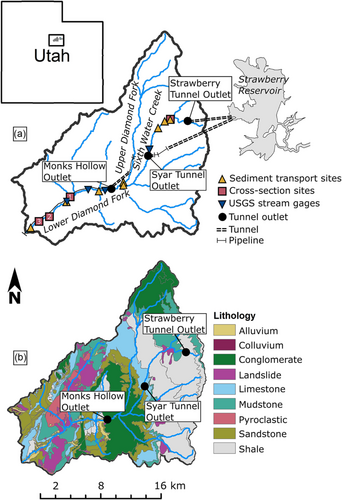
The Diamond Fork watershed drains 400 km2 of mountainous terrain in the Wasatch Mountains of central Utah, USA. The catchment is primarily underlain by Mesozoic sedimentary rocks with terraces, alluvial fans, and landslide deposits that line the channel in some areas (Figure 1b). Valley slope, valley confinement, and channel slope vary considerably along Sixth Water and Diamond Fork (Figure 2). We delineated eight distinct process domains using the River Styles Framework—a process-based method to distinguish river segments (Brierley & Fryirs, 2004). Our process domains are distinguished by valley confinement, hillslope and channel gradient, floodplain type, lithology, tributary junctions, infrastructure, and channel substrate. Augmented flows were introduced into Sixth Water Creek in a steep, bedrock-controlled, confined reach in relatively weak shale and mudstone bedrock (Process Domain 1). Process Domain 2 is a lower slope, partially confined reach with long runs and a wider valley bottom. Process Domain 3 is steeper and more confined, with lithologically stronger bedrock. The channel primarily consists of long runs with limited pool and riffle development. The final process domain (Process Domain 4) on Sixth Water is the most confined in the system and consists of a steep, bedrock-controlled canyon with plunge pools in erosionally resistant conglomerate bedrock.
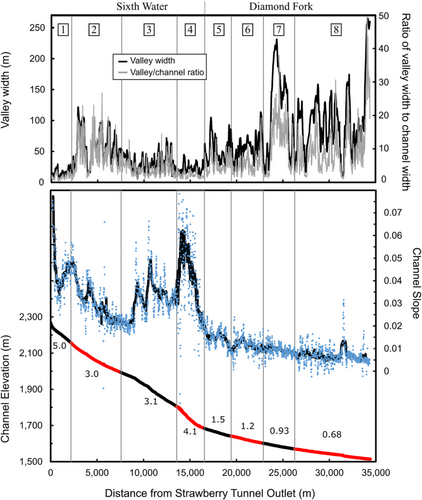
Lower Diamond Fork begins at the confluence with Sixth Water. Drainage area more than doubles from 100 to 240 km2, and valley and channel slope decrease by a factor of three (Figure 2). Valley and channel slope, valley confinement, and grain size all decrease downstream. The river in the upper two Diamond Fork process domains (5 and 6) has a gravel/cobble bed, and the channel is frequently constrained among bedrock valley walls, roads, and alluvial fans. Process Domain 6 is distinguished by the addition of flow from the Monks Hollow Outlet and an anticline that influences the confining bedrock. Process Domain 7 is lower slope with finer grain size and includes infrastructure from multiple campgrounds. Process Domain 8 has the lowest slope, finest grain size, and least confinement, with only alluvial fans and terraces providing confinement.
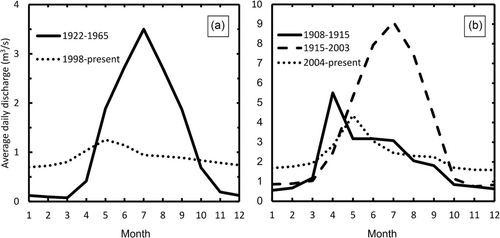
Mean precipitation in the basin is 660 mm/year, with the majority falling as snow in the winter months (PRISM Climate Group, 2014). The natural hydrograph of the river is dominated by a spring snowmelt peak. Strawberry Tunnel was completed in 1913 and delivers water from Strawberry Reservoir to the headwaters of Sixth Water Creek, (Figure 1a). Water delivery began in 1915 and continues to the present (Reclamation, 1916). Before 1997, all transbasin flows were delivered via Strawberry Tunnel and carried in the stream channel. Water was delivered from May through September, with the magnitude based on irrigation demands of downstream water users. The 1992 Central Utah Project Completion Act authorized construction of a series of pipelines and tunnels to carry the transbasin flows (U.S. Congress, 1992). The Diamond Fork Pipeline system includes a series of tunnels and pipelines that carry water past Sixth Water and Diamond Fork into Spanish Fork River. The first component, Syar Tunnel, was completed in 1996, moving the augmentation outlet 10 km downstream from Strawberry Tunnel and downstream of an active landslide that was thought to be a large source of fine-grained sediment (Figure 1b). The remainder of the pipeline became operational in 2004 and includes a second river outlet at Monks Hollow Outlet (Figure 1). Since 2004, imported flows entirely bypass Sixth Water and Diamond Fork, with the exception of mandated minimum flows.
Based on a 40-year flow record for Strawberry Tunnel in the mid-20th century (Table 1), daily mean irrigation releases exceeded 13.62 m3/s in 50% of years and exceeded 8.50 m3/s, on average, 35 days per year (Figure 3). These flows are exceptionally large for the small size of the Sixth Water drainage. A discharge of 13.62 m3/s exceeds the natural 2-year flood by a factor of 50 at the point of introduction and by a factor of 5 just upstream of the confluence of Sixth Water Creek and lower Diamond Fork River (natural peak flow based on United States Geological Survey (USGS) regional curves for peak flow, Kenney et al., 2008). A discharge of 8.50 m3/s exceeds the natural 2-year flood by a factor of 30 at the point of introduction and by a factor of 3 at the mouth of Sixth Water Creek.
| Gage ID | Name | Period of record |
|---|---|---|
| 09282000 | Strawberry Tunnel at West Portal | Oct 1922 to Sept 1925, Oct 1931 to Sept 1968 |
| 10149000 | Sixth Water Creek above Syar Tunnel | Oct 1998 to present |
| 10150000 | Diamond Fork near Thistle, Utah |
Mar 1909 to Apr 1911, Mar 1940 to Dec 1956 |
| 10149500 | Diamond Fork Below Red Hollow |
Dec 1953 to Jun 1969, Feb 1989 to Nov 2001 |
| 10149400 | Diamond Fork above Red Hollow | Oct 2001 to Present |
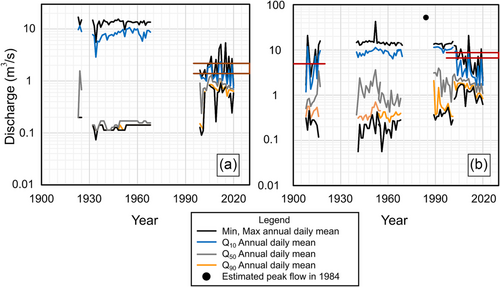
Based on a 43-year record in the mid to late 20th century, daily mean flows on lower Diamond Fork exceeded 14.16 m3/s in 50% of years and exceeded 9.91 m3/s, on average, 33 days per year (Figure 3). A discharge of 14.16 m3/s exceeds the natural 2-year flood by a factor of 3 at the confluence with Sixth Water Creek and by a factor of 2 at the outlet of Diamond Fork River, at its confluence with the Spanish Fork River. A discharge of 9.91 m3/s exceeds the natural 2-year flood by a factor of 2 downstream of the confluence of Sixth Water and Diamond Fork and by a factor of 1.4 at the outlet of the Diamond Fork watershed.
Large augmented flows were removed from most of Sixth Water in 1997 and from the entire drainage in 2004. Minimum instream flows were mandated by the authorizing legislation to support fish and wildlife resources (U.S. Congress, 1992). Sixth Water and Diamond Fork are home to brown trout (Salmo trutta) and native Bonneville cutthroat trout (Oncorhynchus clarkii Utah). Environmental flows were set based on habitat estimates conducted in the 1980s, when alternate designs for the Diamond Fork system were under consideration (U.S. Bureau of Reclamation, 1984, 1999; U.S. Bureau of Reclamation, 1990; Interagency Aquatic Biological Assessment Team, 1990).
Mandated flows are met by releasing specified amounts of water from Strawberry Tunnel, the Syar Tunnel Outlet, and the Monks Hollow Outlet (Figure 1). For Sixth Water Creek, the mandated minimum flow is 0.91 m3/s from May 1 to September 30 and 0.71 m3/s from October 1 to April 30. On Diamond Fork, minimum flow requirements are 2.27 m3/s from May 1 to September 30 and 1.70 m3/s from October 1 to April 30 (Figure 4). Comparing the 90% flow exceedance before and after 2004, the mandated minimum flows exceed the natural flow by a factor of 6 on Sixth Water and 7 on lower Diamond Fork (Figure 3). The magnitude of the augmented flows exceeds the natural 2-year flood in Process Domains 1 and 2.
There were several natural floods during the period of record that exceeded the augmented flows on the lower Diamond Fork. The largest flood in the past 120 years occurred in 1984. No stream gages were operating at the time, and the peak 1984 flow is estimated to be larger than 52 m3/s (R. Gecy, personal communication). The largest recorded flood occurred in 1952, with a peak of 46 m3/s. The next two largest floods were also ungaged and occurred in 1983 and 1975. The largest annual peak flow after the removal of augmented flows was 25 m3/s in 2011. Although some natural floods exceeded the magnitude of augmented flows on lower Diamond Fork, it is unlikely that any natural floods were larger than the augmented flows in Sixth Water Creek.
3 METHODS
We used multiple datasets to analyze geomorphic change of Sixth Water and Diamond Fork in response to long-term flow augmentation. These include historical aerial photographs, hillslope and valley bottom topography from airborne lidar (Jones, 2018), streambed elevation from field measurements at stream gauging stations, and field data including topographic cross sections, sediment transport measurements, bed grain size measurements, and hillslope grain size measurements.
3.1 Channel width
Channel width is highly responsive to changes in flow regime, and width can be measured from historical images; therefore, it is an important and robust tool for measuring geomorphic response to flow alteration. We mapped the active channel of Sixth Water and lower Diamond Fork at 1:1000 scale in ArcGIS from historical aerial imagery (Table 2). Most years had complete coverage of the study area, and we mapped the active channel from the Strawberry Tunnel Outlet to the intersection of Diamond Fork and Highway 6 when possible. All digitizing was performed by the same operator. We defined the active channel as the wetted channel plus the adjacent area where vegetation is unable to colonize because of fluvial scour or frequent inundation (Gendaszek et al., 2012; Lauer et al., 2017). We measured active channel width at 10-m intervals for each set of aerial imagery using the Planform Statistics Toolbox in ArcGIS (Lauer & Parker, 2008).
| Year | Source | Raster resolution | Color |
|---|---|---|---|
| 1939 | Soil Conservation Series | 1.13 m | B&W |
| 1953 | Army Map Series | 2 m | B&W |
| 1956 | USGS | 1 m | B&W |
| 1981 | USGS NHAP | 1.6 m | False color |
| 1982 | NHAP | 1.6 m | False color |
| 1983 | NHAP | 1.6 m | False color |
| 1993 | USGS DOQQ | 1 m | B&W |
| 1995 | Trihey and Associates Consulting | 1.7 m | Color |
| 1997 | DOQQ | 1 m | B&W |
| 2003 | USDA NAIP | 2 m | Color |
| 2004 | NAIP | 1 m | Color |
| 2006 | NAIP | 1 m | Color |
| 2009 | NAIP | 1 m | Color |
| 2011 | NAIP | 1 m | Color |
| 2014 | NAIP | 1 m | Color |
| 2016 | NAIP | 1 m | Color |
| 2018 | NAIP | 1 m | Color |
Error in channel width measurements can obscure real trends in width change if the magnitude of the error exceeds the magnitude of change. Therefore, it is important to characterize the magnitude of error. Error in width measurements results from digitization error and co-registration error. We measured the first by repeat digitization of channel margins (Donovan et al., 2019; Toone et al., 2014). We re-digitized select reaches that encompassed a variety of edge types—overhanging vegetation, areas covered by shadow, and clear banks. We calculated the standard deviation of channel width for each edge type in each year of imagery. We then assigned a single error metric to each process domain by calculating the percentage of each process domain covered by each edge type and calculated a weighted average of the standard deviation based on the proportion of each edge type. For most sets of images, the digitization error was less than the resolution of the images, so we assigned the resolution as the error metric (Supporting Information S1).
We calculated co-registration error by constructing a spatially variable error surface from a network of ground control points (Donovan et al., 2019; Lea & Legleiter, 2016). We used the 2016 imagery as our reference image and calculated the distance between ground control points for every historic image and the 2016 imagery. X error and Y error were calculated for every ground control point, and X and Y error surfaces were created for each year of imagery by natural neighbor interpolation. We extracted the value of X and Y errors at the left and right bank of the active channel polygon at 10-m intervals. We added the X and Y errors to the end-point coordinates, calculated the channel width from the shifted end points, and then subtracted the new width from the original measurement. This method calculates overestimation or underestimation of channel width because of differential georeferencing error. For example, if X and Y errors were equal on the left and right bank, the channel width measurement would not change despite any co-registration errors. We calculated the average co-registration error for each set of images by averaging the absolute value extracted at each 10-m interval. Total error was defined as the root sum of squares of the digitization and co-registration error measurements, and further detail is provided in the Supporting Information (S1).
We measured active channel width and drainage area for other regional streams to compare current-day hydraulic geometry relations for the Diamond Fork watershed and neighboring watersheds. We used the 2018 aerial imagery for this analysis, following the same methods for delineating the active channel and extracting width at 10-m intervals. We delineated channel margins for several kilometers for each stream and selected 70 m stream segments in areas with clear banks to minimize digitization error. Within each 70 m segment, we averaged channel width and calculated the drainage area at each location using USGS StreamStats (United States Geological Survey, 2016). Using the width and drainage area, we constructed one hydraulic geometry relation for Sixth Water and Diamond Fork, and another for other regional streams.
An increase in channel width from flow increase can be approximated using the hydraulic geometry relation between channel width and discharge, , where B is a channel width, a is a coefficient, and Q is a characteristic discharge (Ashmore & Church, 2001; Blench, 1969; Leopold & Maddock, 1953). Assigning a characteristic discharge and assuming that the coefficient a is constant, the ratio of new to old channel width is , where the subscript 1 denotes pre-augmentation and 2 denotes post-augmentation. This method has limits, such as the assumption of a constant coefficient a and the challenge of predicting width for shifts in channel form between single thread and braided. Despite these limitations, this approximation provides a useful framework in the Diamond Fork case, which is an opportunity to evaluate the limits of this approach for a very large flow augmentation of very long duration. Channel width before flow augmentation is unknown, and B1 is estimated for each process domain using the relation between channel width and drainage area for unaugmented regional streams described above. Pre-augmentation Q1 is estimated as the 2-year flood from USGS peak flow regional curves (Kenney et al., 2008). For Q2, we use the median annual peak augmentation release measured at the Strawberry Tunnel at West Portal gage (10.6 m3/s).
3.2 Sixth Water incision and sediment sources
In addition to adjusting their width, rivers often adjust their elevation through incision and aggradation in response to changes in flow regime. Measuring erosion and deposition of material is important to understand the overall sediment balance of a river. We documented the depth of incision on Sixth Water Creek from valley and tributary profiles and a relict stream-level rating flume constructed by the Bureau of Reclamation before opening Strawberry Tunnel (U.S. Bureau of Reclamation, 1916). We estimated the volume of incision in Sixth Water Valley by constructing a simulated pre-incision surface using a terrain interpolation technique and then subtracting the lidar elevations of the contemporary terrain. Incision depth was thus represented continuously along Sixth Water at a 1 m resolution and compared with field observations of estimated incision or features observable in the lidar dataset, such as the Bureau of Reclamation flume.
One approach for reconstructing pre-erosion topography is to use a 3-dimensional spatial interpolation algorithm across an eroded area. Spatial interpolation algorithms were originally designed for constructing gridded datasets from non-uniformly distributed point or line geometry data. However, these algorithms can also be used to reconstruct information over an area based on surrounding data. Bergonse and Reis (2015) assessed the performance of six common interpolation algorithms in quantifying gully and hillslope erosion. Their validation procedure identified the “Topo to Raster” Tool (implemented in ArcGIS) as the optimal spatial interpolation algorithm for constructing pre-erosion terrain in their study areas. We followed the interpolation and validation methods of Bergonse and Reis (2015), implementing the “Topo to Raster” Tool in ArcGIS 10.3 using contour lines created from the airborne lidar dataset (Figure 5). The primary difference in this study is that we interpolated the incised portion of a river bottom rather than hillslope gullies.
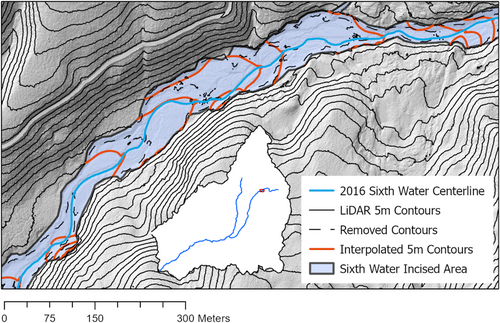
The greatest limitation of three-dimensional spatial interpolation is typically a lack of information, which creates unrealistic estimates of the interpolated value in certain areas. We reduced this source of error by using high-resolution topographic data for the contours surrounding the incised area, providing ample data for the interpolation algorithm. The other major sources of uncertainty from using terrain interpolation for our volume estimates come from measurement error in the lidar topography, delineation of the user-determined extent of the incised area, and the pre-incision morphology of Sixth Water that would exist under the natural flow regime. Below, we discuss how we addressed each of these sources of uncertainty, with the exception of the lidar dataset measurement error, which is assumed to be negligible compared to the uncertainty of the interpolated surface when differencing the two.
The extent of the incised area was delineated by hand using a combination of aerial imagery and lidar data to determine breaks in slope indicative of rapid incision. We used a variety of visible features—presence of bedrock, vegetation, alluvium, and eroded alluvial fan margins to constrain the delineation wherever possible. However, there were segments of Sixth Water that did not have characteristic marks of erosion where we had to carefully examine the lidar data and connect upstream and downstream features to ensure that a downslope gradient was maintained. This delineation was a crucial step in the interpolation because non-representative elevation data should be excluded from the incised area, otherwise erroneous incision depths are produced. To minimize error associated with the incised area boundary, the interpolation was done several times, checking the resulting incision depths along the margins to isolate anomalies. Where these occurred, the incised area boundary was redrawn and the interpolation run again, until no anomalies were noticeable during visible inspection. Once we had an acceptable incised area, contour lines within area were removed.
Using terrain interpolation in a fluvial valley setting does not account for the sediment that was already transported downstream by the natural flow regime. The algorithm can only use the terrain surrounding the incised area for interpolation but cannot account for fluvial erosion in the interpolated area. After the initial interpolation, we simulated the pre-incision morphology that would have occurred in the absence of augmented flows by using the topography of the neighboring upper Diamond Fork (above the confluence with Sixth Water). The two watersheds have similar drainage area and lithology, so upper Diamond Fork provides a good reference for Sixth Water in the absence of augmented flows. We repeated the same terrain interpolation method on upper Diamond Fork, except in this instance, the active channel area was used as the area to be interpolated. The average cross section of upper Diamond Fork was approximated with a logistic function, where channel depth is calculated as a function of distance from the channel centerline. We used the resulting function and the 2016 channel centerline of Sixth Water to superimpose a channel with the same average cross-sectional geometry as upper Diamond Fork onto the initial interpolated surface. This hypothetical channel provides an estimate of the volume of material that would have been exported under natural flow conditions.
After accounting for the pre-incision morphology of Sixth Water, the quantity of sediment eroded from the valley was calculated by differencing the 2017 lidar DEM from the simulated pre-incision surface. We quantified the error associated with the interpolation algorithm by applying the terrain interpolation method at random locations throughout the upper Diamond Fork and Sixth Water watersheds and comparing the reconstructed and existing topography, as described by Bergonse and Reis (2015). The grain size of the sediments transported during incision was estimated using field measurements of active hillslope sediment (Section 3.6). More detail on the interpolation method and how it was applied in this study are provided in the Supporting Information (S1).
Sediment derived from hillslopes can also represent a significant sediment source to a river, and changes in hillslope morphology through time can be used to assess whether a river is incising, stable, or aggradational. To estimate the change in hillslope-derived sediment through time, we measured the length of active hillslopes along Sixth Water in ArcMap for four sets of air photos—1956, 1981, 2006, and 2016. We defined active hillslopes as those in contact with the active channel with no visible vegetation growing at the toe of the slope. We validated the measurements from the 2016 air photos with field observations along the length of Sixth Water in October 2017. We identified active hillslopes in the field and compared with the length measured from air photos. To constrain uncertainty, we measured the length of hillslopes in the 2016 imagery that were identified in the field but not on the aerial photographs, because of shadows or image quality obscuring the slope toe. We calculated the relative uncertainty in the 2016 photos (i.e., length that would not have been identified without field reconnaissance ÷ total length of active slopes) and applied it to the total length measured in each year.
A large active landslide 2 km downstream from Strawberry Tunnel contributes sediment to Sixth Water (Figure 1b). We measured the offset of features in aerial photographs between 1993 and 2016 to estimate movement rates of the landslide over time. The position of approximately 100 trees that could be reliably identified was recorded for each set of imagery. We measured the offset of each tree in successive images and calculated uncertainty by extracting the co-registration error from the spatially variable error surfaces defined above. Aerial photographs prior to 1993 could not be rectified with high enough precision to estimate movement on the landslide.
3.3 Identification of alluvial deposits
Streambed elevation is an important metric to determine whether a river is incisional, stable, or aggradational. Historic measurements of streambed elevation are often spatially limited, but dated alluvial deposits can be used to determine past elevations of the streambed. Using the lidar-derived DEM and aerial imagery, we identified the location and elevation of alluvial deposits in both Sixth Water and lower Diamond Fork. We identified the year in which these deposits were last in the active channel and assigned that as the year of their formation for analysis. For example, a bar that was unvegetated in the 1939 photography and subsequently vegetated would be classified as a 1939 deposit. We assume that these deposits represent the elevation of the streambed when they were deposited and extract the elevation of the deposits above the modern channel using the 2017 DEM. This analysis does not account for subsequent erosion and deposition on these deposits.
3.4 Historical streambed elevation
Each field measurement of discharge at a USGS stream gage is accompanied by a gage height and cross-section measurement that includes wetted channel width, area, and velocity. These measurements can be used to reconstruct streambed elevations, following the methods of Jacobson (1995) and Smelser and Schmidt (1998). This a robust measure of streambed elevation, though it is spatially limited to areas where there are gage records. Mean streambed elevation is calculated from a USGS discharge measurement by subtracting the mean flow depth (flow area ÷ width) from the reported water surface elevation (gage datum + gage height). We applied the mean streambed elevation analysis to the Diamond Fork near Thistle and Diamond Fork below Red Hollow gages to analyze vertical adjustment of the river.
3.5 Topographic cross-section surveys
Repeat surveys of cross sections can be used to assess changing channel dimensions and channel shifting. Topographic cross sections at four monitoring sites were surveyed in 2005, 2006, and 2007 via total station (BioWest, 2009) and in 2017 by real-time kinematic GPS (Figure 1a). The cross sections were established on transects with permanent benchmarks in the form of survey markers and fence posts. The location of the wetted channel was noted in the field during each survey, discharge ranged from 0.91 to 1.27 m3/s for the Sixth Water site and 1.98 to 2.38 m3/s at the Diamond Fork sites (Supporting Information S1). We noted channel shifting if the wetted channel shifted between years and calculated area, width, and average depth for the wetted channel in each year. We also extracted the minimum bed elevation within the wetted channel to assess aggradation and incision.
3.6 Bed and sediment source grain size
To characterize the bed grain size across Sixth Water and Diamond Fork, we sampled surface bed material in the active channel at nine locations throughout Sixth Water and lower Diamond Fork in April, June, August, and October 2016 and 2017. Grain size was measured using pebble counts, with 100 grains collected along a reach 100 m in length at each sample site (Wolman, 1954). We compared these measurements to the grain size measured in sediment sources to constrain the amount of bed material delivered to the channel via incision of the Sixth Water valley. We also compared bed grain size to the grain size of sediment in transport to characterize the transport regime.
We measured the grain size of potential sediment sources on Sixth Water and lower Diamond Fork in October 2017. Potential sources were identified in the field as either tributaries or hillslopes in contact with the channel. We collected tributary samples from the bed of tributaries and hillslope samples no more than 1 m above the channel. To determine grain size, we divided samples in the field using a gravelometer for grains larger than 64 mm and sieves for material larger than 22, 8, and 2 mm. The fraction of each size class was weighed to generate a mass-based grain size distribution. Samples weighed at least 5 kg, and the largest grain rarely represented more than 5% of the sample.
3.7 Sediment transport measurements
We measured sediment entrainment and transport at eight locations along Sixth Water and Diamond Fork (Figure 1a). Sediment entrainment and transport measurements illustrate the caliber and volume of sediment that are moved at a variety of flows. Paired with the hydrograph, these measurements illustrate the overall level of bed mobility and therefore the capacity for geomorphic change. Grain entrainment was measured from the displacement of painted tracer clasts and clasts tagged with radio frequency identification (RFID) tags over a period of test releases at stepped discharges of 1.42 and 2.83 m3/s on Sixth Water and 2.83 and 4.25 m3/s on lower Diamond Fork. Painted grains and RFID-tagged clasts were placed on 2 September 2017 and re-surveyed on 11 and 23 September, following 5-day releases of the two step flows (Figure 6). We surveyed the initial location of RFID-tagged clasts using RTK-GPS and placed painted grains in rows. After each high flow step, we re-located RFID-tagged clasts with a handheld wand, surveyed their location with GPS, and calculated their transport distance in GIS. We noted if painted clasts had been displaced and measured their transport distance with a measuring tape in the field.
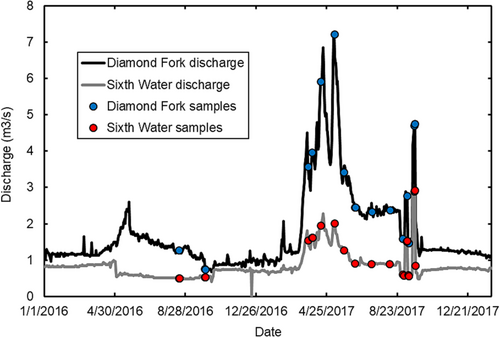
We measured sediment transport over a variety of discharges in 2016 and 2017 using the equal-width increment method (Edwards & Glysson, 1999). Bedload was measured via netframe samplers (Bunte et al., 2007) for low flows during September 2016 and 2017, and using a handheld Elwha sampler on all dates. Bedload samples were weighed and sieved in the lab to calculate the grain size distribution of sediment in transport. We compared this size distribution with the bed grain size to assess the transport regime.
4 RESULTS
4.1 Channel width
4.1.1 Sixth Water and Diamond Fork
The earliest aerial photos available throughout the Sixth Water watershed are in 1956, which capture the channel condition after 41 years of augmented flows. The two most confined process domains, the uppermost and lowermost, have the narrowest channel width and show the least change over time. The maximum width in Process Domain 1, 30 m, was recorded in 1956 (Figure 7). The river remained wide in the 1981 images, as high flows continued. Much of the reach is confined by bedrock, but in areas of local unconfinement, the channel was able to widen to the full valley extent. High flows were removed from this section in 1997, and the channel was significantly narrower in the 1997 aerial imagery.
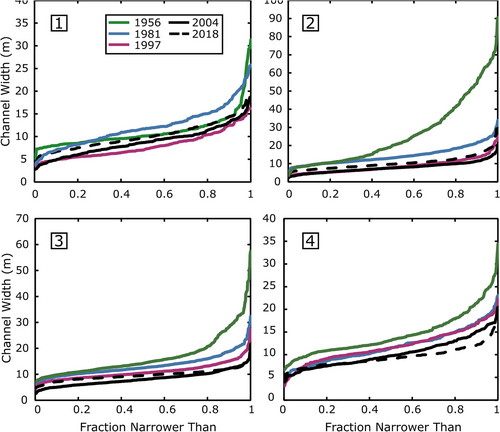
Process Domain 4 had a similar trend in channel width, widest in the earliest set of photographs, with subsequent narrowing. By 1981, the channel had narrowed, though the magnitude of narrowing is similar to the error magnitude. Channel width remained consistent between 1981 and 1997, as high flows continued. Narrowing occurred after high flows were removed with the completion of the Diamond Fork Pipeline in 2004, and channel width was largely static between 2004 and 2018.
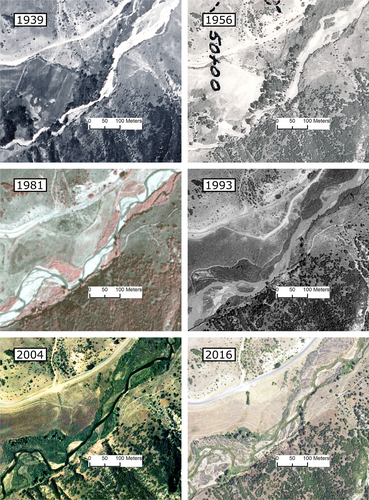
In the least confined reach, Process Domain 2, active braid plains with bare bars developed across the full valley bottom. Channel width was a maximum in 1956 with some sections of the channel over 70 m wide. By the 1981 air photos, vegetation had become established on the braidplain, suggesting that most of the augmented flow was now carried in an incised main channel (Figure 8). The channel narrowed further by 1997, despite persistent high flows until that year. Channel width has remained consistent within the margin of error since 2004.
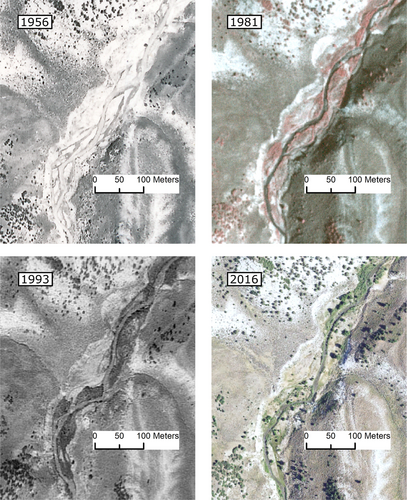
The partially confined Process Domain 3 had a similar trend in width. In the 1956 air photos, the channel had expanded to fill the valley bottom in locally unconfined areas. By the 1981 air photos, the widest areas had reduced to a single thread and the overall width was narrower, though much of the change was within the margin of error. High flows remained in this section until 2004, but the channel was narrower in 1997. After the removal of high flows in 2004, the channel was significantly narrower, and has maintained a similar width since 2004.
The upper two Diamond Fork process domains are partially confined by bedrock, Holocene terraces, and infrastructure that influence channel width. Some channel widening occurred between 1939 and 1953 in Process Domain 5, likely driven by temporary storage of sediment supplied from Sixth Water (Figure 9). The 1939 channel included some locations with a braid plain, indicating a large sediment load (Figure 10). The flood of 1952 deposited bars in some areas, while also appearing to cut a channel through existing braid plains. By the 1981 air photos, deposits at the valley margin were vegetated and the active channel had narrowed. Process Domain 5 was slightly wider in the 1983 air photos because of high flows and remained at a similar width until 1997. Flows were reduced in 2004, leading the channel to narrow again. The channel was slightly wider in the 2018 air photos, but the 2004 and 2018 widths are within the margin of error.
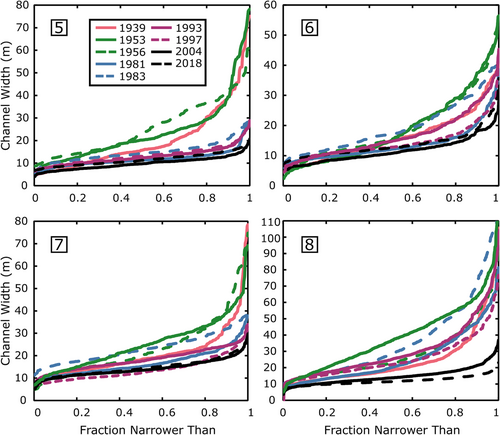
Process Domain 6 was less responsive to the flood of 1952, with only the widest channel areas changing significantly between the 1939 and 1953 imagery. The channel narrowed between 1956 and 1981 as bars were vegetated. The 1983 imagery included some wide and braided locations, and the channel was significantly wider overall. After the floods of the 1980s, the channel narrowed as vegetation established on the flood deposits (Figure 9). Measured width increased slightly between 2004 and 2018, but within the margin of error.
Process Domain 7 shows slightly greater width variability than upstream (Figure 9). Channel width expanded from 1939 to 1953 as the flood of 1952 stripped vegetation from within and near the channel margins and mobilized sediment across much of the valley bottom. At the same time, a number of braid plains visible in 1939 established a single dominant channel in the air photos from the 1950s. The channel narrowed by 1981, as 1952 flood deposits were vegetated in subsequent years. High flows in 1983 widened the channel, which narrowed over the subsequent 10 years. Although high flows were not removed from this section until 2004, channel width has been consistent since 1997.
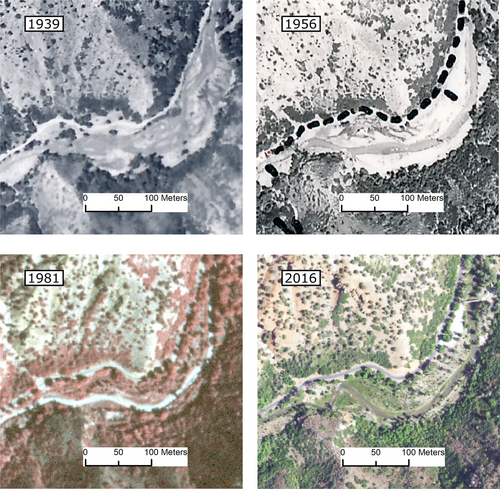
Process Domain 8 is the least confined section and was the most responsive to flow variations. In the lower 3 km of Diamond Fork, multiple meander bends were cut off by the 1952 flood, shortening the channel in that reach by 20%. Lateral erosion of the valley walls occurred in some places, leading to large amounts of widening, and three channel avulsions occurred. The channel narrowed significantly by 1956, as deposits at the channel margin were vegetated, though many active gravel bars were present (Figure 11). Channel width was similar in 1956 and 1981, but high flows in 1983 widened the channel again. By 1997, vegetation encroached on the margins of the previously widened active channel and by 2004, nearly all the multi-threaded reaches had become single-threaded. Since 2004, the channel has continued to narrow, though changes are similar to the magnitude of uncertainty. Flood deposits from 2006 to 2011 temporarily widened the channel before being subsequently vegetated and returning the channel to similar dimensions.
The hydraulic geometry analysis reveals contrasts between process domains, driven by relative flow increase and confinement. The magnitude of Q2/Q1 varies from 98 times at the point of introduction to 2.2 times at the mouth of Diamond Fork. Figure 12 shows the median, 10th percentile, and 90th percentile channel widths for each process domain, and values of B1 and B2 corresponding to the natural 2-year flood and median annual peak flow release, respectively.
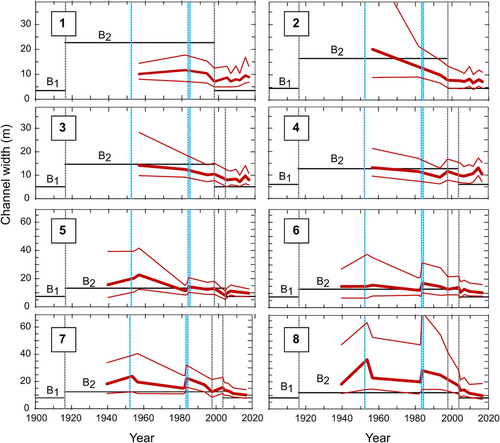
The extreme flow alteration of Sixth Water challenges the assumptions of the hydraulic geometry approach. A switch of channel pattern from single thread to braided was observed in some locations, and it may be unlikely that the coefficient a would remain constant, particularly in the upstream sections, where the increase in discharge is 98 times. The median channel width of Process Domains 2–4 was close to the hydraulic geometry estimate in 1956, but width decreased to well below the estimated B2 in subsequent years (Figure 12). When diversion flows were removed in 1997 (2004 for Process Domain 4), little subsequent narrowing occurred, and channel width remains elevated above that predicted by the natural 2-year flood.
The hydraulic geometry approximation better fits channel width trends on lower Diamond Fork, though the process domains had different width responses. In Process Domain 5, channel width approached the hydraulic geometry estimate in 1981 as previously braided sections became single threaded. Process Domain 6, which is more confined, had width close to the hydraulic geometry estimate throughout the period of record. In the lower process domains (Figure 12), channel width was larger than the hydraulic geometry estimate throughout the period of high flows, though width decreased after the 1983 flood. In the post-2004 period, channel width remains elevated above that predicted by the natural 2-year flood.
4.1.2 Regional channel width
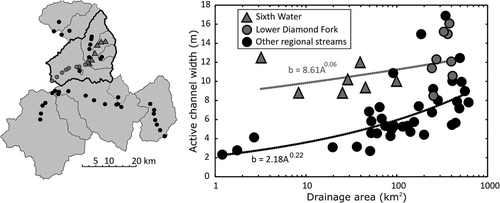
Channel width for Sixth Water and Diamond Fork in 2018 was consistently larger than for nearby channels with similar drainage area (Figure 13). The difference is particularly striking for Sixth Water, represented by points with drainage area less than 100 km2. Channel width on Sixth Water was persistently 8–12 m and did not scale with drainage area. In contrast, channel width for streams with unaugmented flows was less than half that of Sixth Water and showed a stronger scaling relationship with drainage area. The lower Diamond Fork was also generally wider than other regional rivers with similar drainage area and had weaker scaling with drainage area, though there were some regional rivers with similar channel width.
4.2 Incision of Sixth Water Creek
There are few places to directly measure incision because of the unknown elevation of the channel prior to 1915. One precise measure comes from the rating flume constructed by the U.S. Bureau of Reclamation to measure flows in the 1910s (U.S. Bureau of Reclamation, 1916). The flume is located 2 km downstream from Strawberry Tunnel and was 6 m above the active channel in 2017 (Figure 14). The interpolated pre-incision topography resulted in localized measures of incision greater than 10 m at the upstream-most extent and suggests that the entirety of Sixth Water incised. The average incision depth decreases downstream, from 3.73 m in Process Domain 1 to 1.79 m in Process Domain 4 (Table 3).
| Process domain | Volume evacuated (m3) | Mean incision depth (m) | Percent in source8–22.6 mm | Percent in source > 22.6 mm |
|---|---|---|---|---|
| 1 | 255 758 | 3.73 | 4.6 | 1.1 |
| 2 | 1 049 599 | 3.12 | 8.8 | 8.9 |
| 3 | 612 416 | 2.7 | 13.0 | 13.8 |
| 4 | 116 382 | 1.79 | 13.0 | 13.8 |
| Total | 2 034 155 | 2.92 | 10.5 | 10.5 |
4.2.1 Magnitude of sediment excavated from Sixth Water
Subtracting the interpolated pre-incision surface from the 2017 lidar provides an estimate of 2 million ± 300 000 m3 of erosion throughout the Sixth Water Valley. Based on measurements of the grain size of sediment sources, approximately 400 000 m3 of sediment coarser than 8 mm was removed from the Sixth Water Valley by 2017 (Table 3). Measured bed grain size was rarely finer than 8 mm, so this volume represents bed material sediment that was contributed to the channel.
4.2.2 Timing of hillslope erosion in Sixth Water
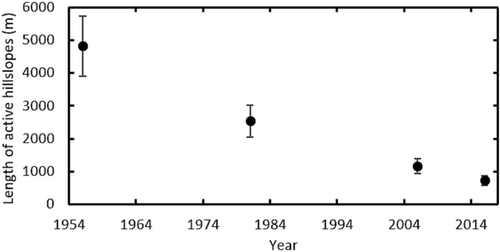
Channel incision on Sixth Water steepened adjacent hillslopes, which should increase lateral supply of sediment to the river. For available aerial imagery, the extent of unvegetated toe-slopes along Sixth Water was at a maximum in 1956 and consistently decreased over time to the last photo measured in 2016 (Figure 15). This suggests that the amount of sediment supplied to the channel from hillslopes decreased over time.
The large landslide at the upstream end of Sixth Water was a sediment source throughout the period of record, including after flow augmentation. The landslide was very active during the period of augmented flow, with toe scarps on river left and river right. Currently, there is only one section of the landslide that is actively deforming, again suggesting a decrease in hillslope sediment supplied to the channel. Active portions of the landslide currently move at an average rate of 0.4 m/year based on measurements of tree movement from aerial photography. The landslide delivers predominantly fine-grained material to the channel because it is formed in mudstone and shale. Little fine-grain sediment is stored within the Sixth Water/Diamond Fork system, so landslide-derived sediment likely had a smaller impact on downstream geomorphology than other hillslope sources.
4.3 Alluvial deposits
On Sixth Water, alluvial deposits are concentrated in the partially confined process domains. Many of the bars that were unvegetated in photos from the 1950s are now partially vegetated with an elevation averaging 2 m above the active channel. Bars that were active in the 1980s are an average of 1.25 m above the current channel. These deposits are predominantly gravel and cobble, with little fine sediment, and line both sides of the channel for much of Process Domain 2 (Figure 8). The elevation of the surfaces and the caliber of material in these deposits indicate that the sediment is neither accessed nor moved in the current flow regime, so they act as confining features along a substantial length of the channel boundary. Very few alluvial deposits are found in the confined sections, where there is little space between the active channel and the valley walls.
Alluvial deposits on the Lower Diamond Fork reveal complex patterns of deposition, channel shifting, and incision. Several features present in the 1939 channel are preserved, primarily from meander cutoffs. These deposits have a mean elevation of 1.15 m above the modern channel but range from 0 to 3 m. Most preserved deposits present in the 1956 imagery were large bars exposed at the channel margin. The 1956 deposits are at a similar relative elevation above the modern channel, at an average of 1.37 m, again ranging from 0 to 3 m. Deposits from the 1980s are at elevations closer to that of the modern channel, with a mean of 0.5 m above the channel, as are deposits formed in the 1990s and 2000s.
4.4 Streambed elevation
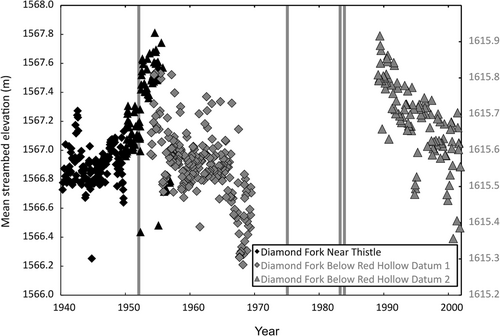
The mean streambed elevation at USGS stream gages reveals that the bed aggraded in response to flood events and degraded in subsequent years. At the Diamond Fork near Thistle gage, aggradation occurred prior to the flood of 1952, with an increase of about 20 cm between 1945 and 1952 and a 30 cm increase following the flood (Figure 16). The Diamond Fork above Red Hollow gage was installed 6 km upstream shortly thereafter and shows a degradational trend of 15 cm in the years following the 1952 flood. No gages were operating from 1969 to 1988, so there is no streambed elevation data from the flood of 1984. The Diamond Fork below Red Hollow gage was reestablished in 1988, and bed elevation decreased 20 cm between 1988 and 2001, when the gage went offline again.
4.5 Topographic cross sections
Measurements of wetted channel width, depth, and minimum bed elevation from cross sections in Process Domain 2 on Sixth Water show very little change in width, depth, or bed elevation from initial surveys in 2005 to those in 2017. The survey-to-survey changes are illustrated in Figure 17 and are clustered around zero change in wetted width and elevation. The survey-to-survey change in wetted width could be related to inconsistency in defining the wetted edge of the channel or changes in riparian vegetation. The lack of cross-sectional change is consistent with the lack of channel width change documented in aerial photographs during this period.
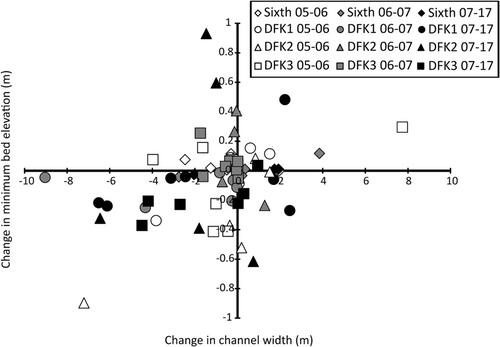
Measurements from topographic cross sections on lower Diamond Fork show a progressive reduction in width because augmented flows were eliminated in 2004. The majority of cross sections surveyed on lower Diamond Fork narrowed and incised between 2005 and 2017 (Figure 17). Channel shifting was also common, with the wetted channel in 80% of cross-sections shifting more than 5 m between 2005 and 2017 (Supporting Information S1). The magnitude of change between subsequent surveys depended on the magnitude of the intervening flows. 2006 was a relatively large flood year, and large changes in cross-sections were measured between 2005 and 2006. Less change occurred between 2006 and 2007, as the peak flow of 2007 was relatively small. Between 2007 and 2017, the majority of cross sections experienced narrowing and some bed degradation. The few cross sections that experienced an increase in minimum bed elevation were either located just downstream of a channel constriction or experienced the deposition of a bar as the channel shifted.
4.6 Bed and hillslope grain size
Bed sediment samples show progressively finer grain size from upstream to downstream. At the upstream-most sample site on Sixth Water, the D50 is 90 mm, whereas the lowermost site on Sixth Water has a D50 of 32 mm. Bed grain size on Sixth Water was relatively insensitive to high flows during the sampling period, except at the lowermost site, where deposition of fine gravel and sand occurred after the spring runoff of 2017, causing the bed to fine (Supporting Information S1). On lower Diamond Fork, grain size decreases from D50 of 45 mm at the uppermost sample site to 22.6 mm at the lowermost site. All sites on lower Diamond Fork showed some temporary fining following spring floods and a flash flood in July 2017.
Thirty-five potential sediment sources were sampled for grain size analysis on Sixth Water (Supporting Information S1). All hillslope samples on Sixth Water were finer grained than the bed material of the channel. The median bed grain size at all Sixth Water sample sites was 32 mm or greater, whereas all hillslope samples had a median grain size less than 32 mm. Tributary samples also contained finer sediment than the bed material of Sixth Water. The D50 for most samples is 4–8 mm, and the D84 is 22.6–32 mm (Supporting Information S1).
4.7 Sediment transport measurements
Sediment transport and bed mobility measurements on Sixth Water showed negligible rates of transport and entrainment in the current flow regime. At the downstream-most sample site, we measured transport at flows up to 3.11 m3/s, equivalent to a flood with a 3-year recurrence interval. In 14 measurements at the downstream-most sample site, only five contained grains larger than 32 mm (the bed D50). In each case, we collected only a single grain of this size. At the upstream-most transport site, D50 is 90 mm, and no grains larger than 8 mm were ever collected in transport measurements. Tracer experiments had similar results, with minimal motion of grains larger than 45 mm at any sample site on Sixth Water (Supporting Information S1).
At three Lower Diamond Fork sample sites, flows close to the 2-year recurrence interval flood produced transport rates of 250 kg/h (Supporting Information S1). The transport was composed of the finer bed material fractions, with very few grains coarser than the bed D50 in transport. At the upstream-most site, the bed D50 is 45 mm, and only two of 16 samples contained grains coarser than 32 mm. At the downstream-most site, the bed D50 is 22.6 mm, and only three of 15 samples contained any grains coarser than this size. Entrainment results were similar, with fewer than half of the D50 grains mobile at the 2-year magnitude flood. Around 36% of RFID tracers coarser than D50 moved after stepped flows of 2.83 and 5.10 m3/s, with transport distances from 1 to 90 m and a median transport distance (among grains that moved) of 19 m.
5 DISCUSSION
5.1 Channel response to high flow
The Diamond Fork watershed represents one of the largest magnitude flow augmentations in the geomorphic literature and provides an opportunity to evaluate existing notions about channel response and the efficacy of hydraulic geometry under extreme circumstances. Our results agree with previous studies of flow augmentation, confirming that degree of confinement, confining material, and magnitude of alteration are key controls on channel response (Abbott, 1976; Bradley & Smith, 1984; Church, 1995; Hillman et al., 2016; Kellerhals et al., 1979). We expand this body of literature by detailing geomorphic response over a long time period, by explicitly evaluating the influence of along-stream change in flow magnitude and by considering along-stream sediment dynamics caused by the flow alteration.
Augmented flows on Sixth Water were much larger and more persistent than natural floods and produced widespread incision and widening, but channel response to the sediment deficit varied with channel setting. Confined, steep reaches have limited capacity for lateral adjustment, so incision was the primary mode of adjustment. We document at least 6 m of incision in the headwaters where the magnitude of flow augmentation relative to natural flows was the greatest and the shale and mudstone bedrock is erosionally weak. This echoes the findings of Kellerhals et al. (1979), who found that augmentation in steep bedrock rivers caused “rapid and complete removal of overburden and erosion of soft bedrock.” There is evidence of incision throughout Sixth Water, and we estimate an average of nearly 3 m of incision for the entirety of the Sixth Water valley (Table 3).
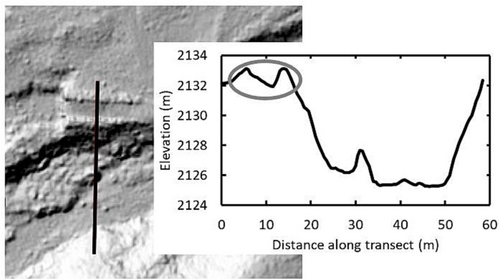
In partially confined reaches with lower slope, the response was more complex, as the channel was able to both incise and widen by cutting into adjacent valley fill. A broad braided channel is observed in the 1956 aerial images of the partially confined sections (Figure 8). Though the magnitude of flow alteration at Sixth Water was greater than previous studies, several studies from Colorado found that low slope, lower confinement reaches experienced greater width change than confined sections, in line with our findings (Abbott, 1976; Dominick & O'Neill, 1998; Dust & Wohl, 2012). Although an active braid channel is often associated with a surplus of sediment supply over transport capacity, there is good evidence that the channel had incised by several meters by this time. The observation of incision in a wide, active braided channel may be attributed to the abnormally large river discharge and the need to transport a large upstream sediment supply (Erwin et al., 2011; Leonard et al., 2017; Major et al., 2019).
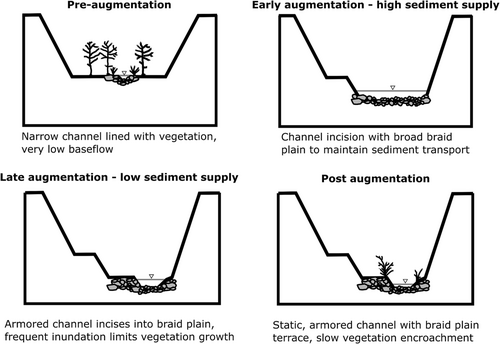
Valley incision and hillslope erosion decreased over the decades of the project, changing the character of the river. Decreased incision and hillslope erosion is evident from channel stabilization by vegetation and the decrease in active hillslope length over the last 40 years of the augmentation period (Figure 15). With decreasing sediment supply, the persistent diversion flows cut a single channel into the braid plain (Figure 18). As the channel incised, overbank flows were no longer able to move sediment on the former braid plain, whereas development of an armored boulder bed limited the extent of incision, causing the channel to stabilize and allowing vegetation to establish. These changes led the channel to narrow below the width that would be predicted from hydraulic geometry (Figure 14). Wohl and Dust (2012) similarly found that downstream hydraulic geometry relations no longer held after flow augmentation in headwater streams in Colorado.
Partially confined sections of lower Diamond Fork share some similarities with Sixth Water, but there are several key differences as well: the magnitude of augmentation flows relative to natural floods was smaller, the valley slope is substantially lower, and there was initially a large upstream sediment supply from the incision of Sixth Water. The lower slope and lower magnitude of relative flow augmentation resulted in a reduced transport capacity relative to Sixth Water. Although evidence from the first decades of the flow augmentation is limited, alluvial deposits in the uppermost process domain on Lower Diamond Fork suggest that the river aggraded in the decades immediately following the introduction of transbasin flows.
We estimate that 400 000 m3 of sediment coarser than 8 mm was delivered from Sixth Water to lower Diamond Fork over the life of the augmented flows. To compare that volume to potential aggradation, if all of that sediments were delivered and deposited during the first 25 years of the project, the mean depth of deposition over the 382 000 m2 of active channel area in 1939 would be roughly 1 m. It is highly unlikely that 100% of the eroded sediment was retained, but if half the evacuated sediment were retained, the channel would aggrade by 0.5 m. The Diamond Fork near Thistle gage, located in Process Domain 6, showed a 0.4 m increase in bed elevation between 1945 and 1952.
Despite the large sediment supply, the hydraulic geometry prediction holds reasonably well for the median channel width in Process Domains 5 and 6. Although some sections become braided, particularly in Process Domain 5, much of the river retained a single thread during the period of flow augmentation. And when braiding did develop, such as during the 1952 and 1984 floods, the river was not able to maintain that channel width, which led to subsequent narrowing closer to the hydraulic geometry prediction. The ability of floods to temporarily overwiden a channel has been noted elsewhere, with the speed of recovery from flooding dependent on sediment supply, transport capacity, and vegetation growth (Renshaw et al., 2019; Schumm & Lichty, 1963; Wolman & Gerson, 1978).
The unconfined, lower slope process domains of lower Diamond Fork experienced the most change as a result of flow augmentation. Much of the channel remained single threaded in 1939, but some areas were multi-threaded. The flood of 1952 eliminated most of that original channel form, producing lateral erosion and broad braid plains, along with several avulsions and bend cutoffs. This flood significantly widened the channel and altered the character of the river, as seen for large augmentations in Canada (Kellerhals et al., 1979). By 1981, the river had narrowed considerably and was approaching the width predicted by hydraulic geometry, but the floods of the mid-1980s re-widened the channel. Further narrowing occurred after the 1984 flood, as the river again approached the hydraulic geometry-predicted width before the change of flow regime in 2004. Despite decades of augmentation, width on the lower Diamond Fork trended toward good stuff.
5.2 Channel response to reduced flow
The removal of large flows from Sixth Water and Diamond Fork distinguish this study from previous studies of flow augmentation and provide an opportunity to evaluate the legacy of high flows and the influence of elevated baseflows. For Sixth Water, the large magnitude, months-long duration, and decades-long persistence of augmented flows created morphologic changes that are not reversible under the natural flow regime. Kellerhals et al. (1979) may be the only paper to report on change as extreme as Sixth Water, but the long-term implications and recovery potential of those rivers were not discussed.
In confined sections of Sixth Water, meters of incision into valley fill and bedrock created deep, narrow valleys that have minimal space for sediment storage and limited ability for morphologic adjustment. Much of the bed material is cobble and boulder that is not mobile under the current flow regime. The post-augmentation channel is much smaller, often separated from hillslopes, and the supply of bed material is low. Partially confined sections are characterized by a coarsened channel incised into the former valley-spanning braid plain (Figure 18). Natural floods are not large enough to access the braid plain in most locations and are unable to move the coarse, armored material in the channel. Sediment transport measurements and bed mobility experiments show negligible entrainment and transport of grains in the coarse half of the bed material size distribution, even at 2–10 year recurrence interval floods, and minimal change in cross-section geometry was observed between 2007 and 2017.
In the post-augmentation flow regime on lower Diamond Fork, natural floods produce modest rates of grain entrainment and sediment transport, providing some means for channel adjustment. Tracer experiments using RFID-tagged gravels indicate conditions of partial mobility (Wilcock & McArdell, 1993, 1997) for coarse bed material during flows with a 2- to 5-year recurrence interval. Transport at these flows is sufficient to create small gravel bars and promote some channel migration, as seen in aerial photographs and cross-section measurements. Despite many decades of flow augmentation, the channel remains capable of geomorphic adjustment.
The abundance and elevation of alluvial deposits exert an important control on the present geomorphic function of lower Diamond Fork. Process Domains 5 and 6 have experienced relatively limited change since the 1990s because alluvial deposits are coarse, high in elevation, and are rarely, if ever, accessed in natural floods. Sediment transported in these sections is finer than the bed material and there has been minimal deposition and channel shifting since the reduction of augmented flows. In contrast, the former braid plains in unconfined sections are at a lower elevation relative to the modern-day channel and are more frequently accessed by flood flows. Deposition at the margin of these surfaces occurred during recent floods, causing local channel shifting and promoting the growth of new vegetation (Figure 11). The post-2004 lower Diamond Fork illustrates the importance of place-specific history and on fluvial function (Fryirs & Brierley, 2016; Masteller et al., 2019; Phillips, 2017; Phillips et al., 2022).
Throughout the Sixth Water/Diamond Fork drainage, the modern channel is significantly wider than nearby streams at the same drainage area (Figure 13). The legacy of the large augmentation likely contributes to this trend, but the influence of elevated baseflows may also support the wider channel. Sixth Water is mandated to carry at least 0.91 m3/s from May 1 to September 30 and 0.71 m3/s from October 1 to April 30; these flows exceed the natural baseflow by 7–9 times and exceed the natural 2-year flood for channel segments with drainage area less than 25 km2. On lower Diamond Fork, the mandated flows are 2.27 m3/s in summer and 1.70 m3/s in winter. These flows are 5–8 times larger than natural baseflow. In the field, we observed that the mandated baseflows generally cover the entire channel bottom for most of the year, which may prevent vegetation from establishing within the channel.
Previous studies have noted the potential for baseflows to maintain channel width via interactions with vegetation. Sankey et al. (2015) found that heightened baseflows increased vegetation growth along the Colorado River in Grand Canyon, but that areas inundated during 10% of days had suppressed vegetation establishment. Similarly, ecogeomorphic model results suggest that increased base flows decrease the areal coverage of vegetation at the Yampa and Green River, Colorado (Diehl et al., 2020). Lenhart et al. (2013) observed that elevated May–July baseflow on the Minnesota River played a role in reducing vegetative cover of bars and lower banks, which enhanced river widening over 70 years. Yegua Creek, Texas, maintained its channel width 35 years after the closure of the Sommerville Dam. The dam operations decreased flood flows and increased baseflows. This led to bed aggradation and increased vegetation growth on the river banks. The vegetation increased channel stability but was unable to establish in the active channel because of persistent inundation (Chin et al., 2002; Jennings, 1999). Though they did not have a mechanistic explanation, Bradley and Smith (1984) found that channel width increased with a 3 times increase in mean annual flow despite consistent high flows. Coupled with these studies, our observations suggest that elevated baseflows commonly associated with flow regulation deserve further study for their role in determining the extent of possible narrowing.
6 CONCLUSION
Exceptionally large transbasin flows transformed Sixth Water Creek and the Diamond Fork River over the course of 87 years, beginning in 1916 and ending in 2004 when a series of tunnels and pipelines were built to carry irrigation water. Transbasin flows occurred through a 5-month irrigation season, and for 1 month of the year, flows were 30 times the natural 2-year flood at the point of introduction and 40% greater than the natural 2-year flood at the mouth of the Diamond Fork watershed. This extreme flow alteration produced widespread geomorphic change that was controlled by valley confinement and position in the watershed, which determined the magnitude of augmented flow relative to natural floods and the sediment supply. And beginning in 2004, a new flow regime was introduced with reduced high flows and elevated low flows that may help to maintain an overwidened channel.
Our results are relevant for regulated rivers under conditions of both increasing and decreasing discharge. For flow increases, the relative magnitude of alteration, the degree of confinement, and the sediment supply are primary controls, in line with previous studies of flow augmentation (Abbott, 1976; Church, 1995; Dominick & O'Neill, 1998; Kellerhals et al., 1979; Wohl & Dust, 2012). Alteration for Sixth Water was so large that the river incised until mobile sediment was exhausted and the channel had very little capacity for morphologic adjustment and no longer conformed to the predictions of hydraulic geometry. For lower Diamond Fork, natural floods were larger than the augmentation flows, so the channel remained active throughout the period of augmentation. Under these conditions, confinement influenced the capacity for change, with the most change recorded in the least confined areas.
For the case of flow decrease, the initial state is an important determinant of channel function. For Sixth Water, the channel is so altered that there is very little sediment transport or morphologic change. Lower Diamond Fork has more geomorphic change because natural floods are still capable of transporting sediment. But legacy alluvial deposits limit the potential for geomorphic change. Finally, we contribute to a growing body of literature about the influence of baseflows on channel width, as we illustrate that Sixth Water and Diamond Fork remain wider than regional streams despite a restoration of the natural flood regime. Elevated baseflows cover the channel bottom throughout the summer growing season and may prevent vegetation establishment, thereby prohibiting the channel from narrowing further. A similar scenario may be present in other regulated rivers with elevated baseflows, warranting further investigation.
ACKNOWLEDGMENTS
The authors thank the Central Utah Water Conservancy District for managing flow releases for the duration of the field study, including flow targeted flow releases for sediment transport and larval drift experiments. We are grateful for direction and assistance from the Utah Reclamation Mitigation and Conservation Commission and logistical support from the U.S. Forest Service Spanish Fork Ranger District. We are also grateful for field support from numerous faculty, graduate students, technicians, and undergraduates.
CONFLICT OF INTEREST STATEMENT
The authors declare no conflict of interest.
FUNDING INFORMATION
This work was funded by Agreement No. 16FCUT-2,120—Comprehensive Study and Recommendations for Instream Flow Requirements on Sixth Water Creek and Diamond Fork River—between the Utah Reclamation Mitigation and Conservation Commission and Utah State University.
Open Research
DATA AVAILABILITY STATEMENT
The data that support this study are available via a HydroShare resource: https://doi.org/10.4211/hs.f3a2cbfaa5694dadab26ea3e42a21a2f.


