The interplay of bedrock fractures and glacial erosion in defining the present-day land surface topography in mesoscopically isotropic crystalline rocks
Abstract
This paper addresses the effect of fractures within crystalline bedrock on glacial erosion processes in fast flowing hard bed glacier environments. In particular, we examine (i) whether the fracture type is critical for the capability of a glacier to erode the bedrock through quarrying/plucking processes and (ii) whether we can recognize specific fracture-controlled erosion signatures from bedrock surface morphologies. We conducted an investigation within the northern part of the Åland Islands, southern Finland, where the ice-flow direction (N–S) has remained constant through Late Pleistocene glaciations and where the bedrock is characterized by a lack of any mesoscopic anisotropies (such as foliation) and hence provides an optimal target to recognize the relationships between fractures and erosional morphologies. We characterized the fracture systems within the bedrock using both UAV-acquired orthophotographs and standard field approaches and extrapolated the results to larger scales using LiDAR-based digital elevation models. Our findings indicate that individual joints or shear fractures are associated with the development of minor vertical breaks along the bedrock surface. However, they do not provide sufficient mechanical weakness zones in the bedrock to allow effective glacial quarrying, even though their lengths can be relatively large (>50 m). By contrast, the linkage of several parallel shear fractures or the presence of larger faults with gouge-bearing cores and well-developed damage zones leads to localized disintegration of the rock material and the subsequent development of distinct topographic depressions along the bedrock surface. Consequently, the results allow predictions to be made about the bedrock features underlying the observed topographic signatures along the bedrock surface. Applied to the area of this investigation, abrasion associated with N–S-directed glacial flows is responsible for the N–S-oriented elongate but smooth fjord-like megagrooves, whereas the more abrupt topographic breaks were generated by quarrying controlled by sub-vertical, E–W-trending zones of localized brittle deformation.
1 INTRODUCTION
Glacial erosion has had a major impact on the present-day landscapes in areas affected by repeated glaciations during the Quaternary period (~2.6 Ma), particularly in areas formerly covered by major continental ice sheets, such as the Antarctic (Thomson et al., 2013), Greenland (Lane et al., 2015), North American (Sugden, 1978) and Eurasian (Patton et al., 2016) ice sheets. The bedrock within areas of areal scouring displays irregular rock surfaces resulting from the processes of glacial erosion, including the mechanisms of abrasion, quarrying and glacial ripping (Glasser et al., 2020; Glasser & Bennett, 2004; Hall et al., 2020; Iverson, 1991; Krabbendam et al., 2022). Glacial abrasion refers to wearing of the bedrock surface caused by the rock fragments at the glacier base and may involve scoring and polishing, associated with larger (>1 cm) and finer fragment sizes, respectively. Quarrying (or plucking) refers to the expansion of fractures within the bedrock due to glacial stresses and the subsequent removal of >1 cm rock fragments. Similarly to quarrying, glacial ripping uses the bedrock fractures but removes a multitude of fragments in the same event. The capacity and style of glacial erosion are largely linked to the character and dynamics of the ice sheet, such as ice thickness (Anderson, 2014), ice-flow velocity (Herman et al., 2015; Yanites & Ehlers, 2016), the temperature and hydrogeology at the base of the ice (Clarke, 2005; Lai & Anders, 2021; Neal Iverson, 2012; Sugden, 1974) and glacier bed morphology (e.g., Sugden, 1978). However, a growing body of evidence indicates that the properties of the bedrock underlying the glaciers also substantially affect the erosion processes and the resulting bedrock surface morphologies (e.g., Krabbendam & Glasser, 2011).
Lithological control over glacial erosion may relate to the (i) porosity of the bedrock, with slower flow rates and less erosion in porous rocks (Sugden, 1978); (ii) bedrock homogeneity or heterogeneity, which contributes to the meso-scale morphological character of the bedrock surface (Glasser et al., 1998); and (iii) the variable capacity of different lithologies to resist glacial abrasion (Harbor, 1995; Lane et al., 2015). Of particular significance are the contrasts between hard crystalline and softer sedimentary rocks, which have resulted in contrasting landscapes. Examples include transitions from rounded whalebacks to linear mega-scale glacial forms in the Canadian Shield (Eyles et al., 2021) or sub-glacially overdeepened basins that are compartmentalized due to the presence of erosion-resistant rock units (Gegg et al., 2021; Woodard et al., 2021).
The bedrock structure controls glacial erosion through ductile foliations and folds, discrete fractures and fault zones. Ice-flow-parallel foliations in metamorphic rocks promote the generation of elongate hollows, whereas those in isotropic lithologies are more uniform (Glasser et al., 1998). Within otherwise coherent bedrock, discrete fractures of typically pre-glacial origin (Dühnforth et al., 2010; Hooyer et al., 2012) are key features, which control the glacial erosion and the resulting glacier bed morphology (Woodard et al., 2021). The fractures are used by glacial quarrying processes, which typically operate within the lee side of the rock drumlins or Roches moutonnées (Bennett & Glasser, 2009; Iverson, 1991; Rastas & Seppälä, 1981). Fracture intensity governs the style of glacial erosion, and quarrying is the dominant mechanism in intensely fractured areas, whereas abrasion characterizes more intact rock volumes (Briner & Swanson, 1998; Crompton et al., 2018; Dühnforth et al., 2010; Woodard et al., 2019). Similar controls have been documented for sedimentary rocks, where thin-bedded and thick-bedded units may display dense and sparse jointing, which consequently favour quarrying and abrasion, respectively (Krabbendam & Glasser, 2011). The dip of the primary bedding and associated fractures may also control the style of erosion, as demonstrated by the dominance of abraded surfaces when bedding planes dip gently of moderately in the direction of the topographic basins (Kelly et al., 2014) or the flow-direction of the glacier (Lane et al., 2015). By contrast, cliffs and overdeepenings characterize areas where bedding dips in the opposite direction with respect to the slope of the valley (Kelly et al., 2014), and down-ice dipping bedforms are controlled by moderate bedding dips (Lane et al., 2015). Elongate topographic valleys of larger lengths and lateral extents in gneiss terrains are understood as products of syn-glacial removal of preferentially weathered (Krabbendam & Bradwell, 2014; Olvmo et al., 2005; Olvmo & Johansson, 2002) or otherwise intensely fractured domains of bedrock (Dühnforth et al., 2010; Scott & Wohl, 2019; Skyttä et al., 2015).
Abrasion has been considered as the dominant erosion mechanism under fast-flowing glaciers (Herman et al., 2015; Yanites & Ehlers, 2016). However, many (recent) contributions indicate that glacial quarrying and ripping are the dominant mechanisms in (intensely) fractured crystalline bedrock (Boulton, 1987; Dühnforth et al., 2010; Glasser et al., 2020; Hall et al., 2020) and result in effective erosion, particularly during glacial retreat. In contrast to the overriding positive correlations between fracture intensity and erosion efficiency, some recent numerical modelling indicates that, that, in the specific case of ice-bed parallel fractures, larger fracture spacing may promote quarrying (Woodard et al., 2019). Bearing these in mind, it is evident that both the composition and the structure of the bedrock contribute to the selection of the glacial erosion mechanism and efficiency, but less is known about which types of fractures (mechanical discontinuities) are effective in promoting quarrying and the development of distinct elongate bedrock depressions.
In this paper, we show that individual joints or shear fractures, even with substantial (lateral) extents, do not provide sufficient mechanical weakness zones to lead to the generation of significant elongate depressions along the bedrock surface topography. More specifically, such fractures localize glacial plucking, leading to the characteristic smoothed slopes and steep edges on the stoss and lee side of the bedrock bumps, respectively (Krabbendam & Bradwell, 2011). However, these fractures do not contribute to the development of longer depressions, which have steep edges on both margins. Our findings at the outcrop (up to 200 m) to the semi-regional scale (up to 6 km) indicate that laterally continuous valleys with steep, well-defined margins are associated with faults that have either (i) multiple slip planes arranged in stepping geometries, characterized by interaction damage zones in step-overs (Peacock et al., 2017) or (ii) distinct core domains comprising less cohesive fault gouge, indicative of a larger slip magnitude along the fault. Based on these results, we can further make predictions of the types of bedrock features underlying the observed topographic signatures along the bedrock surface.
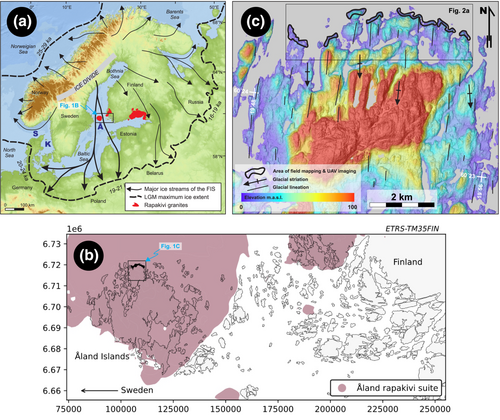
We examined the topography of glacially eroded crystalline bedrock in the northern part of the Åland Islands, southern Finland (Figure 1), which was subjected to pronounced glacial erosion of the Baltic Sea ice stream during the Pleistocene epoch. The study area is optimal for understanding the linkages between the glacial erosion processes, bedrock structures and the resultant landforms, as (i) the glacial movements associated with the different glaciations were similar in orientation, as manifested by a single set of N–S-trending glacial striations (Figure 1c), and (ii) the only lithological variable controlling the glacial erosion in anorogenic Rapakivi granite is related to different types of brittle structures (fracturesm and faults) within the rock, as the granites are otherwise uniform and have no ductile foliations. The study area displays exceptionally well-exposed bedrock outcrops (Figure 2b), from which we characterized the fracture systems within the bedrock using both UAV-acquired orthophotographs and geological field mapping methods. For extrapolating the study results to the semi-regional scale, we conducted structural interpretations on LiDAR-based digital elevation models (DEMs).
2 GEOLOGICAL BACKGROUND
The study area is composed of 1.58–1.57 Ga homogeneous and mesoscopically isotropic rapakivi granite (Figure 1b; Laitakari et al., 1996), emplaced during a Mesoproterozoic anorogenic magmatic event (Haapala & Rämö, 1992; Luosto et al., 1990; Rämö & Haapala, 2005). This magmatic event was associated with crustal extension (Korja & Heikkinen, 1995; Nironen, 1997), upward bulging of the mantle (Haapala & Rämö, 1992; Luosto et al., 1990) and the generation of diabase (dolerite) dyke swarms (Rämö & Haapala, 2005). Since the region has not been subjected to subsequent orogenic deformation, most of the Mesoproterozoic rapakivi granites, including the Åland Batholith, lack any ductile foliations. However, recent contributions have shown that they were subjected to crustal stresses that resulted in the formation of brittle faults, syn-fault extension fractures and later-formed regional fractures (Jokiniemi, 2021; Mattila & Viola, 2014; Ovaskainen et al., 2022; Skyttä et al., 2021).
Reconstruction of the dynamic behaviour of the Fennoscandian Ice Sheet (FIS) through the Pleistocene glacial cycles is based on geological evidence such as lineations, striations, till fabric and stratigraphy, glaciofluvial sediments and prominent end moraine complexes (e.g., Boulton et al., 2001; Larsen et al., 2016; Stroeven et al., 2016; Svendsen et al., 2004), as well as numerical ice sheet modelling (Batchelor et al., 2019; Patton et al., 2016; Siegert & Dowdeswell, 2002). One of the dominant characteristics of the FIS ice-flow trajectories is the Baltic Sea ice stream, which occupied the Baltic Sea basin (BSB) from the Bothnian Sea to the southern part of the basin (Greenwood et al., 2017) (Figure 1a). The ice stream reached its maximum extension in continental Europe during the last glacial maximum (LGM), branching towards the south and west.
The FIS flow patterns are generally well established for the last glacial cycle (e.g., (Boulton et al., 2001), and they probably exhibited similar characteristics during the preceding Pleistocene glaciations (Hall & van Boeckel, 2020; Svendsen et al., 2004). The BSB has thus been repeatedly subjected to glacial erosion by the FIS during the Pleistocene epoch (Boulton et al., 2001; Patton et al., 2016; Svendsen et al., 2004). In fact, one of the models suggested for the origin of the BSB is erosional over-deepening under the FIS during glaciations (Amantov et al., 2011; Puura et al., 2003). This is supported by the fact that up to 87% of the total Pleistocene sediment volume in the sink area in continental Europe (i.e., Poland) was deposited during and after Marine Isotope Stage 12, and the material originates from the BSB (Hall & van Boeckel, 2020).
The present study area lies centrally to the Baltic Sea ice stream with ice repetitiously moving in the north–south direction, as indicated by bedrock striations (360° ± 5°) and glacial lineations (Figure 1b). Glacial lineations in the Geta area are mostly rock drumlins formed parallel to the ice flow with significant polishing of their stoss sides. Rock drumlins are often considered old and long-lived bedforms that were reshaped during successive glaciations, thereby steering the local ice-flow directions (Krabbendam et al., 2016). Some of the rock drumlins in the present study area have a thin till cover on their lee side. The study area was deglaciated at around 10.8 cal ka BP, during the Yoldia Sea phase in the BSB history, with the relative sea level in front of the retreating glacier lying at 150 m above the present-day level (Ojala et al., 2013; Stroeven et al., 2016). Today, roughly 90–95% of the study area is composed of bedrock outcrops with some depressions filled by postglacial clays.
3 MATERIALS AND METHODS
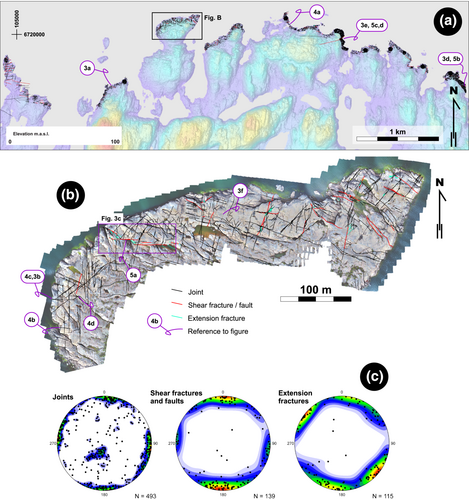
The area of the field investigations (outcrop scale) covers an approximately 4-km-long, E–W-oriented stretch along the well-exposed northern coastal area of the Geta Island, Åland Islands (Figures 1 and 2). The outcrops are exceptionally clean due to pronounced glacial erosion and exposure to present-day wave and sea ice activity. There is typically no vegetation within a distance of 50–100 m from the coastline; further inland, outcrop becomes gradually more covered and less accessible to low-altitude aerial imaging due to vegetation (Figure 3a,d).
We approach the research questions by characterizing and classifying the brittle structures of the bedrock and determining their effects on bedrock morphology. Furthermore, we extrapolate these findings to a semi-regional-scale interpretation, which covers the 6 by 6 km area of the Geta Island (Figures 2b and 6a), using a LiDAR elevation model (0.5 points/m2; available from the National Land Survey).
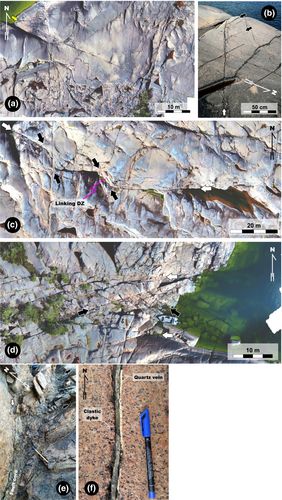
We conducted the outcrop-scale structural characterization of the bedrock using drone-acquired orthophotographs as the primary dataset. These orthophotographs have a lateral resolution of 0.55 cm per pixel, and they cover a total extent of 328 000 m2. The first step of characterization involved digitization of the dominant fracture traces on the orthophotos and the initial recognition of larger shear fractures and faults. The next step comprised field mapping using an A0-size printout with the digitized traces annotated on aerial photographs as base maps. The complementing field data include dips and azimuths of the various fractures as measured with geological compasses, topological relationships between fractures (Sanderson & Nixon, 2018); classification of fractures into joints (with no movement); extension fractures, shear fractures and fault zones; and orientation distribution of the different fracture types. Following the definitions by Peacock et al. (2016), joints display no relative movement between the bounding bedrock blocks and occur as isolated individual fractures or sub-parallel swarms of fractures, with no kinematic association with other fracture types. Extension fractures are inferred to have formed as opening-mode fractures, that is, mode I fractures, whereas no such inference can typically be made for joints. Shear fractures, in contrast, have visible displacement along the fracture plane, indicating mode II or mode III propagation. When several sub-parallel shear fractures are mechanically connected within the step-over areas, the developed structure may be classified as a fault zone. We refer to slip plane as the distinct surface along which the movement within a wider fault or fault zone took place. As glacial erosion on the bedrock surface resulted in rounding of the fracture margins along the outcrops and the rock typically lacks any markers, detailed observations of fracture apertures were not possible and recognition of the shear fractures and faults used the presence of abutting extension fractures within the fault damage zones (DZ; Figure 3b). The complete fracture dataset collected in the present study comprises 43 671 fracture tracelines and dip/dip direction measurements for 747 fractures, of which 493 represent joints, 139 faults and 115 fault-related extension fractures.
The third step in our workflow comprised recording the bedrock morphologies and linking them to the classified fractures. Here, we placed particular emphasis on linear topographic depressions that are longer than the steep, plucked lee-side slopes of individual rock drumlins (or roches moutonnées). In the next step, we correlated the distinct glacial erosional signatures upon the bedrock surface topography with the lower resolution LiDAR elevation within the immediate vicinity of the field mapping areas, as well as extrapolating the findings to semi-regional coverage (Figure 6a).
4 RESULTS
4.1 Fracture characterization
Observed fractures within the study area comprise joints, extension fractures, shear fractures and faults (Figure 3). The trace lengths of joints within the study area range from a few centimetres to more than 50 m (Figure 3a). Shear fractures in the area are recognized from abutting, obliquely trending extension fractures, which were generated due to slip along the hosting shear fracture and characteristically occur close to the termination of the shear fractures and define tip-damage zones (DZ; Figure 3b). An example of a fault, composed of sub-parallel shear fractures interlinked within step-over areas, is presented in Figure 3c. A characteristic feature for this type of fault is the presence of step-over DZs, where moderately dipping extension fractures abut the overlapping shear fractures, which constrain the width of the overstepping zone. The largest observed faults of this type exceed 120 m in length. Other types of observed faults comprise (i) up to 15-m-wide, laterally >200-m-long zones, characterized by densely spaced extension fractures abutting the parallel shear fractures at the fault margins (Figure 3d), and (ii) distinct faults with gouge-bearing core domains up to 20-cm-wide and abutting extension fractures within the DZ (Figure 3e; see also Figures 5c–e). The trace lengths of the faults with distinct fault-rock bearing cores are problematic to estimate, as they typically extend beyond the boundaries of the aerial photos. Joints typically lack any infill materials, but some N–S joints have infills of clastic sedimentary material and/or quartz (Figure 3f).
Joints occurring outside the deformation zones characteristically display orthogonal geometrical arrangements, as shown by the distinct clustering to sub-vertical, approximately N–S and E–W and gently NNE–dipping orientation maxima on the stereographic projections (Figure 2c). Shear fractures and faults generally follow the orthogonal joint patterns, as they define E–W and N–S-trending, sub-vertical orientation maxima on the stereograms (Figure 2c). The E–W set shows larger faults comprising wider DZ fracturing (Figures 2b and 3e–e), whereas the N–S shear fractures are less common, and they also typically occur as isolated features having weak linkages with parallel shear fractures. The orientations of the extension fractures deviate from the dominant orthogonal E–W and N–S trends of the other joints and faults as they define (i) a relatively tight belt-shaped girdle representing sub-vertical, NE–SW-trending fractures and (ii) a more scattered set representing E–W to WNW–ESE-trending fractures on the stereogram (Figure 2c). Within the latter set, several moderately NE-dipping planes correspond to the extension fractures within the linking-type DZs (Figure 3c).
4.2 Bedrock surface topography characterization, with linkages to fractures and faults
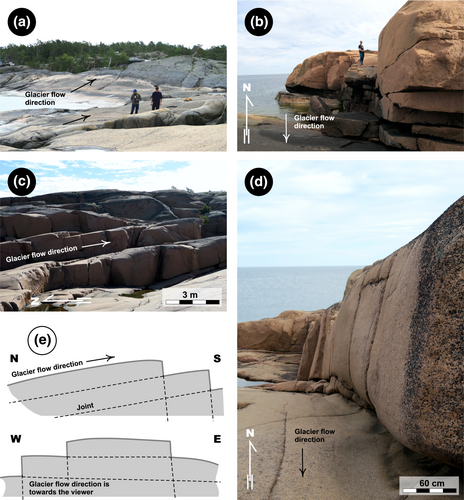
Topographic signatures of the bedrock surface outside the deformation zones are characterized by smooth and polished stoss sides (Figure 4a) and steep margins on one or two opposing lateral sides (Figure 4b–e). The stoss sides typically show sub-horizontal to gentle dips, following one of the dominant joint orientations, whereas the lee side and frequently also one other margin have been defined by the orthogonally arranged, E–W and N–S-trending joint sets. The edges of the sub-horizontal portions of the bedrock surfaces are rounded close to the vertical edges (Figure 4c,e), and localized erosion along the intersecting joint orientations indicates continued abrasion after the removal of some joint-bound bedrock blocks (Figure 4d).
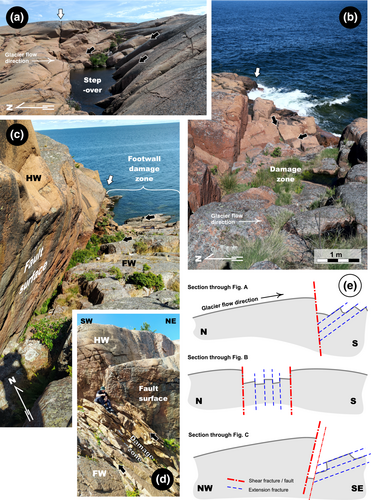
Within and close to faults, the topographic signatures are more heterogeneous, as characterized by localized depressions of variable morphologies. Step-over zones linking parallel segments of larger shear fractures display slightly elongate but laterally limited depressions, which are bounded by the sub-vertical to vertical shear fractures on one side and by the moderately dipping extension fractures on the other side (Figure 5a,e). Faults characterized by two larger bounding shear fractures, and numerous variably oriented extension fractures in between, define laterally continuous depressions (Figure 5b,e). These depressions are relatively symmetrical, have sharp edges and show blocky and irregular morphologies along the base of the depressions. The largest fault with a gouge-bearing core domain (Figure 3e) displays the most pronounced topographic signatures, characterized by a narrow (0.5–1 m) gorge, which can be followed for >100 m from the shoreline to the inland area (Figure 5c,e). The hanging-wall side of the fault defines an up to 7-m-high overhanging wall with a distinct elevation contrast between the different sides of the fault (Figure 5e). The hanging-wall side of the fault is relatively intact with low fracture density, whereas the foot-wall side is populated by a dense set of moderately NE-dipping extension fractures (Figure 5d), which locally govern the attitude of the bedrock surface (sloping towards the sea on the right-hand side of Figure 5c).
4.3 Extrapolation of the outcrop-scale results to less-exposed adjoining areas (semi-regional scale)
This section documents our interpretation how the results from the detail area (Figure 2) can be used to provide a geologically motivated structural interpretation within a semi-regional scale, allowing usage of lower-resolution datasets and minimizing the time required for the structural characterization of a larger area. We emphasize that our semi-regional scale structural interpretation (Figure 6) is based solely on the topographic signatures of the LiDAR data and did not include validation through field observations. For this reason, uncertainties and some sampling bias between the low-lying coastal and higher inland areas may be present, and the interpretation should be considered a first-pass model that can be validated and improved with focussed field observations.
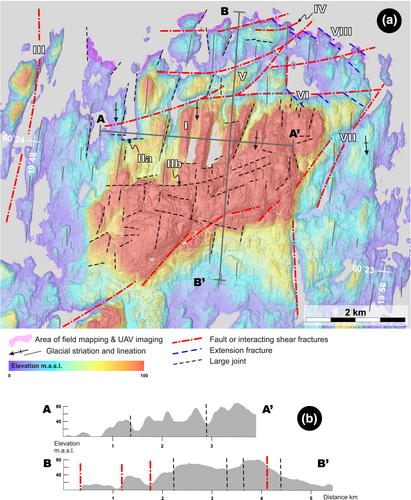
The dominant E–W and N–S trends of faults and larger shear fractures and the resulting topographic depressions observed at detailed scales (Figures 3-5) are also present within the semi-regional scale LiDAR DEM as distinct linear depressions of variable sizes (Figure 6a). Consequently, it is justified that we extrapolate our findings into wider scale to provide insight into structural controls in the development of landscape-scale topography. The magnitude of the elevation difference between the topographic highs and lows associated with semi-regional N–S and E–W-trending elongate depressions is approximately similar, but the topographic sections have contrasting styles (Figure 6b). The E–W section, at right angles to the ice-flow direction, displays relatively smooth morphological transitions from lows to highs, and the highest areas are characteristically rounded, which results in a continuous wave-form geometry with approximately 500-m wavelengths and 15- to 20-m amplitudes. In contrast, the ice-flow-parallel N-S section shows a less systematic morphology characterized by relatively flat domains at variable elevations, bounded by steep slopes associated with sub-vertical faults, particularly within the northern part of the section.
The above observations support the outcrop-scale findings that the brittle N–S-trending structures are less well developed than the E–W-trending fault systems. As a map-view summary, the following viewpoints can be highlighted: The development of narrow and elongate, fjord-like N–S-trending topographic lows is related to the combined effect of glacial abrasion along sub-horizontal bedrock surfaces and quarrying of flow-parallel joints (‘I’ in Figure 6a), without significant contributions from larger faults or fault zones. For some of such ‘fjords’ (or megagrooves), the abrupt termination and the associated steep to sub-vertical E–W slope appear to be controlled by a distinct discontinuity (referring to any unspecified fracture; IIa). These discontinuities have very limited lateral continuity outside the fjord termination, or they have a very limited effect on the DEM morphology (IIb); we attribute them to jointing instead of faulting.
Even though we found no direct evidence for the presence of N–S-trending faults or fault zones, comparable to the E–W-trending faults in the study area (Figures 3c–e and 5), it is likely that some well-defined elongate depressions (III) are the surface expression of N–S faults or fault zones. This is even more likely, as the interpreted fault at III spatially coincides with a narrow strait separating the Geta Island and the landmasses further west. Some of the approximately E–W-trending faults recognized within the detailed area (Figure 5c) can be linked to distinct topographic depressions (IV). Extrapolated further towards the south, these features define a network of anastomosing faults, with an overall E–W trend, but locally associated with NE–ENE-trending splay-type terminations (IV) and linkages between the E–W-trending segments (V). The distinct E–W-trending topographic feature at VI defines the boundary between the lowland in the north and higher elevation bedrock in the south, and we tentatively attribute it to one of the largest faults within the study area. A similarly significant, but more NE–SW-trending, curved and discontinuous fault (VII) bounds the topographic high along its SE margin. The frequently observed fault-related extension fractures (e.g., Figure 5e) are evident within the NE corner of the Geta Island (VIII), where they are associated with the E–W faults and locally define the geometry of the shoreline. The spatially restricted occurrence of these extension fractures suggest that the E–W faults terminate close to the shoreline.
5 DISCUSSION
5.1 The relationship of bedrock fractures and glacial erosion mechanisms
Recent studies have shed light towards understanding coastal erosion processes, and the findings indicate that fracture-controlled quarrying is the dominant erosion process (Buchanan et al., 2020). Major coastal erosion through quarrying typically requires rocks characterized by distinct layering, including mechanically weak layers that allow detachment of larger blocks (Prémaillon et al., 2021). Further, as the glacial striations are preserved on the oucrop surfaces, we conclude that the potential effect of coastal erosion in the Geta Island is limited to intersections of the fault damage zones and shorelines (with joint-bound block size of less than 2 m, e.g., right side of Figure 3d), while the bulk of erosion relates to glacial processes. Our results show clear linkages between the tectonic structures (faults and fault zones) and the surface topography of the bedrock. A such, the results are in line with the models in which the pre-existing fractures are the dominant mechanical discontinuities used in quarrying (Hooyer et al., 2012; Lane et al., 2015) and indicate that the generation of syn-glacial fractures is very limited. The tectonic origin of those fractures that contributed to the formation of the bedrock surface topography allows recognition of three specific patterns: (i) The attitudes of the extension fractures within the fault damage zones (tip DZ or linking DZ) have gentler dips than the shear fractures or joints occurring outside the fault zones, and (ii) fracture densities within the DZs are higher than within the surrounding areas, and (iii) fracture connectivity within the DZs is higher than within the surrounding areas.
The gentler fracture attitudes within the fault DZs have resulted in asymmetric topographic depressions characterized by sub-vertical to vertical slopes associated with the shear fractures or faults and moderately-dipping slopes associated with extension fractures (Figure 5a,c–e). Together, these features result in geometries comparable to the cliffs and overdeepenings in areas where the dip direction of the primary bedding in sedimentary rocks is opposite to the slope of the glacial valley (Kelly et al., 2014). By contrast, bedding surfaces parallel with the glacial valley slope (Kelly et al., 2014) or dipping towards the ice flow (Lane et al., 2015) have generated smoother topographic signatures characterized by abrasion. The higher fracture density and connectivity within the fault zones contribute to the fragmentation of bedrock into small block sizes and hence promote quarrying as the main mechanism of glacial erosion, as concluded by (Dühnforth et al., 2010). As the fragmented fault zones are topographically lower than surrounding abraded areas, it is evident that quarrying has been more effective than abrasion in eroding the bedrock. This finding is in conflict with the model in which abrasion dominates over other subglacial erosional processes beneath fast-flowing glaciers (Herman et al., 2015; Yanites & Ehlers, 2016) but is in line with other studies indicating quarrying dominates over abrasion (e.g., Loso et al., 2004), with particular reference to effective subglacial quarrying during the final stages of glacial cycles, when abundant subglacial meltwater was available to aid in quarrying (Glasser et al., 2020). The most pronounced glacial erosion could be achieved by glacial ripping, involving hydraulic jacking of pre-existing bedrock fractures by overpressurized sub-glacial meltwaters (Hall et al., 2020), but no widespread bedrock fragmentation associated with sandy or silty fracture infills was found in the present study area. For this reason, we attribute the zones of the most pronounced glacial erosion to quarrying, localized by the presence of pre-glacial faults and fault zones.
As discussed earlier (Sections 4.2 and 4.3), the N–S-trending fractures occurring parallel to the ice flow were locally used by glacial quarrying (Figure 4b,d,e) but did not have a major role in defining equally continuous elongate topographic depressions comparable to those associated with the E–W-trending faults. Consequently, the N–S-trending fjord-like topographic valleys (or mega scours) in the Geta Island are megagrooves (Bradwell et al., 2008; Eyles, 2012; Stokes & Clark, 2003), which are pathways for enhanced glacial flow that developed during successive glacial advances (Roberts et al., 2010). Megagrooves typically develop in well-stratified or layered rocks (Krabbendam & Bradwell, 2011), and their orientation may be controlled by the alignment of the lithological units and contacts (Roberts et al., 2010) or fractures (Bradwell et al., 2008). As s layering or stratification is absent from the bedrock of the present study area, it is likely that bedrock fractures had the primary contribution to the development of the observed megagrooves. Consequently, we suggest that the N–S-trending ice-flow-parallel fractures contributed to the process of lateral plucking (Krabbendam & Bradwell, 2011), which at small scales provided some control over the width of the roches moutonnées (Rastas & Seppälä, 1981) and at larger scales defined the margins of the larger elongate ice-flow-parallel fjord-like topographic depressions (Figure 6). Moreover, we infer that the sub-horizontal ice-bed parallel fractures—which are poorly constrained in this study—played a role in the effectivity of glacial quarrying (Woodard et al., 2019) and ice-bed morphology variation.
5.2 Implications to ice flow dynamics-driven glacier erosion in landscape evolution
Bedrock along the northern coast of the Åland Islands has been subjected to prolonged streamlining during successive glaciations, with particular contribution from the fast-flowing Baltic Ice stream during early Holocene (Greenwood et al., 2017). The flat-lying polished rock surfaces, distinct glacial striae and whalebacks are compatible with basal debris-driven abrasion under hard-bed conditions as the prevailing erosion mechanism during the Late Pleistocene (Glasser & Bennett, 2004). The scarcity of short distance transport of boulders and boulder fields on Åland further indicates that glacial quarrying, jacking or ripping (Hall et al., 2020; Krabbendam et al., 2022) were not the regionally dominant erosion mechanisms. As such, conditions of glacial erosion in Åland indicate glacial conditions of thick and fast, constantly sliding ice (e.g., Evans, 1996; Glasser & Bennett, 2004), which is likely associated with a thin clay rich ‘lubrication’ layer of former basinal sediments beneath the streaming glacier. Similar conditions are typical for numerous locations around the FIS and the former Laurentide Ice Sheet region (Bukhari et al., 2021; Eyles, 2012; Eyles et al., 2016; Krabbendam et al., 2016). In areas of homogeneus bedrock lithology, we conclude that the presence of pre-existing fractures and topographic depressions—as recognized in this study—are a result of localized, structurally controlled quarrying that took place under dominantly abrasive erosional conditions. This finding is in line with the conclusions that site-specific fracture patterns is the most important feature in controlling the bedrock erosion and associated bed morphology (Krabbendam et al., 2016; Woodard et al., 2021).
In a regional scale, bed morphology is the main controlling factor over the slip of hard-bedded glaciers (e.g., Eyles, 2012; Kamb, 1970), as it contributes to the resistance of the ice to flow across and around basal obstacles. Bingham et al. (2017) recognized that much of the variability in the basal traction of the West Antarctica glaciers relates to topographical variation at the ice bed in the scale of individual subglacial basins, and such variation may not be adequately constrained with the available geophysical methods. For the presently exposed glacier beds in Northern America and Fennoscandia, structurally controlled bedrock ridges have been shown to slow down or temporarily even stop the glacier as shown by the deposition of end moraines and glacifluvial deltas (Crossen, 1991; Skyttä et al., 2015). Such findings that even moderate (<100 m) vertical changes in the ice-bed topography contribute to the ice flow (Skyttä et al., 2015) further highlight the need for using structural geological approaches in addressing the topographical variations of the ice bed. This applies to understanding the major deformation zones (faults, shear zones and fracture zones) but also the spatial variability in fracture densities within the bedrock, as the latter has been shown to play a role in the development of surge-type glaciers (Crompton et al., 2018).
6 CONCLUSIONS
This investigation builds upon the existing understanding about the relationship between bedrock fractures and glacial erosion through illustrating that different types of fractures contribute to different styles and intensities of glacial erosion. Specifically, we demonstrate that individual joints or isolated shear fractures only have a limited and local influence on the development of the morphology of glacially eroded bedrock in mesoscopically isotropic granite. However, when interacting with other glacially generated landforms, even these individual joints may contribute to the development of abrupt transitions of otherwise continuous morphologies, such as terminations of fjord-shaped topographic depressions. The main outcome of this work is that brittle structures larger than individual fractures are required to introduce such mechanical discontinuities into bedrock, which will lead to pronounced glacial quarrying and generation of elongate topographic depressions along an eroded bedrock surface. Such structures may be either (i) larger shear fractures, which are linked to other shear fractures through the generation of extension fractures (and damage zones), or (ii) faults with gouge-bearing core domains. The structurally controlled character of the resulting bedrock depressions is evident by their sharp, fracture-controlled edges. Applying the findings about the significance of the fracture type for glacial erosion into semi-regional scales allowed us to attribute the contrasting character of two orthogonal topographic profiles not just to their relationship with the ice-flow direction, but also with the contrasting type of the dominant fractures. The results of this study also potentially enable the prediction of the character of bedrock structures underlying topographic depressions and may therefore aid in focusing investigations associated with infrastructure projects.
ACKNOWLEDGEMENTS
We acknowledge constructive reviews by two anonymous reviewers and the support by the Finnish Research Programme on Nuclear Waste Management (KYT 2019-2022), the Geological Survey of Finland (MIRA-3D and KARIKKO projects), and Academy of Finland (Antti E.K. Ojala: grant number 322252) for funding.
CONFLICT OF INTEREST STATEMENT
The authors have no conflict of interest to declare.
Open Research
DATA AVAILABILITY STATEMENT
The data that support the findings of this study are available from the corresponding author upon reasonable request.


