Investigation of Drying Curves of Lithium-Ion Battery Electrodes with a New Gravimetrical Double-Side Batch Dryer Concept Including Setup Characterization and Model Simulations
Abstract
Herein, an experimental setup comprised of a stationary convection dryer (Comb Nozzle Dryer) supplemented by a measurement for gravimetric drying curves is introduced. The drying process of anodes for lithium-ion batteries is experimentally investigated and compared to modeling results, showing very good agreement for the investigated films. Heat transfer coefficients of the issued impinging nozzles are characterized and measured quantitatively and are used for the drying simulation of the gravimetric drying experiments. In situ temperature changes in the films are measured and presented using an infrared camera setup.
1 Introduction
The drying process of electrode coatings for lithium-ion batteries is a product quality-determining step in the process chain. Electrode adhesion as well as rate capability and capacity of the final cell decrease, when high instead of low drying rates are chosen for electrode drying.[1-3] Further investigations show a correlation between high drying rates and an accumulation of binder at the electrode surface and depletion at the substrate.[4] The cause of this binder movement during drying has been focused on in some research so far. Battery electrodes are fabricated as wet particulate coatings. The drying process can be subdivided into two governing stages. During the first stage, all pores between the particles are solvent filled, water evaporates at the film surface, whereas the film shrinks during drying. At one point, first pores within the structure begin to empty and the film ends to shrink, reaching the end of film shrinkage (EOF) and the second drying stage.[2, 5, 6] Using cryogenic scanning electron microscopy experiments, it was found that capillary transport is the governing mechanism transporting solvent to the electrodes surface during the second drying stage, supposedly carrying the binder along.[5] These experiments though are very complex and based on single measurements, which is why further research is needed to establish new and easy ways to illuminate the drying process. In literature, further experiments and simulations investigate the drying process of lithium-ion batteries to predict its influence on cell performance. Susarla et al. simulated the drying process of cathode particles in water and N-methyl-2-pyrrolidone (NMP) using a 1D model, concluding that half of the drying time is needed to remove the last 10% of solvent from the electrode. In their simulation, they assumed one, two, and three stage drying scenarios.[7] A comparison between water-based and NMP-based electrode drying was undertaken by Wood et al.[8] The costs of electrode coating manufacturing in industrial scale were calculated based on drying properties of the two different solvents. To investigate the drying behavior experimentally, methods are described in literature that disrupt the drying process to take single samples at different drying times, receiving a drying curve by combining single measurement points. The correlations between drying conditions and electrode characteristics as well as cell performance were examined.[2, 9] To the authors knowledge, research exists that either simulates drying behavior of lithium-ion electrodes or investigates it experimentally.[6, 10] The comparison of experiments under defined and industrially relevant drying conditions with simulation though has so far not been realized. The major challenge is the experimental setup that has to allow for industrially relevant drying conditions and render in situ measurements possible at the same time. In situ drying curves of liquid coatings have been recorded by measuring the heat flux and the substrate temperature simultaneously. The results were in good agreement with gravimetric measurements.[11] The heat input though was not realized by defined drying conditions, but by using a heating plate. In the work shown here, the measurement of weight and temperature of wet films over time during drying is possible. The drying setup allows for high drying rates in combination with a homogeneous distribution of mass and heat transfer coefficients. To achieve defined drying conditions, a stationary dryer as described by Cavadini et al. was used and extended by an experimental setup to gravimetrically track the drying process.[12] This renders a continuous measurement of a drying curve possible that is not influenced by disrupting the drying process. A model is proposed that is able to theoretically describe the drying process in terms of solvent loading and film temperature over time.
2 Experimental Section
To record the film temperature over drying time with an infrared (IR) camera and to obtain gravimetric drying curves, electrode slurries were prepared using the same mixing procedure and paste composition for all the experiments in this work. To show reproducibility, each measurement of a gravimetric drying curve was repeated at least three times.
2.1 Slurry Preparation
For slurry preparation, a dissolver (Dispermat CN10, VMA Gretzmann, Germany) with a batch volume of 500 mL was used. The vessel had a diameter of 100 mm and the dissolver disc had a diameter of 90 mm with 6 pins of a diameter of 5 mm and a height of 10 mm. The final slurry was composed of 44 wt% dry mass. The first step of mixing consisted of a solution step of sodium carboxymethyl cellulose (Na–CMC) (Sunrose MAC500LC, Nippon Paper Industries, Japan) in water for 1 h. In a dry mixing step that lasted 10 min at 200rpm, carbon black (Super C65, Timcal, Switzerland) and graphite powder (SMGA, Hitachi Chemical Co. Ltd., Japan) were mixed with the dissolver. The CMC solution and water were added to the dry mass in three steps while increasing the solid fraction. The slurry was then mixed for 45 min at 1500 rpm, while degassing and cooling. Styrene butadiene rubber (SBR) was added at last and mixed in for 10 min at 500 rpm. The dry electrode was thereby set to the composition shown in Table 1.
| Material | Dry mass [wt%] |
|---|---|
| Graphite | 93.00 |
| Carbon black | 1.40 |
| CMC | 1.87 |
| SBR | 3.73 |
2.2 Gravimetric Drying Curves
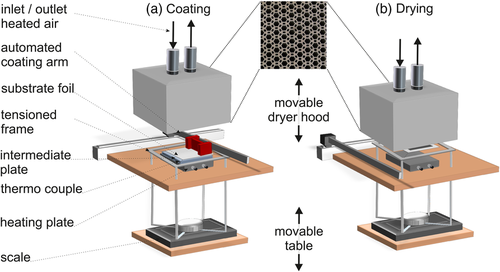

| T dryer [°C] | T heating plate [°C] | α [W m−2 K−1] | A el [cm2] | Substrate | PET cutout | |
|---|---|---|---|---|---|---|
| Gravimetric measurement | 80 | 50 | 35 | 9 × 9 | Copper foil | yes |
| Temperature (IR) experiment | 48 | – | 35 | 10 × 14 | PET foil | no |
The assumption here was that all pores were saturated and filled with solvent at the EOF shrinkage, and the corresponding solvent loading can thus be estimated with the knowledge of the dry film porosity ε, the dry film thickness dfilm, which was assumed to stay constant after the EOF shrinkage, the solvent density ρs, and the area as well as the mass of the electrode.
2.3 Film Temperature Measurements by Means of an IR Camera
A wet film was coated onto a transparent substrate (PET foil, 22 μm) and dried under the comb nozzle dryer with a heat transfer coefficient from the top adjusted to 35 W m−2 K−1 at a dryer temperature of 48 °C as shown in Table 1. The film bottom surface was filmed with an IR camera (FLIR T530) that replaced the heating plate, and additional to the IR measurement, a thermocouple type T was used to track the film temperature simultaneously. The usage of the IR camera hindered the usage of the automated coating device in the shown experimental setup. Therefore, the films for this experiment were coated manually and transferred to the dryer after coating. Since no measurement of the films weight over time was conducted and a precise coating area was not relevant, no PET foil with a cutout was used for coating. Due to the temperature sensibility of the camera, a temperature below that of the gravimetric setup was chosen.
3 Simulation of Drying Curves
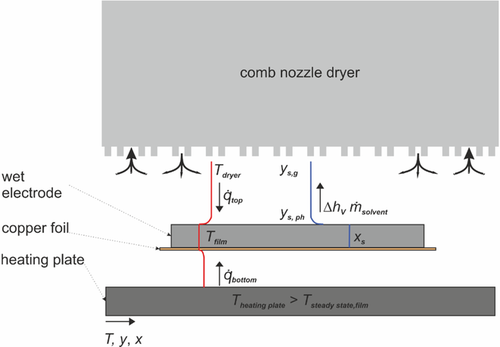
To simulate film temperature and solvent loading of the film over time, drying kinetics have to be modeled and mass balances and energy balances have to be solved. In Figure 3, the energy flows are shown. Drying is realized by a major convective heat flux supplemented by radiation from the comb nozzle dryer at the top (see Section 3.4). To establish defined drying conditions from the bottom, a heating plate is placed underneath the substrate in a defined distance, causing a minor heat flux from the bottom due to convection and radiation (see Section 3.5). The evaporating solvent is removed by exhaust nozzles in the dryer hood. Mass transfer only takes place at the top (see Section 3.3). Radiation is considered from the top and bottom.
3.1 Assumptions for Balancing
Drying of a wet film is the removal of a solvent from a solid material by an energy input, in case of a convection dryer by a heated gas, which is usually air, flowing over the film. The hot air provides the energy for the solvent evaporation and is also necessary to remove the solvent enriched gas phase. Based on this, the kinetics of heat transport to the film and the kinetics of mass transport of the solvent from the film into the ambient air determine the rate of drying. Depending on the properties of the solid medium, different resistances for both transport mechanisms must be considered.
At the beginning of the drying process, evaporation of the solvent takes place on the saturated film surface. The rate of evaporation at this point depends on two main factors. First, the evaporation rate is determined by the gradient between the solvent content in the gas phase and at the interface of the liquid film. The solvent fraction in the gas phase depends on the air temperature and the relative humidity, and the solvent fraction at the interface on the thermodynamic phase equilibrium and the solvent loading of the film. The other determining quantity is the mass transfer coefficient β, defined by the transport of the gaseous solvent through the boundary layer, which is directly dependent on the air flow induced by the convection dryer and thus the heat transfer coefficient α. As long as a constant drying rate prevails, meaning that solvent evaporates from the surface without any transport limitations within the film, an equilibrium between incoming heat flux and outgoing enthalpy flux due to evaporation leads to a constant film temperature, which is called wet bulb or steady-state temperature.
During this so-called first drying stage, the film shrinks and at a certain point, depending on the system and drying conditions, transport limitations within the film start to play an important role. This is especially the case in polymer film drying, where the diffusion of the solvent within the polymer is very slow and the film surface is no longer saturated.[13] This results in a solvent content of the film which is not only time dependent but also depends on the position within the film. In the drying of porous films, the first drying stage typically prevails at least until the EOF shrinkage. However, capillary transport has been shown to be a determining mechanism that leads to a transport of the solvent from the pore interior of the film to the film surface.[14] Schlünder found that a constant drying rate during drying of particulate films can prevail long after the EOF down to a relative wet surface area of less than 0.1%, depending on the particle shape.[15] The existence of capillary transport during the drying of battery coatings has been reported by Jaiser et al.[5, 15] In addition to mass transfer, heat transfer influences the drying kinetics, which is why temperature gradients over the film height caused by poor thermal conductivity must also be considered. During the first drying stage, the film can be considered as a mixture of solvent and active material, whereas after the EOF, more and more pores are filled with air, which leads to a decreasing thermal conductivity. However, if the thermal conductivity of the material is high and the thickness of the film is small, the thermal resistance of the film is negligible compared to the resistance for the incoming heat flux from the outside.
Since the battery electrodes investigated here consist of active material particles with a high mass fraction of about 93% and a polymer fraction of only 5.6%, and since capillary transport is assumed to be the determining mechanism for solvent transport to the electrode surface for this porous system, no spatially resolved simulation was used. The drying of the remaining solvent within the polymer was considered using sorption data from Eser et al., which were determined for battery electrodes.[16] The thermal conductivity of the dry film was assumed to be sufficiently high to lead to a uniform temperature of film and substrate over the film height.
The considered length s for both mass and heat transfer is the dry film thickness of the electrode with a value of 83 μm (see Table 3). To account for the worst case, which is a completely dry electrode compared to a semiwet or wet electrode, the thermal conductivity of the dry electrode was considered with λfilm = 2.46 W m−1 K−1 based on experimentally determined values found by Oehler et al.[17] For the heat transfer coefficient αtop, a value of αtop = 39.3 W m−2 K−1 (see Table 4) is assumed, as explained in more detail in the following. The mass transfer coefficient is derived from the value of the heat transfer coefficient (see Section 3.4.1) with . The effective diffusion coefficient in the porous electrode structure was calculated at the steady-state temperature of by means of the Fuller equation and the model after Zehner Bauer and Schlünder to .[18, 19] This results in a Biot number for heat transfer of Bi = 0.0013 and a Biot number for mass transfer of Bi′ = 0.3529. This indicates that heat and mass transport resistances within the porous electrode structure are small compared to resistances at the outside and are thus negligible. The thermal conductivity of the copper substrate is 160 times higher than that of the film and thus is negligible as well. Based on these estimations, the chosen modeling approach, which balances film and substrate as a whole, is justified.
| Dry film thickness [μm] | Dry area weight [ | Porosity | |
|---|---|---|---|
| Gravimetric experiment | 83 ± 5 | 72 ± 5 | 0.57 |
| Temperature (IR) experiment | 69 ± 4 | 63 ± 4 | 0.57 |
| α top [ | [ | |
|---|---|---|
| TLC | 35.0 | 0.79 |
| Linear regression | 39.3 | 0.89 |
3.2 Simulation Model: Instationary Energy Balance and Heating Phase
The time-dependent change of the film enthalpy in terms of its mass Mfilm, its heat capacity , and its temperature Tfilm is defined by the input heat flux from the top and the bottom () as well as the outgoing enthalpy flux accompanied by the solvent evaporation .
After the first drying stage is over, the electrode with the dry mass Mel and the copper foil with the mass will heat up.
The temperature-dependent heat capacity of the copper foil was calculated according to “Chemical Properties Handbook.”[21] The change of the heat capacities of all components within the considered time steps was assumed to be negligibly small, leading to an averaged value for the heat capacity during each time step at the averaged film temperature Tfilm, altogether leading to Equation (8).
3.3 Evaporating Mass Flux
Herein, KSt is the Stefan correction factor in Equation (14) which considers additional mass transport due to interactions between evaporating solvent molecules and resulting drag flows. It is therefore dependent on the amount of evaporating solvent in terms of the gradient between molar fraction of solvent in the gas phase and the molar fraction of solvent at the interface . is the medium temperature at the top between film and dryer.
The molar density of air is calculated using the assumption of an ideal gas.
The factor n is slightly dependent on flow conditions and equals for laminar flows and . Turbulent flow conditions are assumed here, resulting in n = 0.42. The Lewis number reflects the ratio between mass and heat transport by two additional dimensionless numbers, Schmidt Sc and Prandtl Pr. is the heat capacity of air and can be derived from VDI Wärmeatlas.[19]
To solve Equation (13), furthermore, the molar fractions of solvent in the gas phase and at the interface are required. For the gas phase, the dew point temperature of the dryer air is integrated into the Antoine equation for water, derived from VDI Wärmeatlas to receive the saturation vapor pressure at the given dew point temperature :
3.4 Heat Input from the Top
The heat input into the film with the area from the top is defined by the temperature difference between film Tfilm and dryer Tdryer as well as the heat transfer coefficient of the dryer (see for example Equation (21), supplemented by the Ackermann correction factor .
The Ackermann correction accounts for the mass transfer in terms of an enthalpy flux, influencing the heat transfer and is defined via Equation (22)
Here, is the temperature-dependent heat capacity of the solvent, in this case water, which is calculated according to VDI Wärmeatlas.[19] All temperature-dependent material-specific properties are based on empiric formula given in chapter D3.1 in VDI Wärmeatlas.[19] is the evaporation enthalpy of water and also calculated according to VDI Wärmeatlas.[19]
3.4.1 Heat and Mass Transfer by Convective Air Flows
The distribution of the conductive heat transfer coefficient of the comb nozzle dryer was determined by the use of thermochromic liquid crystals (TLCs) preliminary, as presented by Cavadini et al.[12] The heat transfer coefficient is measured in dependency of the dryer air flow rate and the distance between dryer hood and substrate.
The experimental value for the drying rate is determined within the first seconds of drying.
3.4.2 Heat Flux by Radiation from the Top
The amount of heat flux by radiation can be estimated with an equivalent heat transfer coefficient using a simplified, linearized, and modified Stefan–Boltzmann (Equation (24)) and assuming fluxes between two parallel plates, which can be calculated with Equation (25).
The heat transfer coefficient from the top can be calculated by the use of the conductive heat transfer coefficient that is either or and the additional flux of radiation (see Equation (26)).
3.5 Heat Input from the Bottom
The heat transfer coefficient is thereby composed of a contribution due to free convection ( and radiation (, with .
3.5.1 Heat Transfer by Free Convection
The Rayleigh number is hereby dependent on the acceleration of gravity, with and the isobaric thermal expansion coefficient that can be approximated by assuming an ideal gas. The characteristic length is the distance between heating plate and substrate/film. The temperature-dependent material properties can be derived from Table 2 for the medium temperature at the bottom
Thus, the heat transfer coefficient due to free convection is determined in dependency of the temperature difference that changes during the drying process.
3.5.2 Heat Flux by Radiation from the Bottom
3.6 Initial Values for the Simulation
3.7 Extension to 2D Model: Distribution of the Heat Transfer Coefficient
Since the comb nozzle dryer is a stationary dryer with supply and exhaust nozzles, there is a distribution of the heat transfer coefficient over the surface area, which was measured by means of TLC measurements as described earlier. Exemplary distributions of experimental heat transfer coefficients for different flow rates and at a distance of 20 mm between substrate and dryer hood are shown in Figure 4. For five different values of α median (corresponding to the five different air flow rates), a distribution of heat transfer coefficients with different relative surface fractions is given.
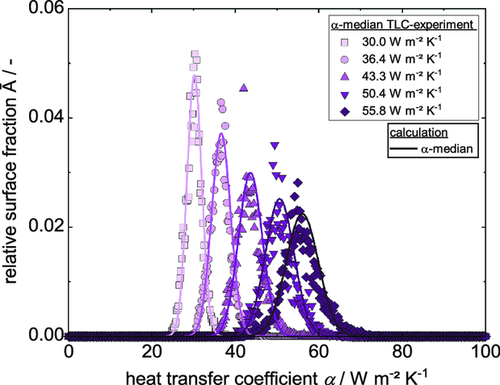
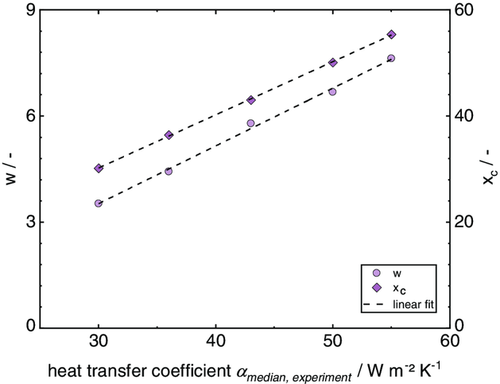
By the use of Equation (36) and (37), a distribution of the heat transfer coefficient can be derived for each value of within the given range of . The characteristic parameters w and are plotted over the experimental heat transfer coefficients , as shown in Figure 5.
The influence of the distribution of the heat transfer coefficient on the solvent loading and temperature over time is introduced via the heat input from the top and the evaporating solvent, as shown in Equation (38) and (39). The dependency of drying on the local heat transfer coefficients is considered by calculating the temperature and solvent loading for each given heat transfer coefficient with a step size of considering its corresponding fraction of area. This results in an array of drying curves for each fraction of area and corresponding heat transfer coefficient. By adding up the array of curves into one single curve (see for example Equation (40) and (41)), the accumulated distribution curve can be gained. n hereby is the number of values for the heat transfer coefficient within the distribution.
4 Results and Discussion
To visualize the temperature distribution within a drying film, first of all the results of an IR-experiment are presented. The results are used to interpret experimentally derived gravimetric drying curves, which are compared to simulation results using the observed distribution of heat transfer coefficients. The simulated drying curve considering the local distribution of the heat transfer coefficient is compared to a calculation based on a single median value for the heat transfer coefficient, here called α median.
4.1 Investigation of Temperature Distribution During Drying with IR Camera Measurements
Temperature distributions of a film during drying were recorded by an IR camera. Figure 6a–d shows the film from the bottom at different times of the drying experiment. In Figure 6a, the beginning of the drying is shown. The film itself is at the steady-state temperature of 22.2 °C (see for example Sp1 and Sp2 Figure 6a). In the background, the honeycomb pattern of the nozzle field is visible behind the PET substrate. The analyzed film area for the time-dependent temperature curve shown in Figure 7 is marked. In Figure 6b), an excerpt of the film after 136 s of drying time is shown. At this point, the film starts to heat up in some spots that resemble the honeycomb pattern. The film thereby shows a temperature gradient in itself with the temperature varying between 35.7 and 22.2 °C, as shown from the exemplary spots “Sp1” and “Sp2” (Figure 6b). Of note, 9 s later, the film still shows cool spots of 22.3 °C (Sp2, Figure 6c), compared to an area with a temperature that is already at 39.8 °C (Sp1, Figure 6c). After 250 s, the film has temperatures between 43.5 and 44.7 °C (Sp1 and Sp2, Figure 6d) in the considered area. It is noticeable that the film does not dry from the edges but mainly randomly over the whole area as would be expected due to the experimental setup. A slightly inhomogeneous drying from the bottom right corner can most likely be explained by a small variation in the distance to the dryer, caused by the experimental setup or a slightly smaller film thickness at this point. The remaining cool area on the left hand side is caused by residual slurry that was left during the coating process. The existence of hot spots all over the film as highlighted in Figure 6b,c hints that the local distribution of the heat and mass transfer coefficient influences the drying process and has to be considered to simulate the film drying correctly. The existence of the hot spots leads to the assumption that areas of the film dry earlier than others and no lateral solvent transport is present in the dimensions relevant here. Lateral solvent transport would have to take place over a distance of ≈ which is the distance between the nozzles, whereas the maximum distance of solvent transport to the electrode surface would be the wet film thickness, thus being ≈ and as such two orders of magnitude smaller.
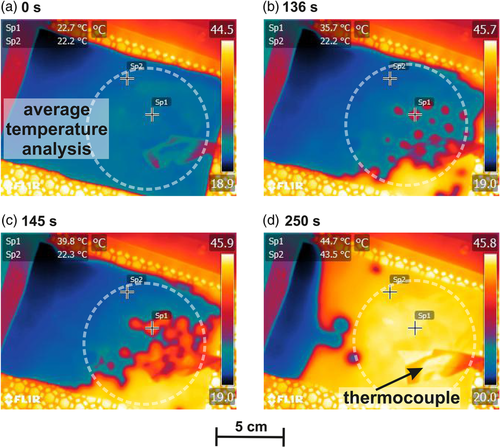
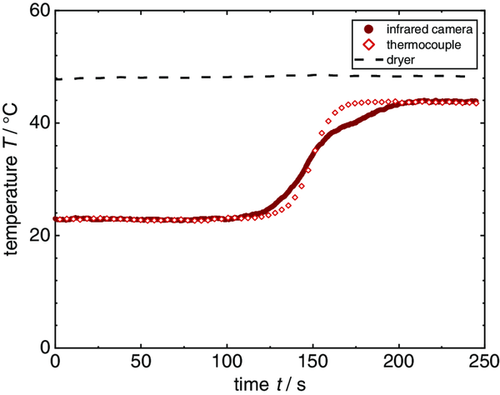
The film temperature was logged by the IR camera, as well as a thermocouple that was attached to the bottom of the substrate with adhesive tape and thermal conductive paste. It is visible at the lower right corner in each picture. The temperature profile of the thermocouple and the IR profile are compared in Figure 7. For the temperature curve of the IR camera, a round cutout of the film area, as highlighted in the pictures, was used to give an average temperature with a resolution of (e.g., Figure 6a). The temperature curves match each other in terms of the steady-state temperature at the beginning of the heating phase and regarding the end temperature. What becomes clear here is that the temperature curve measured by the thermocouple is highly dependent on the position it is placed at. Although start and end temperatures reflect the film drying quite well, the beginning of the temperature increase and the curve itself depends on the position of the thermocouple. In this case, the thermocouple was placed close to the position of a hotspot, which is why the averaged film temperature increases earlier, due to heating up at the bottom-right corner, but the temperature at the position of the thermocouple follows soon after. The temperature increase in the thermocouple is steeper, since it measures at one position, whereas the averaged temperature of the IR measurement is influenced by cooler spots within the analyzed area.
The IR experiment shows that a distribution of the heat transfer coefficient influences the drying behavior and thus has to be considered regarding simulation of the drying curve.
4.2 Simulation of Gravimetric Drying Curves Using the 2D Model
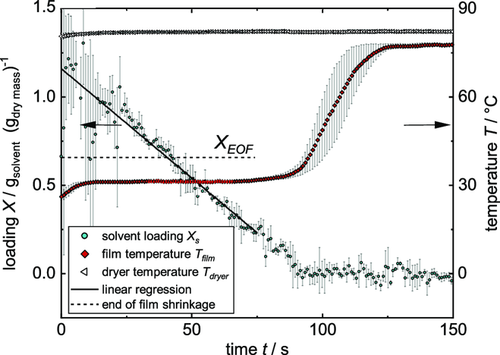
As described earlier, the comb nozzle dryer was used to record experimental drying curves. Three films with initial solid content of 44 wt% were independently coated and dried as described in the Experimental Section. Weight and temperature were measured until each film was dry, resulting in dry films with the properties introduced in Table 3. The averaged experimental data of three films during drying is shown in Figure 8. The decreasing solvent loading due to evaporation shows a linear course until the film is dry. The temperature starts with a heating phase within the first seconds until it reaches the steady-state wet bulb temperature, which it keeps almost until the film is dry. The dry film heats up until an equilibrium temperature close to the dryer temperature is reached. As described earlier, the temperature of the bottom heating plate was chosen between steady-state temperature and dryer temperature. Thus, the term of free convection switches from a heat flux going into the film to an outgoing heat flux during the heating up phase of the film. Because of that, the equilibrium temperature at the end of the experiment lies below the dryer temperature. The theoretical EOF shrinkage based on Equation (2) is plotted, meaning that drying of the inner pore structure starts around that time. Since a constant drying rate prevails after the EOF shrinkage, it can be assumed that drying takes place by capillary transport and solvent evaporates still from the film surface. Error bars for the solvent loading, especially at the beginning, are caused by the sensitive scale in combination with the low area weight used here. Still a linear regression could be used to fit the experimental data. The error bars of the temperature curves are prominent, especially during the heating-up phase. This can be explained by the data gained from the IR experiment, showing the dependency of the curve position of the thermocouple. The heat transfer coefficient that was adjusted at the Comb Nozzle dryer according to the TLC measurements was . Linear regression of the experimental drying curve results in a value of , as is shown in Table 4. A calculation using would lead to a drying rate of in the beginning, whereas a simulation using predicts a longer drying time due to a lower drying rate. Since the gravimetrically discerned heat transfer coefficient originates directly from the experimental data, only that value is used for further simulation and discussion. To account for the distribution of the heat transfer coefficient, the simulation was extended as described in the chapter “Model extension: Distribution of the heat transfer coefficient.” Based on the median value of the heat transfer coefficient derived from the experimental solvent loading , a distribution of the heat transfer coefficient in relation to its corresponding area fraction was determined, as shown in Figure 9.
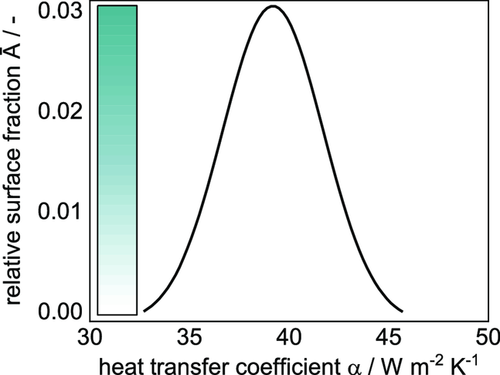
The intensity of the color bar in the graph hereby qualitatively represents the area proportion of the respective heat transfer coefficient. Using this α distribution, an array of curves for the decreasing solvent loading and the temperature over time was calculated, as shown in Figure 10. Color intensity again stands for the area proportion of each heat transfer coefficient and thus the resulting curve of solvent and temperature loading. From the array of solvent loadings and temperatures, the 2D simulation in form of the accumulated α distribution is derived. The experimental solvent loading can be described quite well by the calculation and lies well within the range of possible solvent loadings represented by the color intensity. The drying rate does not decrease at the EOF shrinkage according to the data shown here, thus a linear drying prevails.
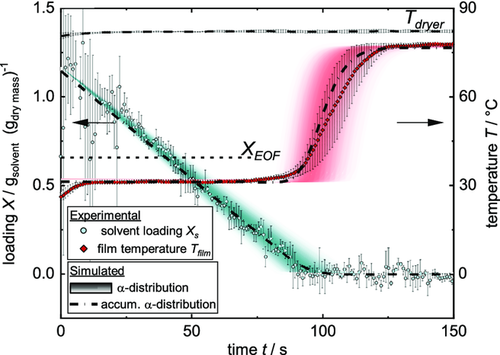
Temperature data are also in good agreement with simulation. The film stays at steady-state temperature until almost no solvent is present in the film, though a slight deviation between experiment and simulation is present, with the experimental temperature rising earlier. The fact that the simulated temperature rises at all before all solvent has evaporated can be attributed to the assumptions of the 2D model: since no lateral solvent flow is considered, patches of the film at the center of the air nozzles with the highest heat transfer coefficient will be dry earlier than patches with a lower heat transfer coefficient. The dry regions will start to warm up, whereas other regions remain at steady-state temperature. The overlay of these different drying curves leads to an earlier heating up, as shown for the curve of the accumulated α distribution in Figure 10. During the heating-up phase of the film, the simulated temperature curve lies well within the experimental error bars and it is able to clearly predict the equilibrium temperature of the film at the end of drying.
Since the weight measurement was global, resulting in an integral value for the change in weight, but the temperature measurement was a local one, a deviation would be expected as shown in the IR experiment. When comparing experimental gravimetric drying curves and the IR experiment, a difference in the drying temperature is present. Although the steady-state temperature is about 23 °C for the IR experiment, it is 30 °C for the gravimetric one, with the heat transfer coefficients being identical. This would be expected due to the different experimental conditions of the IR and the gravimetric experiment.
Since the temperatures are different, the question of the transferability of the results between IR and gravimetric experiment arises. Based on the results shown here, the appearance of hotspots can mainly be attributed to the distribution of the heat transfer coefficient which leads to simultaneously dry and still wet regions within the film that do not experience lateral solvent transport. The nonexistence of lateral solvent transport is therefore dependent on the heat transfer distribution and not on the temperature, which is why a transfer of the results to the gravimetric experiment seems to be justified.
4.3 Evaluation of Model Parameters
To evaluate the model, the influence of radiation from top and bottom, free convection, and conductive heat input from the dryer as well as Stefan and Ackermann correction factors are analyzed. All results are shown in Table 5. All listed values either refer to the equilibrium state of the wet film at the beginning of drying or are averaged values at the equilibrium state when the film is already dry. Both, Stefan and Ackermann correction factors have values close to 1 and can thus be neglected as a simplification.
| [] | K St | |||||
|---|---|---|---|---|---|---|
| 3.5 | 14.1 | 77.1 | 1981.1 | 1.031 | 0.989 | |
| −6.4 | −182.0 | 8.5 | 180.0 | 1 | 1 |
The heat flux evolvement during drying over time is also shown in Figure 11.
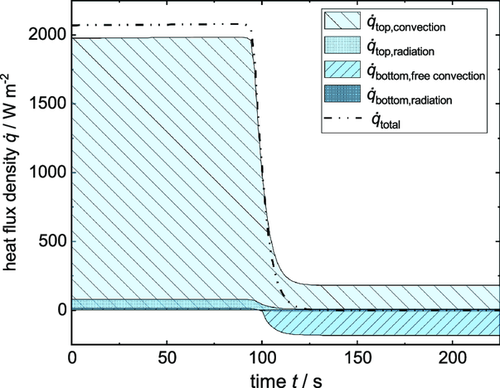
With the film being wet, all heat fluxes are ingoing, whereas the heat fluxes at the bottom change to outgoing when the film heats up and exceeds the temperature of the heating plate. With the chosen parameters of the drying experiment, the term of the heat flux density of free convection makes up 0.7% of the total heat flux density during drying. Only when the film is dry and its temperature rises to its turning point, the term of free convection gains in importance, meaning that the desired purpose of free convection being calculable but not influencing the drying process is fulfilled. What becomes clear furthermore, is that the term of the heat flux density of radiation from the bottom is negligible with a percentage of 0.2% compared to the overall heat flux. Radiation from the top accounts for 3.7% of the total heat flux density in the beginning and should therefore be considered.
4.4 Gravimetric Drying Curve Using a 1DModel
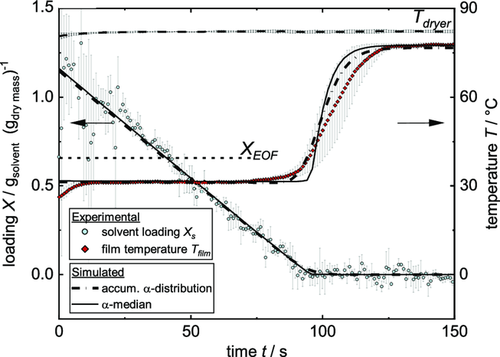
Since the 2D model requires complex calculation and data for the heat transfer coefficient distribution, a 1D model was applied using only the peak value of the gauss curve, being the median value of the distribution αmedian. Both simulations are compared in Figure 12. Concerning the solvent loading, the difference between 1D model and 2D model is marginal. The 1D model seems to predict the film drying of the last few seconds slightly better, since the accumulated curve shows a slight curvature that the data do not seem to have. The curvature in the 2D simulation can be attributed to the small area dried at low heat transfer coefficients that leads to an electrode that is not completely dry in all spots at that time. Since the error bars of the experiment exceed the difference between the curves of both models, it is not possible to judge which simulation is more suitable here. Regarding the temperature curve though, the 2D model gives a more accurate prediction than the 1D model. In the simulation using only αmedian, the film stays at steady-state temperature until no more solvent is present within the film. Only then the heating of the dry electrode and the substrate begins. The accumulated α distribution shows an earlier temperature increase compared to the curve with αmedian. This is due to the assumptions of no lateral solvent transport for the 2D model as explained earlier. Both models reflect the experimental start and end temperature of the film. Because the temperature curve during heating-up phase is subject to errors caused by the local thermocouple measurement, both models are suitable.
5 Conclusion
An experimental setup was introduced, which allows to record gravimetric drying curves in situ in terms of weight loss over time, accompanied by a temperature measurement. The investigated material system was a water-based particulate slurry, used as anode for lithium-ion batteries. Experimental drying curves were supplemented by a simulation for solvent loading and temperature over time. Since a stationary dryer has to be used for the gravimetric measurement, which excludes a moving substrate, the lateral distribution of the conductive heat transfer coefficient takes an important role regarding the drying process. To visualize the effect such a distribution might have, an experiment investigating the evolvement of the film temperature during drying using an IR camera was conducted. The existence of hotspots during drying and thus a temperature gradient within the film was verified, showing that a local measurement using a thermocouple might measure different temperature curves for the same film dependent on its position. To take this influence into account in the simulation, drying curves were calculated with a superposition of area-weighted values of the heat transfer coefficient (accum. α distribution). A distinct drying in the constant rate period was observed that was well described by the simulation. The steady-state temperature of the film prevailed until almost all solvent was removed, succeeded by the heating up of the film to the equilibrium temperature. Simulation and experiment agreed well in terms of start and end temperature, with the α distribution being able to give a range of possible curves for the experimentally determined local temperature measurement. To simplify simulation, a 1D model using a single value for the heat transfer coefficient (α median) was successfully applied and compared to the more complex 2D model. In summary, a test arrangement was introduced that can record the drying process in detail and allows to observe deviations from the theoretical expectations due to the supplemented simulation. In future investigations and to improve the experimental setup and homogenize drying, a slight movement of the dryer hood could be included. Furthermore, a detailed mechanistic investigation of drying behavior of electrode films with different thicknesses and its effect on validity of linear drying kinetics is planned.
Acknowledgements
The authors would like to thank the students involved in this work: S. Knaus, J. Knack, V. Francesconi, and C. Wachsmann. The authors acknowledge the financial support of the Federal Ministry of Education and Research (BMBF) within the cluster project “ProZell High Energy” under the reference number 03XP0073B. With this experimental setup, part of the fundamental research of this work was conducted and financed by German research foundation DFG GZ 1266/9-3. This work contributes to the research performed at the Center for Electrochemical Energy Storage Ulm-Karlsruhe (CELEST).
Conflict of Interest
The authors declare no conflict of interest.


