Fatty Acid Composition and Lipid Profile of Oral/Enteral Nutrition Supplements Available on the Brazilian Market
Abstract
Oral/enteral nutrition supplements enriched with fish oil are widely used for the recovery of the nutritional status of hospitalized patients, due to the omega-3 fatty acids content. However, they are targets of adulteration. This study evaluates the lipid quality of five brands of oral/enteral nutrition supplements incorporated with fish oil, available on the Brazilian market (Brazil, Holland, and Germany). The fatty acids are quantified by gas chromatography–flame ionization detection, and the lipid profile is acquired by direct electrospray ionization–mass spectrometry, to assess how fatty acids are present in those samples. The eicosapentaenoic acid (EPA) and docosahexaenoic acid (DHA) contents found ranged from 1.54 to 19.36% and 4.34 to 27.29%, respectively, in the form of triacylglycerols. However, brand 1 presents the lowest levels of EPA + DHA in its lipid composition, and in three brands, the addition of medium chain triglycerides is identified. The lipid quality assessment of these supplements allows an informed choice of appropriate supplements for the nutritional support of patients.
Practical Applications: The study highlights and provides information of the lipid composition and fatty acids of oral/enteral nutrition supplements enriched with fish oil, indicated for malnourished patients. The findings allow health professionals to make a more informed choice of oral/enteral nutrition for the adequate treatment of patients.
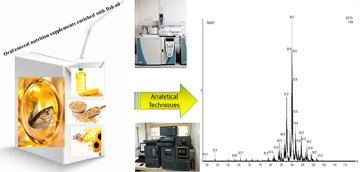
Fatty acids of five brands of oral/enteral nutrition supplements enriched with fish oil and available on the Brazilian market are quantified by gas chromatography–flame ionization detection, and the lipid profile is acquired by electrospray ionization–mass spectrometry. No lipid pattern among the samples is identified.
1 Introduction
Malnutrition affects ≈50% of hospitalized patients1 and it is classified as deficiency, excess, or imbalance of a wide range of nutrients,2 resulting in various clinical complications1 such as impairment of healing, impact on immune function, increased rates of postoperative infection,3 mortality, increased length of hospital stay, and high hospital costs.4
Precocious nutritional diagnosis and adequate nutritional therapy reduce complications associated with malnutrition.5 Nutritional support can be given orally (oral nutritional supplements), as well as through enteral nutrition (tube feeding) and parenteral nutrition,5, 6 which offer the possibility of increase or guarantee the adequate intake of nutrients in patients with insufficient oral food intake.7
Lipids are preferentially used as the main energy source in enteral diets due to their high caloric content.8 The most commonly used essential fatty acids are the polyunsaturated fatty acid (PUFA) omega-6 (n-6) linoleic acid (LA) and the omega-3 (n-3) α-linolenic acid (ALA).9 In the body, these fatty acids can be converted into longer derivatives, more unsaturated, which have important biological functions.10 LA is the metabolic precursor of arachidonic acid (ARA), while ALA is the metabolic precursor of eicosapentaenoic acid (EPA) and docosahexaenoic acid (DHA).8, 11, 12
Oral nutritional supplementation with n-3 PUFA reduced the symptoms of nutritional impact and improved the nutritional status of hospitalized patients.8 However, fish oil dietary supplements may contain fats and oxidized lipids,13 because fish oils usually go through an industrial deodorization process, in order to provide an odorless material used for functional foods or nutraceutical formulations.14 The geometry of the natural cis double bond can be transformed to the trans configuration during the deodorization process used in the food industry.15
In this way, the techniques traditionally used to evaluate the lipid quality, the fatty acid composition, the authenticity of fats and oils, as well as for the monitoring of lipid markers include gas chromatography–flame ionization detection (GC-FID) and direct infusion electrospray ionization–mass spectrometry (ESI-MS).16-18
Given the relevance of the subject, this study evaluated the content and quality of the n-3 present in five brands of oral/enteral nutritional supplements available on the Brazilian market, by determining the lipid profile and fatty acid composition of the samples, using ESI–MS and GC–FID, respectively.
2 Experimental Section
2.1 Samples
Five brands of liquid oral/enteral nutritional supplements incorporated with fish oil (one from Brazil, three from Holland, and one from Germany) were acquired at the local market in the city of Maringa (Parana, Brazil). Table 1 shows the information provided by the manufacturer (on the label), including the country of origin, the lipid source, and amounts of EPA, DHA, omega-6 (n-6) and n-3 per 100 mL of sample. The samples were kept in sealed tubes in a freezer at −20 °C.
| Oral enteral nutrition supplements | Country of origin | Indication | Sources of lipids | Total fat | Trans fat | SFA | MUFA | PUFA | EPA | DHA | EPA + DHA | W6:W3 |
|---|---|---|---|---|---|---|---|---|---|---|---|---|
| 1 | Brazil | Oncology | 67% fish oil 19% MCT 12% corn oil 2% soy lecithin | 2.8 | 0 | 1.3 | – | – | – | – | – | – |
| 2 | Holland | Oncology | 43% fish oil 24% MCT 21% safflower oil 12% high oleic sunflower oil | 6.7 | 0 | 2.8 | 1.6 | 2.3 | – | – | 0.071 | 1.5:1 |
| 3 | Holland | Oncology | 44.1% fish oil 42.6% corn oil 13.3% canola oil | 5.6 | 0 | 1 | 1.58 | 3.01 | 0.6 | 0.29 | – | 1.2:1 |
| 4 | Holland | Oncology | 65% fish oil 16.2% MCT 9.3% canola oil 5.5% soy oil 4% lecithin | 2.4 | 0 | 0.7 | 0.5 | 1.2 | 0.45 | 0.21 | 0.66 | 0.3:1 |
| 5 | Germany | Oncology | 100% fish oil | 3.4 | 0 | 1.2 | 0.7 | 1.5 | 0.24 | 0.96 | 1.2 | 0.18:1 |
- SFA, total saturated fatty acid; MUFA, total monounsaturated fatty acid; PUFA, total polyunsaturated fatty acid; EPA, eicosapentaenoic acid; DHA, docosahexaenoic acid; MCT, medium chain triacylglycerols.
2.2 Fatty Acid Composition by GC–FID
The total lipids (TL) were extracted and determined according to Folch et al.19 The fatty acid derivatization to fatty acid methyl esters (FAME) was carried out using the method described by Hartman and Lago20 and modified by Maia and Rodriguez-Amaya.21 Approximately 100.0 mg of the extracted lipid was weighed in a test tube and added with 4.0 mL of NaOH/MeOH 0.50 mol L−1; the tube was heated in a boiling water bath for 5.0 min with subsequent cooling in running water. 5.0 mL of esterifying reagent (NH4Cl/H2SO4/MeOH) was added to the tube; it was again heated in water bath for 5.0 min and cooled in running water. After, 4.0 mL of saturated NaCl solution and 2.0 mL of hexane were added. Then, the tubes were vigorously shaken for 30 s. After phase separation, the upper phase was collected for injection into GC.
The FAME chromatographic analyzes adopted the procedures detailed by Figueiredo et al.22 and da Silveira et al.18 Experiments were carried out using a Thermo Scientific gas chromatograph (Waltham, USA) equipped with a flame ionization detector, split/splitless injector, and a CP-7420 fused silica capillary column (Select FAME, 100.0 m long, 0.25 mm internal diameter, and 0.25 μm thin film of cyanopropyl as stationary phase). The operating parameters were as follows: temperature programmed at 165 °C for 18 min, then heated to 235 °C (4 °C min−1) for 20 min; injection port 230 °C; detector port 250 °C; carrier gas (H2) at a flow rate of 1.2 mL min−1; make-up gas (N2) at a flow rate of 30 mL min−1; H2 and synthetic air used for the detector flame, at flow rates of 30 and 300 mL min−1, respectively; sample injection volume 1.0 µL; split ratio 1:40. FAME were identified by comparison of the retention times among the constituents of the samples relative to analytical standards (FAME Mix, C4–C24, Sigma–Aldrich, St. Louis, USA). Relative percentages of the total fatty acids were determined automatically by ChromQuest 5.0 software (Waltham, USA).
2.3 Lipid Profiles by ESI–MS
The lipid profiles of the supplements TL were obtained via direct ESI–MS. Samples were prepared based on da Silveira et al.18 as follows: 50.0 µL of the lipid material was diluted with 950.0 µL of chloroform (Synth, São Paulo, Brazil), and 5.0 µL of this solution was diluted with 1.0 mL of methanol/chloroform 9:1 (v/v) (high-performance liquid chromatography grade, JT Baker, USA) and 20.0 µL of 0.10 mol L−1 ammonium formate (prepared in methanol). This final solution was directly infused into a triple quadrupole mass spectrometer (Xevo-TQD, Waters, Milford, MA, USA) equipped with a Z-spray (Waters) ESI source, operating in positive ion mode (ESI +). The lipid profiles were acquired from 100 to 1200 m/z, under the following conditions: capillary and cone voltages of 3.00 kV and 20.00 V, respectively; source temperature 150 °C; desolvation temperature 200 °C; desolvation gas (high purity N2) at a flow rate of 500 L h−1.
2.4 Statistical Analysis
All analyses were carried out in triplicate, and the results (mean ± standard deviation) were submitted to one-way analysis of variance at the 5% significance level using GraphPad Prism v. 5.0 software (San Diego, USA). The mean values of the chemical and fatty acid composition of the oral/enteral nutrition diets were compared by Tukey's test.
3 Results and Discussion
3.1 Fatty Acid Composition by GC–FID
Oral/enteral nutrition supplements incorporated with n-3 are widely used in clinical research in hospitalized patients; however, those studies use label values or product data sheets as a reference for the prescription of the n-3, EPA, and DHA in the patients' diets,8, 23-27 being pioneer in the evaluation by analytical methods in the lipid composition of enteral diets. This study evaluated all samples with addition of fish oil available in the Brazilian market.
Several studies show that the lipid quality of industrialized products can be evaluated through the quantification of the fatty acids.16-18, 28 In the present work, 15 fatty acids were quantified in the lipid material extracted from the oral/enteral nutrition supplements (samples 1–5), and the results are presented in Table 2.
| Samples | |||||
|---|---|---|---|---|---|
| Fatty acid [%]1 | 1 | 2 | 3 | 4 | 5 |
| 8:0, (Cy)2 | 26.03 ± 0.02a | 12.11 ± 0.01b | N.D. | 13.71 ± 0.06c | N.D. |
| 10:0, (C)2 | 22.01 ± 0.02a | 11.07 ± 0.02b | N.D. | 10.48 ± 0.05c | N.D. |
| 14:0, (M)2 | 1.54 ± 0.05a | 3.87 ± 0.07b | 3.39 ± 0.01c | 4.84 ± 0.02c | 5.20 ± 0.05c |
| 16:0, (P)2 | 11.30 ± 0.09a | 12.68 ± 0.09a | 10.49 ± 0.02b | 7.20 ± 0.07c | 21.97 ± 0.2d |
| 16:1n-7, (Po)2 | 1.60 ± 0.04a | 4.12 ± 0.04b | 5.29 ± 0.09c | 7.28 ± 0.05c | 7.53 ± 0.03c |
| 18:0, (S)2 | 2.44 ± 0.02a | 1.16 ± 0.07b | 2.46 ± 0.07b | 2.15 ± 0.03b | 4.22 ± 0.15c |
| 18:1n-9, (O)2 | 12.02 ± 0.01a | 18.74 ± 0.3b | 24.59 ± 0.04b | 11.94 ± 0.02a | 14.44 ± 0.05b |
| 18:1n-7, (V)2 | 0.95 ± 0.01a | 1.65 ± 0.06b | 1.96 ± 0.07b | 2.04 ± 0.07c | 2.36 ± 0.07d |
| 18:2n-6 LA, (L)2 | 13.13 ± 0.06a | 19.69 ± 0.02b | 28.17 ± 0.03b | 7.53 ± 0.08c | 4.87 ± 0.08d |
| 18:3n-3 ALA, (Ln)2 | 0.69 ± 0.02a | 0.41 ± 0.09b | 2.08 ± 0.06c | 2.23 ± 0.04d | 0.65 ± 0.05d |
| 18:3n-6, (γLn)2 | 0.41 ± 0.07a | 1.67 ± 0.07a | 2.45 ± 0.02a | 3.16 ± 0.02a | 1.63 ± 0.03a |
| 20:0, (A)2 | 0.49 ± 0.02a | 0.51 ± 0.07a | 0.70 ± 0.09a | 0.54 ± 0.09a | 1.95 ± 0.06a |
| 20:5n-3 EPA, (Ep)2 | 1.67 ± 0.05ª | 8.65 ± 0.09b | 12.89 ± 0.07c | 19.23 ± 0.08c | 7.62 ± 0.09b |
| 22:5n-3 DPA, (Dp)2 | 0.43 ± 0.01a | 0.77 ± 0.01a | 1.14 ± 0.06c | 1.29 ± 0.09a | 1.68 ± 0.10a |
| 22:6n-3 DHA, (D)2 | 5.29 ± 0.01a | 2.90 ± 0.08b | 4.39 ± 0.2c | 6.38 ± 0.12d | 25.88 ± 0.12e |
| n-6 | 13.54 ± 0.13a | 21.36 ± 3.07b | 30.62 ± 0.05c | 10.69 ± 0.29a | 6.50 ± 0.11d |
| n-3 | 8.08 ± 0.09a | 12.73 ± 1.14b | 20.50 ± 0.21c | 29.13 ± 0.33d | 35.83 ± 0.36e |
| n-6/n-3 | 1.67 ± 0.05a | 1.67 ± 0.13b | 1.49 ± 0.11c | 0.36 ± 0.01d | 0.18 ± 0.01e |
| SFA | 63.81 ± 0.22a | 41.40 ± 0.33b | 17.04 ± 0.19c | 38.92 ± 0.32d | 33.34 ± 0.46e |
| MUFA | 14.57 ± 0.06a | 24.51 ± 0.13b | 31.84 ± 0.20c | 21.26 ± 0.14d | 24.33 ± 0.15e |
| PUFA | 21.62 ± 0.22a | 34.09 ± 0.36b | 51.12 ± 0.42c | 39.82 ± 0.43d | 42.33 ± 0.47e |
| PUFA/SFA | 0.33 ± 0.01a | 0.82 ± 0.17b | 3.00 ± 0.27c | 1.02 ± 0.01d | 1.26 ± 0.01e |
| PUFA/MUFA | 1.48 ± 0.07a | 1.39 ± 0.15a | 1.60 ± 0.14b | 1.87 ± 0.08c | 1.73 ± 0.03b |
- 1Results expressed as means ± S.D. (standard deviation) of three replicates. Values with different lowercase letters in the same line are significantly different (p < 0.05) by Tukey's test.
- 2The abbreviation of each fatty acid used in TAG abbreviations; N.D., not detected; SFA, total saturated fatty acid; MUFA, total monounsaturated fatty acid; PUFA, total polyunsaturated fatty acid; n-6, total omega-6 fatty acid; LA, linoleic acid; ALA, α-linolenic acid; EPA, eicosapentaenoic acid; DHA, docosahexaenoic acid; DPA, docosapentaenoic acid.
The commercialized diets, according to the product label (Table 1), did not present a uniform model of ingredients, as well as the amount of lipids and fatty acids in their composition. No diet was similar to another, although all had fish oil addition and were indicated for the same types of patients. According to the data in Table 2, sample 1 (Brazilian origin) had the worst fatty acid composition, highlighting the low sum of EPA, high levels of total saturated fatty acid (SFA), and low levels of total monounsaturated fatty acid (MUFA) and total PUFA. These values may be related to the lipid composition of sample 1, which comprised 19% medium-chain triacylglycerols (MCT), 12% corn oil, and 2% soy lecithin (Table 1).
Sample 2 (Holland origin) was low in DHA and high in LA and SFA because this sample was composed of 33% safflower/sunflower oils (Table 1), which have mainly LA in their composition.29 Sample 3 (Holland origin) was shown to contain low levels of SFA, and high levels of LA, oleic acid (18:1n-9), EPA, and DHA, indicating the concentration of n-3 fatty acids during the fish oil industrialization process.30 Sample 5 (Germany origin) presented the best sum of EPA + DHA (Table 3). In addition, through the information presented on the labels (Table 1), sample 5 was the only diet with exclusively fish oil as the lipid source. Samples 1–4 included several types of other oils on their composition, such as corn, canola, soybean, and safflower oils.
| Oral enteral nutrition sample | EPA/DHA ratio | EPA + DHA [%] |
|---|---|---|
| 1 | 0.22 ± 0.26 | 8.39 ± 0.105 |
| 2 | 1.32 ± 9.77 | 10.11 ± 3.45 |
| 3 | 2.51 ± 5.38 | 27.05 ± 1.38 |
| 4 | 2.97 ± 3.84 | 24.16 ± 0.228 |
| 5 | 0.31 ± 1.51 | 35.78 ± 0.518 |
- EPA, eicosapentaenoic acid; DHA, docosahexaenoic acid.
Lipids are used in oral/enteral nutrition supplements, enteral nutrition (tube feeding), and parenteral nutrition mainly because of their high caloric content, providing a good concentrated source of energy,31 and decreasing the amount of carbohydrate that needs to be provided as part of the nutritional support. However, the length of the fatty acid chain and the presence, number, and position of the double bonds affect the physical, physiological, and functional properties of the fatty acid.32 Thus, different types of fatty acids can differentially influence several different physiological processes, such as metabolism, inflammation, immune response, oxidative stress, blood coagulation, organ function, and wound healing.6, 8, 31, 33
As shown in Table 2, caprylic acid (8:0) was most abundant in sample 1 (26.79%), followed by samples 2 (14.31%) and 4 (13.44%), whereas, it was not detected in samples 3 and 5. Capric acid (10:0) showed a similar trend: Sample 1 (23.18%) > 2 (16.08%) ≌ 4 (14.26%), and none detected in samples 3 and 5.
The fact that the caprylic acid (8:0) and capric acid (10:0) were present only in samples 1, 2, and 4 (including at high percentages) can be explained by the addition of MCT in these oral/enteral nutrition supplements, as described in Table 1.34, 35 The main benefits of MCT in hospitalized patients are increased absorption and metabolism, body weight and appetite control, and increased immunity.36, 37
Myristic acid (14:0) was found in the least (1.59%) and greatest (5.57%) proportions in samples 1 and 4, respectively, with intermediate values for sample 5 (5.36%) > 3 (4.86%) > 2 (2.97%). For palmitic acid (16:0), the lowest (6.76%) and highest amounts (23.00%) belonged to samples 4 and 5, respectively, with intermediate values for sample 2 (12.02%) > 1 (10.91%) > 3 (8.92%). The stearic acid (18:0) levels decreased in the order of sample 5 (4.71%) > 4 (3.72%) > 2 (3.27%) > 3 (3.01%) > 1 (2.48%).
There is strong evidence that high intakes of myristic (14:0) and palmitic (16:0) SFA increase total cholesterol, low-density lipoprotein, blood clotting, inflammation, and insulin resistance and, consequently, impair the metabolic state of hospitalized patients.31
Monounsaturated oleic acid (18:1n-9) was least (10.47%) and most abundant (21.56%) in samples 4 and 3, respectively, while sample 2 (15.93%) contained more than samples 5 (15.27%) and 1 (11.90%).
Unsaturated fatty acids have been widely recognized as inducers of apoptosis in several cell lines and demonstrate an inhibitory effect on the proliferation of malignant cells.38 For instance, the beneficial effects of oleic acid on the transcription factors involved in lipid homeostasis, leading to a reduction of cardiovascular disease and inflammation, were observed when SFA were replaced with oleic acid.31 It is noteworthy that sample 1 presented a high concentration of SFA and low concentration of MUFA, while sample 3 presented a high concentration of MUFA and low concentration of SFA (Table 2).
The PUFAs LA and ALA display several effects on the immune and inflammatory response of hospitalized patients.32 At sufficiently high intakes, long-chain n-3 PUFAs decrease lymphocyte proliferation, antibody and cytokine production, the expression of adhesion molecules and the activation of natural killers.8 However, n-6 PUFAs have both inhibitory and stimulatory effects on the immune response.39 LA is the metabolic precursor of ARA while ALA is the metabolic precursor of EPA and DHA. The absence of lipids in artificial nutritional support can result in the appearance of a deficiency of essential fatty acids.8
The lowest (5.79%) and highest (18.68%) LA concentrations were found in samples 5 and 3, respectively. Sample 2 contained more LA (16.77%) than samples 1 (11.49%) and 4 (7.37%). The ALA contents decreased in the order of sample 3 (3.27%) > 4 (2.44%) > 2 (1.21%) > 1 (0.64%). It was not detected in sample 5.
In the western population, LA is often ingested in the form of vegetable oils.9 Total fat intake and the proportion of n-6/n-3 in the western diet have increased significantly since the Industrial Revolution.12 The average consumption of n-3 ALA is 1.3 g day−1 for American women; however, this is only about 1/10 of the daily consumption of 13–15 g day−1 of n-6 LA.9
In the analyzed samples, EPA was found in decreasing amounts in sample 3 (19.36%) > 4 (18.08%) > 5 (8.49%) > 2 (5.77%) > 1 (1.54%). A different trend was seen for DHA: sample 5 (27.29%) > 3 (7.69%) > 1 (6.85%) > 4 (6.08%) > 2 (4.34%).
Lipids play an important role in hospitalized treatment, and it is believed that the relative amounts and types of dietary lipids consumed are critical.12 In our study, there is no pattern of lipid quantity and quality among the samples, which can result in the low consumption of essential fatty acids and, consequently, the reduction of the inflammatory responses in critical patients.5
The n-6/n-3 ratio of the samples ranged from 0.16 (sample 5) to 1.47 (sample 2). This result is related to the lipid source used in the formulation of diets (Table 1). The n-3 fatty acids are competitive antagonists of the n-6 precursor ARA and are converted into less active pro-inflammatory mediators.31
The n-3 fatty acids have been demonstrated to improve appetite and body weight in critical patients.33 Although the optimal total ratio of n-3/n-6 has not been defined yet, a ratio approaching 1:1 or 1:2, similar to that of pre-civilized man, is generally accepted and desirable, based on its association with a low incidence of chronic inflammatory diseases. Today, the consumption of n-3/n-6 in the diet is 1:10 or less, largely due to the >1000-fold increase in the use of soybean oil in recent decades.9
The chromatograms with peak identification of five brands of oral/enteral nutritional supplements (Figure 1) were obtained by GC-FID ChromQuest 5.0 software and there were no overlaps in the geometric forms of the cis double bonds of the samples. In addition, the chromatogram of each sample is available as an individual pdf file in the Supporting Information.

3.2 EPA/DHA Ratio and Sum of EPA + DHA
In general, it is believed that the consumption of n-3 fatty acids EPA and DHA can positively modulate inflammation, oxidative stress, and metabolic disorders of critical patients.5, 28 The relative amounts of EPA and DHA in the diet may potentiate its benefits, but it is suggested that the best health outcomes relate to the use of EPA:DHA (1:1) balanced supplements instead of higher amounts of DHA or EPA.
The EPA/DHA ratio and the EPA + DHA sum (%) of the samples are shown in Table 3. From the results, it can be observed that the EPA/DHA ratios for all the oral nutritional supplements varied from 0.22 to 2.97; this information is not present on the labels of the supplements. Also, the sum of EPA + DHA of the lipid material present in the supplements ranged from 8.39% (sample 1) to 35.78% (sample 5). The major problem with oral/enteral nutrition supplements enriched with n-3 fatty acids is the lack of adequate labeling information for the proper prescription and supplementation of EPA and DHA for patients.
Sample 1 presented 67% of fish oil in its composition (Table 1), but only 8.39% EPA + DHA. It is worth noting that this sample is Brazilian and showed high levels of SFA, and low concentrations of MUFA, PUFA, EPA, and EPA + DHA. Sample 3 had 44% of fish oil (Table 1) and 27.05% EPA + DHA, in addition to high concentrations of MUFA, PUFA, EPA, DHA, EPA + DHA, and a low concentration of SFA.
3.3 ESI–MS
Oncological patients present several gastrointestinal alterations resulting from chemotactic treatment or radiotherapy, which interfere with the absorption of nutrients.40 Therefore, it is important to know the bioavailability of the nutrients consumed by these patients.
The lipid functional properties are related to the fatty acid composition, as well as their arrangement in the triacylglycerol (TAG) molecule.41 However, the fatty acid analysis by GC-FID does not provide information on how the fatty acids are arranged in order to form TAG molecules of the lipid material.
Therefore, the TAG profiles of the oral/enteral nutrition samples were acquired by ESI–MS. Figure 2 shows the TAG profile of each sample in the region between 480 and 1200 m/z, and, for better visualization, the zoom of the 700–1200 m/z region of each sample. Additionally, the spectrum of each sample is available as an individual .pdf file in the Supporting Information.

Table 4 shows the main and major important TAG identified from the ESI–MS lipid profiles of the oral/enteral nutrition samples, based on the LAMES platform. The possible TAGs are expressed in relative percentages, and the most intense ion peak in each mass spectrum was designated as 100%. Besides, in Table 4, each TAG represents the three fatty acids in its structure, regardless of the position of each fatty acid in the TAG molecule.
| Relative abundances [%] | ||||||||
|---|---|---|---|---|---|---|---|---|
| [TAG+NH4]+ | 1 | 2 | 3 | 4 | 5 | Composition | CN/DBa | TAGb |
| 488 | 57.0 | 55.7 | – | 57.2 | – | C27H50O6 | 24:0 | CyCyCy |
| 516 | 100.0 | 100.0 | – | 100.0 | – | C29H54O6 | 26:0 | CCyCy |
| 544 | 49.4 | 51.7 | – | 51.3 | – | C31H58O6 | 28:0 | CCyC |
| 572 | 7.4 | 9.1 | – | 8.1 | – | C33H62O6 | 30:0 | CCC |
| 840 | 0.1 | 1.3 | 12.7 | 3.4 | 13.3 | C53H90O6 | 50:6 | MLnLn – MDM – MEpPo |
| 848 | 0.7 | 1.2 | 10.9 | 0.7 | 31.8 | C53H98O6 | 50:2 | MOV - MVV - SPoPo - PLP - SLM - MOO - PPoV - PPoO |
| 866 | 0.2 | 1.0 | 13.0 | 3.4 | 20.3 | C55H92O6 | 52:7 | MDPo - MEpL |
| 868 | 0.6 | 2.1 | 14.6 | 3.6 | 48.0 | C55H94O6 | 52:6 | PLnLn- PγLnLn - PoLnL- PEpPo – MDP – MDpPo – MepV – MEpO - PγLnγLn |
| 870 | 0.5 | 1.9 | 7.3 | 1.8 | 31.2 | C55H96O6 | 52:5 | PoLL – SEpM – MDpP – PepP - PγLnL |
| 872 | 1.8 | 3.6 | 47.7 | 1.9 | 17.5 | C55H98O6 | 52:4 | PLL - OLPo - SLnPo – SγLnPo - PLnV - VLPo - PLnO |
| 874 | 1.9 | 2.0 | 45.9 | 2.2 | 19.2 | C55H100O6 | 52:3 | PLO - SLnP - OPoV - VPoV - OPoO - PLV – SLPo – ALnM - AγLnM |
| 876 | 1.4 | 2.0 | 12.2 | 1.9 | 31.5 | C55H102O6 | 52:2 | POO - ALM - POV - SPoV - PVV - SOPo - SLP - APoPo |
| 878 | 0.6 | 1.1 | 6.9 | 1.0 | 17.1 | C55H104O6 | 52:1 | SVP - SPoS - AOM - APoP - AVM - SOP |
| 894 | 0.9 | 1.4 | 18.4 | 3.8 | 59.1 | C57H96O6 | 54:7 | MDV - MDO - MDpL - PDPo - PEpL - VEpPo - VLnLn - VγLnLn - VγLnγLn - OEpPo - OLnLn - OγLnLn - OγLnγLn - PoDpPo - LLnL - LγLnL |
| 896 | 3.3 | 11.7 | 75.0 | 4.9 | 88.6 | C57H98O6 | 54:6 | SDM - SEpPo - SLnLn - SγLnLn - SγLnγLn - MDpV - MDpO - PDP - PEpV - PEpO - PDpPo - VLnL - VγLnL - OLnL - OγLnL - LLL |
| 898 | 3.5 | 6.8 | 100.0 | 5.0 | 47.6 | C57H100O6 | 54:5 | AEpM - SDpM - SEpP - SLnL - SγLnL - PDpP - VLnV - VγLnV - VLnO - VγLnO - VLL - OLnO - OγLnO - OLL |
| 900 | 2.6 | 3.2 | 73.6 | 4.7 | 18.7 | C57H102O6 | 54:4 | LnPo - AγLnPo - SLnV - SγLnV - SLnO - SγLnO - SLL - VLV - VLO - OLO |
| 902 | 1.5 | 7.1 | 54.5 | 6.2 | 14.1 | C57H104O6 | 54:3 | ALnP - AγLnP - ALPo - SLnS - SγLnS - SLV - SLO - VVV - VOV - VOO - OOO |
| 904 | 0.8 | 4.4 | 33.4 | 3.6 | 16.4 | C57H106O6 | 54:2 | ALP - APoV - APoO - SLS - SVV - SOV - SOO |
| 914 | 0.1 | 1.2 | 22.4 | 4.4 | 13.8 | C59H92O6 | 56:11 | MDEp - PoEpEp - LnEpLn - LnEpγLn - γLnEpγLn |
| 916 | 0.3 | 1.7 | 25.3 | 5.3 | 26.9 | C59H94O6 | 56:10 | MEpDp - PEpEp - PoDLn - PoDγLn - LEpLn - LEpγLn |
| 918 | 0.3 | 1.1 | 14.3 | 3.2 | 23.4 | C59H96O6 | 56:9 | PDLn - PDγLn - VEpLn - VEpγLn - OEpLn - OEpγLn - PoDL - PoDpLn - PoDpγLn - LEpL |
| 920 | 0.5 | 0.7 | 8.2 | 1.5 | 38.1 | C59H98O6 | 56:8 | SEpLn - SEpγLn - PDL - PDpLn - PDpγLn - VDPo - VEpL - ODPo - OEpL - PoDpL |
| 922 | 1.4 | 1.0 | 7.5 | 1.7 | 100.0 | C59H100O6 | 56:7 | SDPo - SEpL - PDO - PDV - PDpL - OEpO - OEpV - ODpPo - VEpV - VDpPo |
| 924 | 0.9 | 0.9 | 4.5 | 0.9 | 59.1 | C59H102O6 | 56:6 | ADM - AEpPo - ALnLn - AγLnLn - AγLnγLn - SDP - SEpV - SEpO - SDpPo - PDpV - PDpO |
| 926 | 0.4 | 0.5 | 3.7 | 0.7 | 30.2 | C59H104O6 | 56:5 | ADpM - AEpP - ALnL - AγLnL - SEpS - SDpP |
| 942 | 0.6 | 1.2 | 18.5 | 4.5 | 45.5 | C61H96O6 | 58:11 | MDDp - PDEp - VEpEp - OEpEp - PoEpDp - LDLn - LDγLn - LnDpLn - LnDpγLn - γLnDpγLn |
| 948 | 0.4 | 0.4 | 4.5 | 0.8 | 32.6 | C61H102O6 | 58:8 | AEpLn - AEpγLn - SDL - SDpLn - SDpγLn - VDV - VDO - VDpL - ODO - ODpL |
| 950 | 0.6 | 0.4 | 3.0 | 0.6 | 38.9 | C61H104O6 | 58:6 | ADP - AEpO - AEpV - ADpPo - SDS - SDpO - SDpV |
| 968 | 1.1 | 0.7 | 11.6 | 2.5 | 91.0 | C63H98O6 | 60:12 | PDD - ODEp - VDEp - PoDDp - LEpDp |
| 970 | 0.8 | 0.7 | 8.3 | 1.8 | 56.3 | C63H100O6 | 60:11 | SDEp - PDDp - OEpDp - VEpDp - PoDpDp |
| 994 | 0.6 | 0.4 | 4.0 | 1.0 | 35.9 | C65H100O6 | 62:13 | ODD - VDD - LDDp - LnDpDp - γLnDpDp |
| 996 | 0.5 | 0.2 | 3.2 | 0.8 | 38.3 | C65H102O6 | 62:12 | SDD - ODDp - VDDp - LDpDp |
- aCarbon number/number of double bounds of the three fatty acid moieties.
- bC, capric acid (10:0); Cy, Caprylic acid (8:0); A, arachidic acid (20:0); D, docosahexaenoic acid (DHA, 22:6n-3); Dp, Docosapentaenoic acid (DPA, 22:5n-3); Ep, Eicosapentaenoic acid (EPA, 20:5n-3); L, linoleic acid (LA, 18:2n-6); Ln, α-linolenic acid (ALA, 18:3n-3); γLn, γ-linolenic acid (18:3n-6); M, mystirc acid (14:0); O, oleic acid (18:1n-9); P, Palmitic acid (16:0); Po, Palmitoleic acid (16:1); S, Stearic acid (18:0); V, vacenic acid (18:1n-7).
From the ESI–MS results, the lipid profiles of the samples 1, 2, and 4 showed higher intensities of the TAG CyCyC (516 m/z), CyCyCy (488 m/z), CyCC (544 m/z), and CCC (572 m/z); where Cy represents caprylic acid (8:0) and C denotes capric acid (10:0). These TAG were provided by the MCT ingredient incorporated in supplements 1, 2, and 4 (information disposed on the diet label). The MCT, which is mostly composed by the 8:0 and 10:0 fatty acids, has been added in diets destined to patients with disturbances of digestion and absorption, due to its advantages of bioavailability and ease of absorption.42
The MCT was not found in the lipid profile of samples 3 and 5, and the results for those samples were compatible with the fatty acid compositions determined by GC–FID (Table 2) since the 8:0 and 10:0 fatty acids were not present. Besides, the MCT ingredient was declared to be absent according to the label of those samples.
Supplements based on fish oil generally provide EPA and DHA in the form of TAG or ethyl esters of fatty acids (EE).43 However, EPA and DHA in TAG form are more bioavailable and less susceptible to lipid oxidation in comparison with those in EE form.44 In this sense, it is highly relevant to know how EPA and DHA are present in oral/enteral nutrition designated for cancer patients. Among the brands analyzed, none of the samples provided this information on the label.
From Figure 2, it is possible to observe the region from 700 to 1200 m/z of the samples mass spectra, which includes those TAG containing EPA and DHA fatty acids.16 It was evident that all samples had EPA and DHA in TAG form, and Table 4 summarizes those possible TAG.
Based on the ESI–MS results, sample 5 presented the highest abundance of TAG composed with EPA and DHA in their structure, such as the SDPo, SEpL, PDO, PDV, PDpL, OEpO, OEpV, ODpPo, VEpV, VdpPo, PDD, ODEp, VDEp, PoDDp, LEpDp which were present in low levels in samples 1–4. In these TAG abbreviation, the letters and their representative fatty acids are as follows: D: DHA, 22:6n-3; Ep: EPA, 20:5n-3); M: myristic acid, 14:0; O: oleic acid, 18:1n-9; P: palmitic acid, 16:0, Po: Palmitoleic acid, 16:1; S: stearic acid, 18:0; Dp: DPA, 22:5n-3; L: LA, 18:2n-6; V: vaccenic acid, 18:1n-7.
4 Conclusions
This work evaluated the lipid quality of five brands of oral/enteral nutrition supplements enriched with fish oil and available on the Brazilian market. From the GC–FID data, it was possible to identify 15 fatty acids in samples 1, 2, and 4, and 13 fatty acids in samples 3 and 5. The sum of the n-3 fatty acids EPA and DHA varied among the samples in the range of 8.39–35.78%. Besides, among the five samples, three were exclusively sources of the 8:0 and 10:0 fatty acids, as a result of the addition of the MCT ingredient. Based on the ESI–MS results, it was observed that the fatty acids of the five samples were present in TAG form. The lipid of the samples did not present a pattern of quality; however, all the samples are indicated to assist in the nutritional recovery of hospitalized patients. Thus, the assessment of the lipid quality of the oral/enteral nutrition supplements by analytical methods are valuable since the identification and quantification of the fatty acids present in those supplements assist the choice of a supplement for the adequate treatment of hospitalized patients.
Abbreviations
PUFA, polyunsaturated fatty acids; EPA, eicosapentaenoic acid; DHA, docosahexaenoic acid;DPA, docopentahexaenoic acid; SFA, saturated fatty acid; MUFA, monounsaturated fatty acid; MCT, medium-chain triacylglycerols; LA, linoleic acid; n-6, omega-6; n-3, omega-3; ALA, α-linolenic acid; ARA, arachidonic acid; TAG, triacylglycerol; EE, ethyl esters of fatty acids.
Acknowledgments
The authors would like to thank Coordenação de Aperfeiçoamento de Pessoal de Nível Superior (CAPES); Fundação Araucária de Apoio ao Desenvolvimento Científico e Tecnológico do Estado do Paraná (FAPPR); and Conselho Nacional de Desenvolvimento Científico e Tecnológico (CNPq) for their financial support and fellowships.
Conflict of Interest
The authors declare no conflict of interest.