RNAi screen for kinases and phosphatases that play a role in antigen presentation by dendritic cells
Abstract
Effective CD8+ T-cell responses against tumor or microbial antigens that are not directly expressed in antigen-presenting cells (APCs) depend on the cross-presentation of these antigens on MHC class I in APCs. To identify signaling molecules that regulate cross-presentation, we used lentiviral-based RNA interference to test the roles of hundreds of kinases and phosphatases in this process. Our study uncovered eight previously unknown genes, consisting of one positive and seven negative regulators of antigen cross-presentation. Depletion of Acvr1c, a type I receptor for TGF-β family of signaling molecules, led to an increase in CD80 and CD86 co-stimulator surface expression and secreted IL-12 in mouse bone marrow-derived DCs, as well as antigen-specific T-cell proliferation.
Introduction
The generation of cytotoxic T lymphocytes (CTLs) against tumor antigens of nonhematopoietic origin or viral agents that do not infect antigen-presenting cells (APCs) can be elicited in a process known as antigen cross-presentation 1. Furthermore, the importance of this process in vivo during infection and in therapeutically generating antitumor immunity has now been established 2.
Antigen cross-presentation remains poorly characterized at the molecular level. In particular, unbiased studies have not been used to dissect the process, with the exception of the work of Zou et al. 3 who used siRNAs to probe the role of 57 Rab GTPases. While they identified 12 genes that affect cross-presentation, including the GTPase Rab3b/3c, further validation in vivo is still needed to validate these findings.
To study this process, we used an arrayed library of shRNA-expressing lentiviruses to silence 691 genes (with ∼5 shRNAs targeting each gene) in DCs and identified eight genes that affect antigen cross-presentation by mouse bone marrow-derived dendritic cells (BMDCs). We also describe the initial characterization of one of the validated hits, Acvr1c, a receptor for the TGF-β family of signaling molecules.
Results and discussion
To identify genes involved in cross-presentation, we applied an shRNA-based genetic screening approach 4-6 to identify signaling components and pathways in DCs that play a role in cross-presentation to primary CD8+ T cells. We mostly targeted kinases and phosphatases because they are part of most regulatory pathways and can often be inhibited with small molecules. In fact, the definition of constriction points within signaling pathways has been a successful approach when analyzing biological complexity and that these constriction points, more often than not, materialize in kinases and phosphatases.
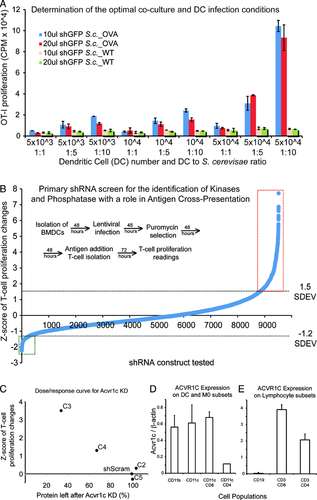
We started by developing an in vitro assay to measure antigen cross-presentation by mouse BMDCs after infection with the TRC shRNA-expressing lentivirus. C57BL/6 mice were used as donors for BMDCs. We chose to use OVA-expressing yeast (Saccharomyces cerevisiae) as an efficient antigen source for cross-presentation 7 and OT-I mice were used as a source of naïve CD8+ T cells, as these animals harbor antigen-specific CD8+ T cells expressing a transgenic T-cell receptor that recognizes the SIINFEKL peptide from the OVA protein (residues 257–264) in the context of H2Kb 8. CD8+ T-cell proliferation does not directly reflect cross-presentation, however, quantitative measurements of OVA-peptide display in the surface of DCs in the context of MHC class I are technically challenging and hard to perform systematically. We therefore used T-cell proliferation (as many in the field) as an accepted surrogate measure of cross-presentation. We found that 10 μL of lentivirus was sufficient for efficient infection of BMDCs (Fig. 1A) and that 50,000 BMDCs, 50,000 T cells, and a 1:10 DC:yeast ratio were the optimal co-culture conditions for the cross-presentation assay, leading to significant proliferation of OT-I T cells.

We screened an arrayed library that included 3450 lentiviral shRNAs targeting 691 mouse genes. The screen was run in duplicate and showed high reproducibility for several parameters, including number of BMDCs after lentiviral infection and puromycin selection (Supporting Information Fig. 1), and OT-I T-cell proliferation in response to DCs with OVA-expressing yeast (Supporting Information Fig. 2). We excluded wells containing less than 20,000 viable cells from the analysis due to reduced reproducibility at these low numbers (our unpublished data). We calculated a Z-score to quantify the deviation of T-cell proliferation from the mean of all T-cell measurements within the same plate (Fig. 1B), and selected candidate genes that induced significantly higher or lower levels of T-cell proliferation; that is, at least one construct (reproduced across the duplicate plates) had a Z-score higher than 1.5 or lower than –1.2 (Fig. 1B). From the first set of experiments, 134 genes (19.4% of the initial screened genes) were selected for validation in follow-up assays.

The genes selected from the primary screen were again tested in a similar experimental assay, leading us to 41 genes with a reproducible phenotype. The shRNAs targeting these genes were further validated using qRT-PCR to measure knockdown levels. If knockdown correlated well with phenotypic scores, the likelihood of on-target effects was considered high. Based on these results, we selected eight genes that caused a significant and reproducible change in the levels of antigen cross-presentation and thus, the capacity of DCs to elicit OTI T-cell responses (Table 1). When silenced in BMDCs, seven of these genes caused increased antigen cross-presentation (negative regulators), while one led to decreased presentation (positive regulator) (Table 1). Interestingly, four of these genes (Erbb3, Nek8, Ppp3r1, and Ptprg) are expressed and possibly enriched in DCs. More recently, the expression of Erbb3 was associated with a protective phenotype in type 1 diabetes 9. In additional secondary screens, we performed assays to exclude an effect in antigen internalization (phagocytic assays) and antigen processing (as measured by an OVA-DQ reporter). None of the presented regulators show significant effects in these processes when silenced (data not shown). Finally, in a secondary screen involving the selected eight genes, we tested the effect of their silencing in the capacity of BMDCs to elicit CD4+ T-cell responses (Supporting Information Fig. 3 and data not shown). While we found similar negative regulator phenotypes in the cases of Acvr1c and Erbb3, no significant changes were measured in the remaining cases. It is therefore likely that Prkab1, Nek8 (Supporting Information Fig. 3), Ptpr6, Ppp3r, Dlgh3, and Sbk2 are novel and specific regulators of cross-presentation, without significantly affecting MHC class II presentation.
| Gene ID | Symbol | Mean Z-score | Description/role |
|---|---|---|---|
| 269275 | Acvr1c | 2.81 | Activin A receptor, type IC |
| Receptor for the TGF-β family of signaling molecules | |||
| 53310 | Dlgh3 | 1.7 | Discs, large homolog 3 (Drosophila) |
| Encodes a member of the membrane-associated guanylate kinase protein family | |||
| 13867 | Erbb3 | 4.08 | v-erb-b2 erythroblastic leukemia viral oncogene homolog 3 (avian) |
| Encodes a member of the epidermal growth factor receptor (EGFR) family of receptor tyrosine kinases | |||
| Recently reported to be expressed in CD11c+ DCs and associated with a protective phenotype in type 1 diabetes | |||
| 140859 | Nek8 | 1.98 | NIMA (never in mitosis gene a)-related expressed kinash 8 |
| Expression reported in human DCs | |||
| 19058 | Ppp3r1 | 1.84 | Protein phosphatase 3, regulatory subunit B, alpha isoform (calcineurin B, type I) |
| Regulates innate antifungal immunity in neutrophils | |||
| Reported to be expressed in DCs | |||
| 19079 | Prkab1 | 3.09 | Protein kinase, AMP-activated, beta 1 noncatalytic subunit |
| 19270 | Ptprg | 1.62 | Protein tyrosine phosphatase, receptor type, G |
| Recently reported to be differentially expressed in dendritic and mast cells | |||
| 381836 | Sbk2 | 4.05 | SH3-binding domain kinase family, member 2 |
We focused on one of the hits, Acvr1c, also known as Alk7, a type I receptor for the TGF-β family of signaling molecules, implicated in the regulation of adipose tissue accumulation 10 and pancreatic β-cell function 11, but no reports on a role in immunity.
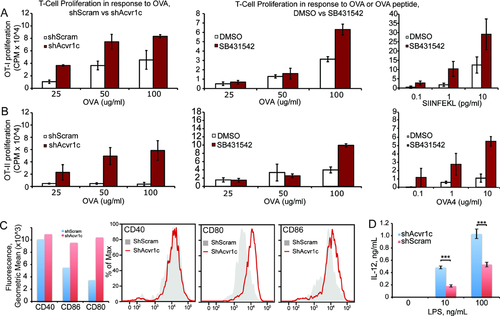
By measuring protein levels in response to knockdown with different shRNAs, we found a good correlation between Acvr1c protein levels and T-cell proliferation resulting from BMDC antigen cross-presentation (Fig. 1C). Next, we used a specific antibody to detect Acvr1c levels by immunobloting in cell-sorted population from C57BL/6 mice spleens. Our results show that, in addition to the expression in previously reported organs such as the brain, pancreas, colon, heart, small intestine, and the ovary 12, Acvr1c is well detected at the protein level in several spleen cell populations, including DCs, macrophages, and T cells, but not B cells (Fig. 1D). In vitro functional experiments show that either the RNAi-mediated depletion of Acvr1c (shAcvr1c) or pharmacologic inhibition (SB431542, which also affects Alk4 and 5 13) cause increased levels of antigen presentation of soluble protein or peptide, in a dose-dependent manner, both in antigen cross-presentation or MHC class II direct presentation assays (Fig. 2A and B). Neither the levels of surface MHC class I nor II are significantly affected by Acvr1c silencing (data not shown). In contrast, we consistently found higher levels of co-stimulatory molecules (CD80 and CD86, but not CD40) in the surface of non-challenged or lipopolysaccharide (LPS)-activated mouse BMDCs (Fig. 2C). We similarly found increased levels of secreted IL-12 (but not IL-6 or TNF-α) in LPS-challenged shAcvr1c BMDCs (Fig. 2D). Our results suggest that Acvr1c is a novel negative regulator of DC maturation.
Concluding remarks
A lentiviral RNAi screen in primary murine BMDCs has allowed us to uncover roles for eight novel kinases and phosphatases in DC stimulation of T-cell proliferation, six of which are likely specific regulators of cross-presentation. Although our study uncovers new gene products affecting this process, further studies are needed to define how these proteins contribute to cross-presentation or to other DC maturation processes.
Materials and methods
Mice
C57BL/6 mice (WT) were obtained from Instituto Gulbenkian de Ciência. C57BL/6 recombination activating gene 1-deficient OT-1 TCR and C57BL/6 recombination activating gene 2-deficient OT-2 TCR transgenic mice were obtained from Taconic and The Jackson Laboratory. All mice were used according to the guidelines and regulations of the Portuguese Veterinary Department.
Purification of BMDCs
Purification of BMDCs was adapted from previously described 14, 15, by culturing BMDCs in 96-well plates instead of 24-well plates and using 200 μL of media instead of 1 mL per well.
T-cell purification
Spleens were isolated from OT-I or OT-II mice and negatively isolated using magnetic beads, (CD8 and CD4 isolation kits, Miltenyi Biotec, Auburn, CA, USA, purification >90%), according to the manufacture's protocol.
Viral production
Plasmids encoding lentiviruses expressing shRNAs were obtained from the RNAi Consortium library (TRC), supplied as glycerol stocks 16]. Plasmids were purified using a 96-well plate format DNA extraction process according to the public protocol described by the TRC (http://www.broad.mit.edu/genome_bio/trc/publicProtocols.html) and DNA was quantified by a Pico-Green assay (Molecular Probes), using an Infinite M200 plate reader (Tecan). DNA concentrations were normalized manually across plates.
Plasmids were then transfected into HEK 293T cells with a three-plasmid system to produce lentivirus 17, 18. Transfections were performed in 96-well plates to generate lentiviruses in a high-throughput manner as adapted by 16.
shRNA lentiviral infections
Mouse BMDCs were plated in 96-well round-bottom plates at 5 × 10⁴ cells per well with 200 μL of GM-CSF supplemented medium. After 48 h, the medium was carefully removed without disturbing the cells at the bottom, and the cells were infected using 10 μL of shRNA lentiviral supernatant (the pellet was resuspended 3–5 times) plus 8 μg/mL of polybrene (hexadimethrine bromide) (Sigma) in 40 μL of GM-CSF medium. The cells were spun for 90 min at 2200 rpm, after which cell supernatant was removed and 200 μL/well of fresh media was added. To select for shRNA integration, 48 h after infection, puromycin (Calbiochem) was added at a final concentration of 5 μg/mL. The cells were challenged 4 days after infection.
Antigen presentation assays
Materials: OVA (Worthington Biochemical Corporation); S. cerevisiae expressing OVA (kindly provided by R. Wheeler, WI); OVA peptide 257–264 (SIINFEKL) (Polypeptide); OVA peptide 323–339 (Polypeptide); LPS (Sigma); SB431542 (Sigma). For antigen presentation assays, BMDCs were incubated with the indicated antigen sources and concentrations. When using the inhibitory drug SB431542, 1 h incubation prior to antigen addition was performed. Cell cultures were pulsed with 1 μCi 3H-thymidine (Perkin Elmer) for approximately 18 h, and incorporation of the radio-nucleotide was measured using a β-scintillation counter (TopCount Gamma Counter; Packard, MA, USA). Similar procedure was followed in monitoring OT-II T-cell proliferation.
Quantitative RT-PCR
Total RNA was extracted using Trizol according to the manufacturer's protocol (Invitrogen), and each sample (1 μg) was reverse transcribed with SuperScript II (Invitrogen) using Oligo-DTTs (Invitrogen) according to the manufacturer's instructions. Oligonucleotide primers were determined using Primer Bank, available at http://pga.mgh.harvard.edu/primerbank/ 19, 20 and obtained from Invitrogen. The 25 μL qPCR reaction (contained 1 μL of cDNA, 12.5 μL of SYBR green master mix (Applied Biosystems, Foster City, CA, USA), and 20 pmol of sense and antisense primers) was performed on an Abi Prism 7000 (Applied Biosystems). An initial activation step for 10 min at 95°C was followed by 40 cycles of (95°C, 15 s; 60°C, 60 s). Quantity values for gene expression were generated by comparison of the fluorescence generated by each sample (always run in triplicate) with standard curves of known quantities (the standard series were prepared by performing tenfold serial dilutions of full-length cDNAs per qPCR reaction), and the calculated number of copies was divided by the number of copies of the housekeeping gene GAPDH.
Western blots
Antibodies: Rabbit polyclonal anti-Acvr1c (Abcam), mouse monoclonal anti-β-actin (Abcam), anti-mouse and anti-rabbit secondary antibodies (Cell Signaling). All antibodies were used according to manufactures recommendations. Cells were harvested by centrifugation (1200 rpm, 5 min, room temperature), after which were rinsed once with phosphate buffered saline (PBS). Cell pellets were then lysed in 20–40 μL of lysis buffer (50 mM Tris, pH 7.4, 150 mM NaCl, 1% NP40, 0.25% sodium deoxycholate, 1 mM EGTA, 1 mM PMSF, protease inhibitors, 1 mM Na3VO4, 1 mM NaF), incubated 10 min on ice and centrifuged at 14 000 rpm (10 min, 4°C). The resulting supernatants were transferred to a fresh 1.5-mL tube. Samples were loaded on 10–12% SDS-PAGE gel and after transferring, the membranes were blocked and incubated with primary antibodies. Antiactin immunoblotting served as a loading control for the western blots. Immunoblots were developed using horseradish peroxidase-coupled secondary antibodies and detected by enhanced chemiluminescence (GE Healthcare, Piscataway, NJ, USA).
Cytokine production measurement
Cell supernatants were collected at the referred antigen presentation assay time point and analyzed for TNF-α, IL-6, IL-12, using DuoSet ELISA reagents according to the manufacture's protocol (R&D systems, Minneapolis, MN, USA).
Flow cytometry
Cells were stained with indicated antibodies for 20 min on ice. After washing, the cells were resuspended in PBS (FBS 5%) and subsequently measured using a FACSCalibur flow cytometer (BD Biosciences, San Jose, CA, USA) and analyzed using the FlowJo software (TreeStar, Ashland, OR, USA). Cell sorting was conducted using a FACSAria I cell sorter (BD Biosciences).
Allophycocyanin-conjugated anti-CD11c (Biolegend), FITC-conjugated anti-CD86 (Biolegend), PE-conjugated anti-CD40 (Biolegend), PE-conjugated and anti-CD80 (Biolegend) were used at 1 mg/mL.
Statistical analysis
The data were analyzed using the Prism software and compared using the unpaired t-test.
Z-score calculation
We calculated a Z-score to assess changes in T-cell proliferation levels in a single well relative to the mean level of T-cell proliferation across all wells of the same plate. Levels of T-cell proliferation were measured using 3H-thymidine for each 96-well plate and represented as C = (C1, C2, …, C96), excluding wells for which cell counts were <20,000 cells. We calculated a score for the T-cell proliferation in a well as Zi = (Ci – μ)/σ, in which μ and σ are the mean and SD of C, respectively.
Acknowledgements
This work was supported by Fundação para a Ciência e Tecnologia (PIC/IC/82991/2007, PTDC/SAU-MII/100780/2008, and PTDC/SAU-IMU/110303/2009), Fundação Luso-Americana para o Desenvolvimento, and the Human Frontier Science Program.
Conflict of interest
The authors declare no financial or commercial conflict of interest.
References
Abbreviations
-
- BMDC
-
- bone marrow-derived dendritic cell


