Sodium and potassium changes during decongestion with acetazolamide – A pre-specified analysis from the ADVOR trial
Abstract
Aims
Acetazolamide, an inhibitor of proximal tubular sodium reabsorption, leads to more effective decongestion in acute heart failure (AHF). It is unknown whether acetazolamide alters serum sodium and potassium levels on top of loop diuretics and if baseline values modify the treatment effect of acetazolamide.
Methods and results
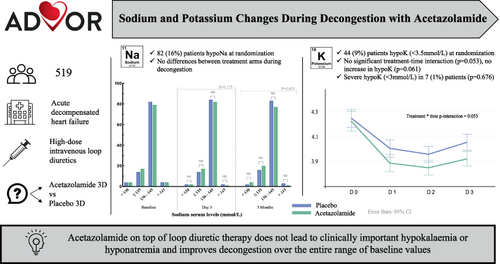
This is a pre-specified sub-analysis of the ADVOR trial that randomized 519 patients with AHF and volume overload in a 1:1 ratio to intravenous acetazolamide or matching placebo on top of standardized intravenous loop diuretics. Mean potassium and sodium levels at randomization were 4.2 ± 0.6 and 139 ± 4 mmol/L in the acetazolamide arm versus 4.2 ± 0.6 and 140 ± 4 mmol/L in the placebo arm. Hypokalaemia (<3.5 mmol/L) on admission was present in 44 (9%) patients and hyponatraemia (≤135 mmol/L) in 82 (16%) patients. After 3 days of treatment, 44 (17%) patients in the acetazolamide arm and 35 (14%) patients in the placebo arm developed hyponatraemia (p = 0.255). Patients randomized to acetazolamide demonstrated a slight decrease in mean potassium levels during decongestion, which was non-significant over time (p = 0.053) and had no significant impact on hypokalaemia incidence (p = 0.061). Severe hypokalaemia (<3.0 mmol/L) occurred in only 7 (1%) patients, similarly distributed between the two treatment arms (p = 0.676). Randomization towards acetazolamide improved decongestive response irrespective of baseline serum sodium and potassium levels.
Conclusions
Acetazolamide on top of standardized loop diuretic therapy does not lead to clinically important hypokalaemia or hyponatraemia and improves decongestion over the entire range of baseline serum potassium and sodium levels.
Graphical Abstract
Introduction
The Acute Decompensated heart failure with Volume OveRload (ADVOR) trial has demonstrated that the addition of intravenous acetazolamide to standardized intravenous loop diuretics in patients with volume overload and acute heart failure (AHF) improves diuretic efficacy and results in a higher incidence of successful decongestion, ultimately leading to a shorter length of stay.1
Electrolyte imbalances are commonly encountered during AHF admissions and its occurrence might lead to reduced diuretic intensity and residual congestion.2-4 Hyponatraemia is associated with an increased risk of adverse events including prolonged hospital stay and a higher risk of readmission and all-cause mortality.4-6 The pathophysiology of hyponatraemia in AHF is more often impaired water excretion, rather than sodium depletion while hypokalaemia is most commonly associated with kaliuresis associated with diuretic use.2, 4 Hypokalaemia-associated risks include potentially life-threatening arrhythmias, warranting close monitoring during diuretic use.2, 7, 8 Loop diuretics, which have a class I recommendation (level of evidence C) to treat volume overload in AHF independent of left ventricular ejection fraction, can induce or worsen these electrolyte disturbances.8-10 For patients with apparent loop diuretic resistance after dose escalation, current guidelines endorse the addition of a thiazide-like diuretic with a class IIa recommendation, level of evidence B.8, 11 However, thiazide-like diuretics, targeting the sodium–chloride cotransporter in the distal convoluted tubules, may exacerbate the risk for hypokalaemia and hyponatraemia and are associated with a higher risk for all-cause mortality in observational data.12
Limited information is available about the impact of acetazolamide on serum sodium and potassium levels. Therefore, the current pre-specified analysis of the ADVOR trial aims to determine (i) the influence of sodium and potassium alterations on admission on the treatment effect of acetazolamide, and (ii) the effect of acetazolamide on serum sodium and potassium levels during decongestion.
Methods
Trial design and population
The methods and the results of the ADVOR trial (NCT03505788) have been published previously.1, 13 Briefly, patients enrolled were adults who were admitted for AHF. Patients were required to have N-terminal pro-B-type natriuretic peptide (NT-proBNP) >1000 pg/ml or B-type natriuretic peptide >250 pg/ml with at least one clinical sign of volume overload (i.e. ascites, pleural effusion, or oedema) despite oral maintenance therapy with at least 40 mg of furosemide (or an equivalent dose) for at least 1 month.13 The main exclusion criteria included acetazolamide maintenance therapy, treatment with sodium–glucose cotransporter 2 inhibitors, systolic blood pressure <90 mmHg, or an estimated glomerular filtration rate <20 ml/min/1.73 m2.13 Participants were randomly assigned to treatment with an intravenous bolus of acetazolamide (500 mg once daily) or matching placebo added to standardized loop diuretic therapy (twice oral home dose intravenously daily) in a 1:1 fashion upon randomization and during the next 2 days. The use of a thiazide diuretic was discontinued according to the study protocol.13 It was recommended that patients received 3 g of intravenous magnesium supplements daily during decongestion with intravenous diuretics. The primary endpoint was successful decongestion within 3 days, based on the absence of clinical signs of fluid overload (oedema, pleural effusion, ascites) other than a trace oedema with a urine output of at least 3.5 L after 2 days of treatment. Other pre-defined endpoints included the combined endpoint of death from any cause and rehospitalization for heart failure within 3 months of follow-up. The study was approved by all local ethics committees and all participants provided written informed consent.
Sodium and potassium serum levels
Blood samples including sodium and potassium levels were collected per protocol at randomization (baseline = day 0), day 1, day 2, day 3 and 3 months thereafter.13 There were no sodium or potassium concentration inclusion or exclusion criteria. Patients were categorized as having hyponatraemia (≤135 mmol/L) or hypernatraemia (>145 mmol/L) and hypokalaemia (<3.5 mmol/L) or hyperkalaemia (>5.0 mmol/L). In case of serum potassium levels <4 mmol/L during the treatment phase, it was recommended to add 40 mmol of potassium chloride to the maintenance infusion (data not collected in case report form) in both treatment arms.13 Neurohumoral blockers (e.g. renin–angiotensin system blockers, sacubitril/valsartan, beta-blockers, and mineralocorticoid receptor antagonists) were continued at the same or lower dosage at the discretion of the treating physician until the end of the treatment phase. Dose increase of neurohormonal blockers was not allowed during the treatment phase apart from mineralocorticoid receptor antagonists in case of hypokalaemia despite intravenous potassium supplement.
Statistical analysis
Data are expressed as mean ± standard deviation for normally distributed continuous variables or median (interquartile range) if otherwise. Absolute and relative frequencies are used to present categorical data. Comparisons between groups were performed using variable t-tests, χ2 test, Kruskal–Wallis test or Mann–Whitney U test as appropriate. The comparative analysis of the occurrence of electrolyte imbalances was conducted across various time intervals between the two treatment arms. In addition, linear mixed-effects models with repeated measures over time were performed to assess changes in serum sodium and potassium levels during the acute treatment phase (from randomization to day 3) according to treatment group allocation (acetazolamide vs. placebo). Fixed effects included the treatment allocation, time and the time × treatment interaction, the model included a random effect intercept. The primary endpoint (binary) was evaluated using a generalized linear-mixed model, which included a fixed-treatment effect and random intercept to calculate odds ratios and 95% confidence intervals (CI). For subgroup analysis, e.g. treatment effect according to potassium or sodium categories, categories were entered in the model as an interaction term with the treatment effect. Time-to-event analysis using Cox proportional hazard models was used to determine the effects of baseline hyponatraemia or hypokalaemia on all-cause mortality and heart failure readmissions. Moreover, a time-to-event analysis was performed for treatment-induced hypokalaemia on day 3 to all-cause mortality and readmissions for heart failure within 3 months. All outcome analyses were covariate-adjusted. Covariates were chosen based on the differences in baseline characteristics and clinical relevance, including age, sex, maintenance dose of furosemide, left ventricular ejection fraction, systolic blood pressure, estimated glomerular filtration rate, and the use of mineralocorticoid receptor antagonists. All statistical tests were two-tailed and used a significance level of α = 0.05. Statistical analyses were performed using IBM SPSS Statistics 22 (IBM, Chicago, IL, USA).
Results
Patients
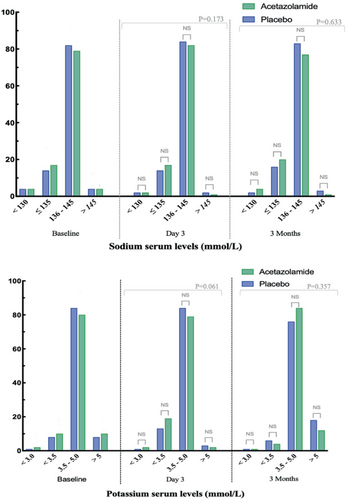
Mean potassium level on admission was 4.2 ± 0.6 mmol/L in the acetazolamide arm versus 4.2 ± 0.6 mmol/L (p = 0.676) in the placebo arm. Mean sodium levels were 139 ± 4 versus 140 ± 4 mmol/L (p = 0.081). Baseline characteristics stratified by hyponatraemia and hypokalaemia categories are summarized in Table 1; 82 (16%) participants had a baseline sodium level of ≤135 mmol/L, of whom 17 (3%) had a baseline serum sodium <130 mmol/L (Figure 1). A total of 44 (9%) patients had a baseline potassium level <3.5 mmol/L, of whom 6 (1%) were <3.0 mmol/L. At randomization, only 17 (3%) patients were treated with a thiazide diuretic, mainly as an antihypertensive agent, which was discontinued according to the study protocol.13 Patients with hyponatraemia had a higher maintenance dose of furosemide prior to randomization, were more often on mineralocorticoid receptor antagonists and had a higher systolic blood pressure. Moreover, baseline serum osmolality was significantly lower in patients with hyponatraemia. Patients with hypokalaemia used a higher maintenance dose of furosemide and were more likely to have chronic kidney disease.
| Parameter | Na ≤135 mmol/L (n = 82) | Na >135 mmol/L (n = 437) | p-value | K <3.5 mmol/L (n = 44) | K ≥3.5 mmol/L (n = 459) | p-value |
|---|---|---|---|---|---|---|
| Age (years) | 77 ± 9 | 78 ± 9 | 0.268 | 77 ± 9 | 78 ± 9 | 0.239 |
| Male sex | 51 (62%) | 274 (63%) | 0.931 | 29 (66%) | 286 (62%) | 0.637 |
| Heart rate (bpm) | 79 ± 19 | 77 ± 18 | 0.307 | 75 ± 17 | 78 ± 18 | 0.192 |
| SBP (mmHg) | 127 ± 21 | 121 ± 18 | 0.015 | 129 ± 22 | 126 ± 21 | 0.332 |
| DBP (mmHg) | 72 ± 13 | 71 ± 12 | 0.272 | 74 ± 13 | 72 ± 13 | 0.436 |
| Weight (kg) | 83 ± 20 | 85 ± 22 | 0.056 | 89 ± 27 | 84 ± 21 | 0.098 |
| Congestion score | 5 (3–6) | 4 (3–5) | 0.199 | 5 (3–6) | 4 (3–5) | 0.199 |
| Pleural effusion | 41 (50%) | 218 (53%) | 0.560 | 16 (36%) | 246 (54%) | 0.089 |
| Ascites | 9 (11%) | 37 (9%) | 0.235 | 5 (11%) | 39 (8%) | 0.779 |
| Oedema score | 0.099 | 0.071 | ||||
| No or trace oedema | 3 (4%) | 38 (9%) | 1 (2%) | 39 (8%) | ||
| Up to ankle | 9 (11%) | 64 (15%) | 2 (5%) | 69 (15%) | ||
| Up to knee | 35 (43%) | 193 (44%) | 20 (45%) | 205 (45%) | ||
| Above the knee | 35 (43%) | 142 (32%) | 21 (48%) | 146 (32%) | ||
| Maintenance dose-furosemide equivalents (mg) | 90 (40–200) | 60 (40–100) | 0.005 | 80 (40–200) | 60 (40–100) | 0.016 |
| LVEF (%) | 45 ± 16 | 43 ± 15 | 0.190 | 47 ± 15 | 43 ± 15 | 0.052 |
| NT-proBNP (pg/ml) | 7187 (3589–12 804) | 5659 (2940–10 625) | 0.100 | 6020 (2944–10 570) | 6091 (3035–10 896) | 0.789 |
| NYHA class | 0.201 | |||||
| II | 10 (12%) | 56 (13%) | 0.859 | 2 (5%) | 62 (14%) | |
| III | 49 (60%) | 247 (57%) | 29 (66%) | 258 (56%) | ||
| IV | 23 (28%) | 134 (31%) | 13 (29%) | 139 (30%) | ||
| Sodium (mmol/L) | 132 ± 4 | 140 ± 3 | <0.001 | 140 ± 5 | 140 ± 4 | 0.241 |
| Potassium (mmol/L) | 4.2 ± 0.6 | 4.3 ± 0.6 | 0.359 | 3.22 ± 0.2 | 4.3 ± 0.5 | <0.001 |
| HCO3 (mmol/L) | 26 ± 4 | 25 ± 4 | 0.026 | 28 ± 4 | 26 ± 4 | 0.020 |
| Chloride (mmol/L) | 94 ± 5 | 102 ± 4 | <0.001 | 98 ± 6 | 101 ± 5 | 0.009 |
| Albumin (g/L) | 39 ± 5 | 39 ± 5 | 0.982 | 37 ± 5 | 39 ± 5 | 0.083 |
| Serum osmolality (mmol/kg) | 287 ± 15 | 299 ± 10 | <0.001 | 295 ± 11 | 298 ± 15 | 0.195 |
| eGFR (ml/min/1.73 m2) | 44 ± 18 | 43 ± 18 | 0.532 | 50 ± 20 | 43 ± 18 | 0.011 |
| eGFR <60 ml/min/1.73 m2 | 66 (80%) | 356 (81%) | 0.470 | 31 (70%) | 376 (82%) | 0.045 |
| Comorbidities | ||||||
| History of AF | 62 (76%) | 314 (72%) | 0.485 | 33 (75%) | 332 (72%) | 0.705 |
| Diabetes | 41 (50%) | 204 (47%) | 0.630 | 17 (39%) | 219 (48%) | 0.249 |
| Arterial hypertension | 55 (67%) | 334 (76%) | 0.095 | 33 (75%) | 342 (75%) | 0.943 |
| Peripheral arterial disease | 17 (21%) | 84 (19%) | 0.762 | 6 (14%) | 91 (20%) | 0.320 |
| COPD | 16 (20%) | 85 (19%) | 0.990 | 7 (16%) | 89 (19%) | 0.575 |
| Malignancy | 11 (13%) | 46 (11%) | 0.119 | 4 (10%) | 52 (11%) | 0.733 |
| Treatment | ||||||
| ACEi/ARB/ARNI | 39 (48%) | 230 (53%) | 0.399 | 22 (50%) | 238 (52%) | 0.814 |
| Beta-blocker | 52 (76%) | 357 (82%) | 0.200 | 33 (75%) | 373 (81%) | 0.314 |
| MRA | 45 (55%) | 171 (39%) | 0.008 | 15 (34%) | 191 (42%) | 0.332 |
| Digoxin | 8 (10%) | 26 6%) | 0.201 | 3 (7%) | 32 (7%) | 0.987 |
| ICD | 12 (15%) | 67 (15%) | 0.872 | 5 (11%) | 73 (16%) | 0.472 |
| CRT | 11 (13%) | 50 (11%) | 0.611 | 7 (13%) | 57 (12%) | 0.274 |
- Values are expressed as mean ± standard deviation, n (%), or mean (interquartile range).
- ACEi, angiotensin-converting enzyme inhibitor; AF, atrial fibrillation; ARB, angiotensin receptor blocker; ARNI, angiotensin receptor–neprilysin inhibitor; COPD, chronic obstructive pulmonary disease; CRT, cardiac resynchronization therapy; DBP, diastolic blood pressure; eGFR, estimated glomerular filtration rate; ICD, implantable cardioverter-defibrillator; K, potassium; LVEF, left ventricular ejection fraction; MRA, mineralocorticoid receptor antagonist; Na, sodium; NT-proBNP, N-terminal pro b-type natriuretic peptide; NYHA, New York Heart Asociation; SBP, systolic blood pressure.
- All statistical tests were two-tailed and used a significance level of α = 0.05 are in bold.
Effect of acetazolamide on serum sodium
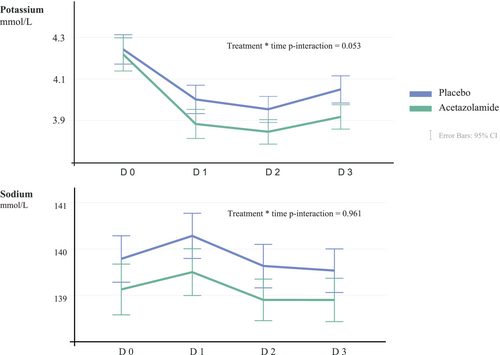
The distributions into the defined sodium categories at baseline (day 0), day 3 and 3 months thereafter are illustrated in Figure 1, while numerical data are displayed in online supplementary Table S1. The changes in sodium levels exhibited over time as illustrated in Figure 2. Mean sodium serum level on day 3 was 139 ± 4 mmol/L in the acetazolamide arm versus 139 ± 4 mmol/L in the placebo arm (p = 0.102). Compared to values at admission (day 3 vs. day 0), serum sodium levels declined with 0.1 ± 0.3 mmol/L in the acetazolamide arm compared to 0.3 ± 0.4 mmol/L in the placebo arm (p = 0.199). Three months after randomization, sodium levels were 139 ± 4 and 139 ± 4 mmol/L, respectively (p = 0.804). Despite numerical difference in sodium values at randomization, there was no difference in the change of sodium over time according to treatment allocation (treatment × time interaction p = 0.961). The overall group difference in sodium during the treatment phase was 0.68 mmol/L (95% CI 0.06–1.30, p = 0.030), which was related to the numerical difference at baseline and not related to a differential change in sodium during treatment as indicated by the treatment × time interaction (p = 0.961). Figure 1 depicts no significant discrepancy in the distribution of sodium categories.
Effect of acetazolamide on serum potassium
The distributions into the defined potassium categories at baseline (day 0), day 3 and 3 months thereafter are illustrated in Figure 1, while numerical data are displayed in online supplementary Table S1. The mean values over time are plotted in Figure 2. In linear mixed effect model taking all repeated measurements during the treatment phase into account, potassium was numerically lower in the acetazolamide arm than the placebo arm (difference = 0.08 mmol/L, 95% CI 0.015–0.16, p = 0.018), with a change in potassium over time being more pronounced in the acetazolamide arm (time × treatment interaction p = 0.053). The mean potassium serum level on day 3 was 3.8 ± 0.5 mmol/L in the acetazolamide arm versus 4.0 ± 0.5 mmol/L in the placebo arm (p = 0.014). Compared to values at admission (day 3 vs. day 0), serum potassium levels declined with 0.4 ± 0.3 mmol/L in the acetazolamide arm and 0.2 ± 0.2 mmol/L in the placebo arm (p = 0.022). Three months after randomization, potassium levels were 4.4 ± 0.6 and 4.5 ± 0.7 mmol/L, respectively (p = 0.667). Regarding the distribution of the pre-defined potassium categories: mild hypokalaemia (3–3.5 mmol/L) was more frequent on day 3 compared to baseline (16% vs. 9%, p = 0.004) irrespective of treatment allocation, with no significant differences between the treatment allocation on day 3 (p = 0.061) and 3 months after randomization (p = 0.257). Potassium levels <3.0 mmol/L occurred in only 7 (1%) patients and was similarly distributed between patients assigned to placebo or acetazolamide (1% and 2%, respectively, p = 0.676).
Impact of sodium and potassium on treatment effects of acetazolamide
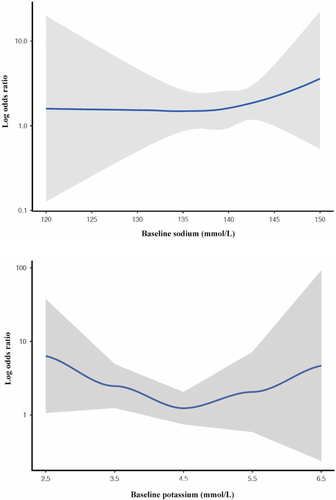
Hypokalaemia (<3.5 mmol/L) on admission, irrespective of treatment allocation, was not associated with any clinical outcome including successful decongestion within 3 days, all-cause mortality, and heart failure readmissions within 3 months, either in unadjusted or adjusted analyses corrected for differences in baseline characteristics (Table 2). Treatment-induced hypokalaemia (<3.5 mmol/L) in both treatment arms on day 3 did not affect all-cause mortality and/or heart failure readmissions within 3 months (online supplementary Table S2). Baseline hyponatraemia (≤135 mmol/L), irrespective of treatment allocation, was not associated with the occurrence of decongestion endpoints (successful decongestion within 3 days and at discharge) but was associated with a higher odds ratio for the combined endpoint of all-cause mortality and heart failure readmission within 3 months (p = 0.027 and p = 0.019, respectively). When adjusted for differences in baseline characteristics, only the association with all-cause mortality remained significant (p = 0.044) (Table 2). Table 3 reports the treatment effect of acetazolamide according to baseline sodium and potassium categories. As displayed in Table 3, no statistical treatment effect modification was found according to all subgroups of sodium and potassium at baseline. In addition, patients assigned to acetazolamide had a shorter length of stay versus patients assigned to placebo (8.8 [8–9.5] days vs. 9.9 [9.1–10.8] days, p = 0.016). No statistical treatment effect modification was found according to sodium levels on the length of stay (p for interaction = 0.155, *adjusted = 0.191) and potassium (p for interaction = 0.707, adjusted = 0.729). Figure 3 illustrates the relation between baseline serum sodium and potassium levels reflected as a continuous variable according to the treatment effect of acetazolamide for the primary endpoint reflected as a restricted cubic spline.
| Endpoint | OR/HR (95% CI) | p-value | OR/HRa (95% CI) | p-value |
|---|---|---|---|---|
| Hyponatremia ≤135 mmol/L | ||||
| Primary endpoint (successful decongestion within 3 days) | 0.68 (0.40–1.18) | 0.172 | 0.73 (0.42–1.27) | 0.259 |
| Successful decongestion at discharge | 0.59 (0.39–1.12) | 0.183 | 0.75 (0.32–1.23) | 0.282 |
| Mortality and HF readmissions at 3 months | 1.59 (1.07–2.40) | 0.027 | 1.35 (0.91–2.02) | 0.081 |
| All-cause mortality at 3 months | 1.90 (1.11–3.24) | 0.019 | 1.76 (1.02–3.05) | 0.044 |
| HF readmissions at 3 months | 1.64 (0.99–2.70) | 0.063 | 1.37 (0.82–2.26) | 0.238 |
| Hypokalaemia <3.5 mmol/L | ||||
| Primary endpoint (successful decongestion within 3 days) | 0.83 (0.40–1.73) | 0.622 | 0.85 (0.40–1.76) | 0.656 |
| Successful decongestion at discharge | 0.71 (0.33–1.54) | 0.385 | 0.78 (0.37–1.60 | 0.500 |
| Mortality and HF readmissions at 3 months | 0.82 (0.41–1.50) | 0.461 | 0.82 (0.43–1.57) | 0.819 |
| All-cause mortality at 3 months | 0.98 (0.34–2.10) | 0.710 | 0.95 (0.38–2.39 | 0.912 |
| HF readmissions at 3 months | 0.86 (0.33–1.74) | 0.519 | 0.75 (0.33–1.74) | 0.509 |
- CI, confidence interval; HF, heart failure; HR, hazard ratio; OR, odds ratio.
- All statistical tests were two-tailed and used a significance level of α = 0.05 are in bold.
- a Adjusted for age, sex, maintenance dose of furosemide, left ventricular ejection fraction, systolic blood pressure, estimated glomerular filtration rate, and use of mineralocorticoid receptor antagonists.
| Variable | Placebo | Acetazolamide | OR/HR (95% CI) | Adjusted OR/HRa (95% CI) | p for interaction |
|---|---|---|---|---|---|
| Successful decongestion within 3 days after randomization, n (%) | |||||
| Overall | 79 (31) | 108 (42) | 1.77 (1.18–2.63) | 1.80 (1.19–2.61) |
0.005 0.004a |
| K <3.5 mmol/L | 5 (2) | 12 (5) | 3.44 (0.82–14.59) | 3.51 (0.74–16.76) |
0.714 0.757a |
| K 3.5–5.0 mmol/L | 68 (26) | 83 (32) | 1.53 (0.98–2.40) | 1.53 (0.97–2.29) | |
| K >5 mmol/L | 6 (2) | 13 (5) | 2.65 (0.65–10.85) | 1.80 (0.38–8.61) | |
| Na ≤135 mmol/L | 9 (3) | 16 (6) | 1.61 (0.58–4.76) | 1.48 (0.48–4.54) |
0.763 0.228a |
| Na 136–145 mmol/L | 67 (26) | 88 (34) | 1.83 (1.74–2.86) | 1.80 (1.19–2.74) | |
| Na >145 mmol/L | 3 (1) | 4 (2) | 1.72 (1.54–14.26) | 1.12 (0.03–6.54) | |
| Successful decongestion at discharge, n (%) | |||||
| Overall | 145 (63) | 190 (78) | 1.70 (1.14–2.53) | 1.88 (1.09–3.23) |
0.009 0.023a |
| K <3.5 mmol/L | 10 (4) | 16 (6) | 2.23 (0.54–9.32) | 1.07 (0.19–5.95) |
0.835 0.857a |
| K 3.5–5.0 mmol/L | 123 (47) | 155 (60) | 2.08 (0.89–3.31) | 2.02 (1.27–3.23) | |
| K >5 mmol/L | 12 (5) | 19 (7) | 2.88 (0.65–12.70) | 1.88 (0.37–9.70) | |
| Na ≤135 mmol/L | 16 (6) | 35 (14) | 3.71 (1.37–10.03) | 4.39 (1.40–13.83) |
0.355 0.321a |
| Na 136–145 mmol/L | 123 (47) | 149 (58) | 2.10 (1.32–3.36) | 2.06 (1.28–3.30) | |
| Na >145 mmol/L | 6 (2) | 6 (2) | 0.67 (0.06–5.29) | 0.55 (0.11–4.62) | |
| All-cause mortality or rehospitalization for heart failure during 3 months of follow-up, n (%) | |||||
| Overall | 72 (28) | 76 (30) | 1.07 (0.78–1.48) | 1.08 (0.78–1.50) |
0.667 0.638a |
| K <3.5 mmol/L | 7 (3) | 6 (8) | 0.82 (0.54–1.25) | 0.75 (0.56–1.22) |
0.074 0.120a |
| K 3.5–5.0 mmol/L | 56 (22) | 58 (22) | 1.06 (0.73–1.54) | 1.03 (0.71–1.50) | |
| K >5 mmol/L | 9 (3) | 12 (5) | 0.98 (0.49–1.98) | 0.96 (0.41–1.78) | |
| Na ≤135 mmol/L | 14 (5) | 17 (7) | 1.24 (0.61–2.50) | 1.50 (0.70–3.20) |
0.739 0.752a |
| Na 136–145 mmol/L | 56 (22) | 56 (22) | 1.08 (0.75–1.56) | 0.98 (0.67–1.24) | |
| Na >145 mmol/L | 3 (1) | 3 (1) | 0.50 (0.20–3.24) | 0.38 (0.26–3.24) | |
- CI, confidence interval; HR, hazard ratio; K, potassium; OR, odds ratio.
- All statistical tests were two-tailed and used a significance level of α = 0.05 are in bold.
- a Adjusted for age, sex, maintenance dose of furosemide, left ventricular ejection fraction, systolic blood pressure, estimated glomerular filtration rate, and use of mineralocorticoid receptor antagonists.
Discussion
In this pre-specified analysis of the ADVOR trial, we found that intravenous acetazolamide on top of loop diuretics was not associated with clinically meaningful rates of hyponatraemia or hypokalaemia compared with loop diuretics alone. Moreover, alterations in sodium and potassium levels did not affect the decongestive treatment effect of acetazolamide or its potential to reduce length of stay (Graphical Abstract). These data provide reassurance that the upfront use of acetazolamide together with loop diuretics in order to achieve decongestion in acute decompensated heart failure can be administered in a safe manner also with regard to sodium and potassium levels.
Loop diuretics increase potassium loss due to augmented distal tubular sodium reabsorption in exchange for potassium excretion.14 Acetazolamide further increases distal tubular sodium flow (natriuresis) by reducing proximal tubular sodium reabsorption.1 Therefore, the combinational use of both agents has the theoretical risk to induce significant hypokalaemia. Hypokalaemia lengthens the action potential and expands QT dispersion, thereby increasing the risk of ventricular arrhythmia.2, 15, 16 The risk increases steeply with potassium levels below 3 mmol/L, termed severe hypokalaemia.2 In addition, more severe potassium decline (>15%) during hospitalization for AHF is an independent and strong predictor for 180-day all-cause mortality.17, 18 In the ADVOR trial, patients who were allocated to acetazolamide in addition to loop diuretic therapy exhibited marginally lower mean potassium levels during decongestion in contrast to those assigned to placebo. These findings highlight the importance of closely monitoring electrolyte levels in the acute phase of decongestion. Nonetheless, the decline observed in potassium levels from baseline in the acetazolamide arm was not considerable (an average of −0.4 mmol/L at day 3) and was over time not statistically significant when compared to the placebo group (p = 0.053). Additionally, this reduction did not lead to a significant increase in the incidence of hypokalaemia (<3.5 mmol/L). Moreover, potassium levels <3.0 mmol/L were only present in 7 (1%) patients, similarly distributed between the two groups and treatment-induced hypokalaemia did not affect any outcome. This coincided with more initiation of mineralocorticoid receptor antagonist which was encouraged by the study protocol, partly due to the increase in aldosterone secretion with potassium suppletion.13, 19 Although, some patients might have received intravenous potassium supplements which was not captured by the case report form.
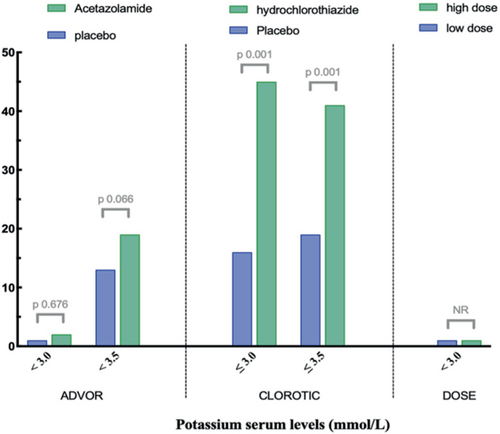
In order to enhance comparability with other diuretic trials, the prevalence of hypokalemia is presented in Figure 4 and online supplementary Table S3. The Diuretic Optimization Strategies Evaluation (DOSE) trial found a comparable outcome regarding severe hypokalaemia (<3.0 mmol/L), which was observed in 1% of the total patient population.20 Importantly, this is in contrast to the effect of thiazide-like diuretics on serum potassium levels in the CLOROTIC trial, which demonstrated a high prevalence of hypokalaemia, defined as ≤3.0 mmol/L (41% vs. 16%, p < 0.001) within the first days of daily use of hydrochlorothiazide.21 Indeed, agents like thiazides, which work distal in the nephron, can induce significant kaliuresis, as per sodium ion lost 2–3 ions of potassium are excreted, which is especially pronounced in high aldosterone states like AHF.22, 23 Importantly, in a propensity-matched analysis of real-world use of thiazides on top of loop diuretics, thiazides, but not high-dose loop diuretics, were independent predictors of the occurrence of hyponatraemia and hypokalaemia with a strong association towards a higher risk for all-cause mortality.12
Hyponatraemia is the most common electrolyte disorder in patients presenting with AHF, which results from impaired water excretion (dilutional) rather than sodium loss.4, 8, 24 Major determinants are increased arginine vasopressin release for any plasma osmotic pressures (stimulated by angiotensin II) and reduced renal tubular flow, which impairs the ability of the kidneys to excrete free water.4 To antagonize these detrimental effects in order to improve free water excretion, one should try to facilitate solute flow in the distal parts so that the distal nephron can dilute urine to an osmolality as low as 10-fold of serum.4 Adding acetazolamide elegantly fits in this pathophysiology, especially in the case of prolonged loop diuretic administration because the latter prevents renal medullar osmotic build-up which reduces concentrating ability in the collecting ducts even more.4, 25 There was a non-significant trend toward lower baseline sodium levels in the acetazolamide arm, which was no longer present during follow-up, which might be explained by the fact that acetazolamide might facilitate the ability of the kidneys to excrete free water to help correct dilutional hyponatraemia.
Finally, despite the comorbid AHF population in the ADVOR trial, we did not observe any significant treatment effect modification or harm of acetazolamide according to baseline serum and potassium categories, both in covariate adjusted and unadjusted analysis. Therefore, the upfront use of acetazolamide on top of loop diuretic therapy is considered safe irrespective of the baseline sodium and potassium alterations and these baseline values do not alter the treatment effect of acetazolamide to achieve more successful decongestion in AHF.
Limitations
Several limitations of this sub-analysis should be acknowledged. First, while acetazolamide did not lead to significant changes in sodium and potassium during acute use, we do not have data to extrapolate this to its chronic use. Second, the protocol recommended the utilization of 500 ml dextrose solution including 3 g magnesium sulphate every 24 h and some patients might have received intravenous potassium supplements. Magnesium is essential for the proper functioning of the sodium/potassium pump and hypomagnesaemia potentiates the arrhythmogenic effect of hypokalaemia and they frequently co-exist.7
Conclusion
Acetazolamide on top of intravenous loop diuretic therapy is a safe strategy with respect to sodium and potassium serum homeostasis. The addition of acetazolamide improved diuretic efficacy across the entire serum sodium and potassium spectrum, ultimately leading to more successful decongestion and shorter length of stay in a comorbid decompensated AHF population irrespective of baseline sodium or potassium.
Funding
This study (KCE-17001) is independent research funded by Belgian Health Care Knowledge Centre under the KCE Trials Program. The views expressed in this publication are those of the author(s) and not necessarily those of Belgian Health Care Knowledge Centre which did not influence the analysis or reporting of the trial.
Conflict of interest: none declared.


