Association between the Tpeak-Tend interval on admission and coronary microvascular dysfunction in Takotsubo syndrome
Abstract
Aims
The Tpeak-Tend interval on electrocardiogram may be a predictor of worse outcomes in Takotsubo syndrome (TTS), but the mechanisms have not been fully determined. This study aimed to investigate the relationships between the corrected Tpeak-Tend (cTp-e) interval and coronary microvascular-dysfunction (CMD) assessed by the angiography-derived index of microvascular resistance (Angio-IMR) and the in-hospital prognosis in patients with TTS.
Methods and results
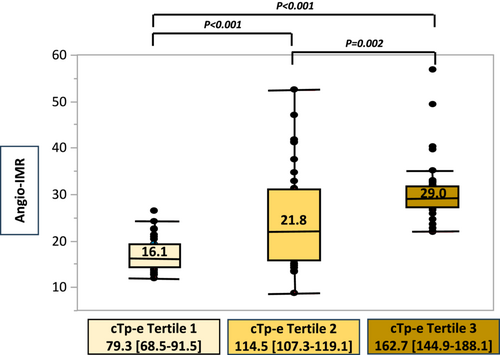
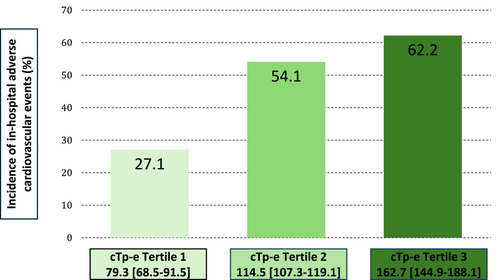
We retrospectively evaluated 111 consecutive patients admitted for TTS who underwent coronary angiography at Kindai University Hospital from October 2009 to July 2023. The Tpeak-Tend interval was defined as the time interval between the peak and the end of the T wave in electrocardiogram lead V5 on admission. Angio-IMR was assessed from aortic pressure, quantitative flow ratio (QFR), vessel length and hyperemic velocity using the formula described in validation studies. QFR, vessel length and hyperemic velocity was derived from coronary angiography and QAngio XA 3D software package. The degree of CMD was assessed by the maximum Angio-IMR value in each of the three coronary arteries. The primary endpoint was the relationship between the grade of a prolonged cTp-e interval on admission and Angio-IMR. The secondary endpoint was the relationship between the grade of a prolonged cTp-e interval on admission and in-hospital adverse cardiovascular events (composite of acute heart failure, cardiogenic shock, life-threatening arrhythmia, thrombotic events, stroke and all-cause death). The median age was 77.5 [71.0–83.0] years, and most patients were women (82.0%). The median cTp-e interval was 114.5 [91.2–147.0] ms. The patients were categorized according to the tertiles of the cTp-e interval (T1: 52.4–96.9 ms; T2: 100.1–129.1 ms; T3: 131.7–309.8 ms). There was a stepwise increment in the values of maximum Angio-IMR in each of the three coronary arteries in tertiles of the cTp-e interval (T1 vs. T2 vs. T3: 16.1 [14.7–19.3] vs. 21.8 [16.0–31.1] vs. 29.0 [27.2–31.9], P < 0.001). In-hospital adverse cardiovascular events occurred in 53 of 111 patients (47.7%). There was a stepwise increment in the incidence of in-hospital adverse cardiovascular events in tertiles of the cTp-e interval (T1 vs. T2 vs. T3: 27.1% vs. 54.1% vs. 62.2%, P = 0.007). The multivariable analysis showed that prolonged cTp-e interval (OR: 1.30; 95% CI: 1.12–1.56; P < 0.001) was independent predictors of in-hospital adverse cardiovascular events.
Conclusions
The Tpeak-Tend interval on admission reflected CMD and predicts in-hospital adverse cardiovascular events in patients with TTS.
Introduction
Takotsubo syndrome (TTS) is characterized by chest pain, electrocardiographic changes (ST-T segment modifications, deep T-wave inversion) and transient left ventricular (LV) dysfunction with apical akinesis and hypercontractile basal segments in the absence of obstructive coronary artery disease.1 Early cohorts of TTS showed a relatively favourable prognosis. However, recent studies have reported that 21.8% of these patients had a combined endpoint of serious in-hospital complications, with rates equal to or higher than those of patients with acute coronary syndrome.2, 3 Male sex, physical triggers, a high body mass index and certain comorbidities, such as chronic kidney disease, malignant disease, chronic obstructive pulmonary disease and anaemia, are poor prognostic factors for TTS.4 However, their causal association with the mechanism of TTS is still not fully understood.
In TTS, coronary microvascular dysfunction (CMD) has been proposed as a key mechanism that is caused by a catecholamine surge.5 A recent study reported that CMD was an independent predictor of the long-term clinical outcome in patients with TTS.6 Therefore, assessment of CMD can be helpful for predicting the prognosis and deciding on the course of treatment. The angiography-derived index of microvascular resistance (Angio-IMR) is used as a surrogate to assess CMD less invasively than the index of microvascular resistance.7, 8 However, Angio-IMR is only available in a few facilities because of the necessity of applying computational flow dynamics to three-dimensional modelling of the coronary artery.9
CMD may prolong repolarization markers, such as QT and the Tpeak-Tend interval, on an electrocardiogram in patients with myocardial infarction with non-obstructive coronary artery disease (MINOCA).10 Furthermore, the Tpeak-Tend interval is an in-hospital prognostic factor in patients with TTS.11 Therefore, there may be an association between CMD and repolarization markers in patients with TTS, similar to patients with MINOCA.
Determining the relationship between electrocardiographic findings and CMD in TTS could be helpful for predicting the prognosis and deciding on the course of treatment. The electrocardiography is the most commonly used technique for the diagnosis and treatment of TTS. Therefore, this study aimed to investigate the relationships between the Tpeak-Tend interval and CMD and the in-hospital prognosis in patients with TTS.
Methods
Study population and design
We performed a retrospective, observational study of consecutive patients who were admitted for TTS and underwent coronary angiography (CAG) from October 2009 to July 2023 at Kindai University Hospital. The diagnosis of TTS was based on modified Mayo Clinic criteria.12 We excluded patients who did not undergo CAG in the first 24 h of the onset of symptoms, those in whom we were unable to analyse CAG for evaluating Angio-IMR, those in whom we were unable to analyse the electrocardiogram and those who presented with previous coronary artery bypass grafting. All patients who participated in this study was treated according to the ‘International Expert Consensus Document on Takotsubo Syndrome’.13 This study was conducted in accordance with the 1964 Declaration of Helsinki and its later amendments and was approved by the Ethics Committee of Kindai University (R06-019).
Data collection
The patients' background and history were obtained from electronic medical charts in our hospital. The body mass index was calculated on the basis of height and weight at admission. Electrocardiography, echocardiography and blood test data were obtained on admission. Echocardiography was performed by a cardiologist on admission using a Xario 200 machine (Canon Medical Systems Corporation, Tochigi, Japan), and the left ventricular ejection fraction (LVEF) was measured using the Simpson method. Onset triggers were determined from interviews of patients and the presence of comorbidities.
Coronary angiography and assessment of angiography-derived index of microvascular resistance and coronary microvascular dysfunction
CAG was performed with a standard technique involving the transradial or transfemoral approach. The patients were administered intracoronary isosorbide dinitrate (1–5 mg) before initial angiography to achieve maximal vasodilation. At least six different projection views of the left coronary artery and at least four different projection views of the right coronary artery were obtained for angiographic assessment. End-diastolic pressure was assessed at the timing of left ventriculography.
The quantitative flow ratio (QFR) was measured by applying computational flow dynamics to three-dimensional modelling of the coronary artery and contrast flow by thrombolysis in the myocardial infarction frame count using the QAngio XA 3D software package (Medis Medical Imaging System, Leiden, The Netherlands).9 Two certified readers performed QFR computation in the CoreLab of the Kindai University Hospital. To assess Angio-IMR, we used the formula described in validation studies.7, 14
Angio-IMR = [Pa − (0.1 × Pa)] × QFR × [vessel length/hyperemic velocity], where Pa is the mean aortic pressure. Hyperemic velocity was calculated as 0.1 + 1.55 × Vcontrast − 0.93 × Vcontrast2. Vessel length is the segment of vessel and Vcontrast is the injection speed of contrast, which were automatically calculated by the QFR software.
There is no established specific cut-off point to define CMD in TTS. However, we consider that the widely spread cut-off point of 25 to define the presence of altered coronary microvascular resistance in patients without epicardial atherosclerosis is suitable for this population.6, 15, 16 Patients were considered to have CMD when Angio-IMR was ≥25 in at least one coronary artery. The degree of CMD was assessed by the maximum Angio-IMR value in each of the three coronary arteries.
Electrocardiography
The electrocardiogram was reviewed by two experienced independent cardiologists to evaluate the diagnosis of TTS on admission. The Tpeak-Tend interval was defined as the time interval between the peak and the end of the T wave in lead V5.17, 18 The corrected Tpeak-Tend (cTp-e) interval was corrected to the heart rate by Bazett's method.19 The end of the T wave could not be determined because low-amplitude T waves (<0.1 mV) were excluded from the analysis.
Endpoints
The primary endpoint was the relationship between the grade of a prolonged cTp-e interval on admission and Angio-IMR. The patients were categorized according to the tertiles of the cTp-e interval, and Angio-IMR was compared between the three groups. The secondary endpoint was the relationship between the grade of a prolonged cTp-e interval on admission and in-hospital adverse cardiovascular events. The incident rate of in-hospital adverse cardiovascular events was compared between the three groups.
Clinical outcomes
In-hospital adverse cardiovascular events comprising acute heart failure, cardiogenic shock, life-threatening arrhythmia, thrombotic events, stroke and all-cause death were assessed. Acute heart failure was defined as the presence of pulmonary oedema requiring oxygen therapy or a diuretic agent, while cardiogenic shock was diagnosed when there was sustained systolic pressure <90 mmHg or inotropic agents were required. Life-threatening arrhythmia was defined as any ventricular arrhythmia that resulted in syncope or hypotension and required medical intervention.
Statistical analysis
Clinical and demographic variables are presented as the mean with standard deviation for continuous variables with a normal distribution and as the median with interquartile range for continuous variables with a non-normal distribution. The normality of the distribution was assessed by the Kolmogorov–Smirnov test. Student's t-test or the Mann–Whitney U test was used for comparisons of continuous variables where appropriate. Categorical variables are expressed as frequencies and percentages. Pearson's χ2 and Fisher's exact tests were used to assess differences in categorical variables. Correlation between cTp-e interval and Angio-IMR was calculated using the Pearson's product moment correlation coefficient. Cu-toff levels of the cTp-e interval for CMD and the sensitivities and specificities of the cut-off levels were calculated by receiver operating characteristic curve analysis. A multivariate Cox proportional hazards model was used to identify independent predictors of in-hospital adverse cardiovascular events. Cohen's kappa coefficient was used for assessing agreement between two raters for Angio-IMR values.
Hazard ratios and 95% confidence intervals (CIs) were calculated. P < 0.05 was considered significant. Statistical analysis was performed using JMPv13.0 software (SAS Institute Inc., Cary, NC, USA).
Results
Study population
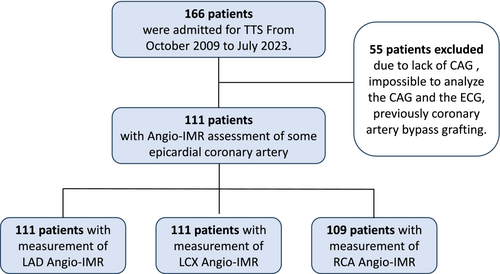
From October 2009 to July 2023, 166 patients with TTS were admitted to our hospital, and 55 were excluded. The reasons for exclusion were a lack of CAG in 22 patients, inability to analyse CAG for evaluating Angio-IMR in 21 patients (image quality and tortuosity of the coronary artery and technical issues such as a low frame rate and old data), inability to analyse the electrocardiogram in 10 patients (the end of the T wave could not be determined) and previous coronary artery bypass grafting in two patients. Therefore, 111 patients were finally included (Figure 1). The time from symptom to the start of clinical examination by specialist was median 4 h 1 min [IQR 1 h 49 min to 16 h 8 min]. Fractional flow reserve was performed in three patients, and ergonovine stress test was performed in eight patients. The baseline clinical characteristics are shown in Table 1. The median age was 77.5 [71.0–83.0] years, and most patients were women (82.0%). The most common trigger was physical stress (53.2%).
| Total patients | cTp-e interval (ms) | P <0.001 | |||
|---|---|---|---|---|---|
| Tertile 1: 79.3 [68.5–91.5] (n = 37) | Tertile 2: 114.5 [107.3–119.1] (n = 37) | Tertile3: 162.7 [144.9–188.1] (n = 37) | |||
| Age, years | 77.0 [71.0–83.0] | 77.0 [69.5–82.5] | 78.0 [72.0–83.0] | 77.0 [69.0–83.0] | 0.598 |
| Female (%) | 91 (82.0) | 29 (78.4) | 30 (81.1) | 32 (86.5) | 0.653 |
| BMI | 20.0 [17.9–22.7] | 20.4 [17.6–23.9] | 21.0 [18.1–23.9] | 19.4 [17.1–21.7] | 0.468 |
| LVEF on admission (%) | 42.8 [34.9–50.8] | 48.1 [38.4–54.9] | 41.2 [32.4–50.4] | 39.8 [30.0–45.0] | 0.002 |
| LVEDP (mmHg) | 12.0 [8.0–18.0] | 9.0 [5.5–10.5] | 12.0 [8.3–16.8] | 18.0 [13.0–21.0] | 0.007 |
| Coronary risk factor | |||||
| Hypertension (%) | 61 (55.0) | 23 (62.2) | 19 (51.4) | 19 (51.4) | 0.559 |
| Diabetes mellitus (%) | 19 (17.1) | 7 (18.9) | 9 (24.3) | 3 (8.1) | 0.169 |
| Dyslipidaemia (%) | 41 (36.9) | 15 (40.5) | 11 (29.7) | 15 (40.5) | 0.539 |
| Current smoking (%) | 10 (9.0) | 5 (13.5) | 1 (2.7) | 4 (10.8) | 0.435 |
| Trigger | |||||
| Emotional stress (%) | 15 (13.5) | 5 (13.5) | 3 (8.1) | 7 (18.9) | 0.491 |
| Physical stress (%) | 59 (53.2) | 17 (46.0) | 23 (62.2) | 19 (51.4) | 0.491 |
| Unknown (%) | 37 (33.3) | 15 (40.5) | 11 (29.7) | 11 (29.7) | 0.491 |
| ECG features on admission | |||||
| ST elevation (%) | 70 (63.1) | 22 (59.5) | 25 (67.6) | 23 (62.2) | 0.763 |
| Reciprocal change (%) | 7 (6.3) | 3 (8.1) | 3 (8.1) | 1 (2.7) | 0.543 |
| ST depression (%) | 32 (28.8) | 12 (32.4) | 9 (24.3) | 11 (29.7) | 0.735 |
| Inverted T wave (%) | 104 (93.7) | 34 (91.9) | 34 (91.9) | 36 (97.3) | 0.543 |
| QTc interval (ms) | 468.0 [410.5–520.6] | 409.6 [372.4–436.1] | 460.1 [419.5–504.2] | 493.3 [535.5–569.8] | <0.001 |
| Laboratory findings on admission | |||||
| Haemoglobin (g/dL) | 12.4 [10.7–13.9] | 11.9 [10.3–13.8] | 12.0 [10.5–13.7] | 13.1 [11.7–14.1] | 0.144 |
| eGFR (mL/min/1.73 m2) | 62.0 [44.5–85.0] | 54.0 [31.5–67.0] | 59.0 [45.0–87.5] | 73.0 [58.5–87.5] | 0.014 |
| Albumin, (g/dL) | 3.6 [2.9–4.0] | 3.6 [2.8–4.0] | 3.4 [2.9–4.0] | 3.8 [3.2–4.1] | 0.258 |
| BNP (pg/mL) | 182.0 [57.4–614.2] | 129.0 [48.6–474.0] | 165.0 [57.0–580.5] | 325.0 [74.5–869.2] | 0.133 |
| Troponin I (ng/mL) | 0.9 [0.1–3.2] | 0.4 [0.0–2.4] | 0.8 [0.1–3.3] | 0.9 [0.2–5.3] | 0.215 |
| Medication | |||||
| ACE inhibitor or ARB or ARNI | 45 (40.5) | 16 (43.2) | 10 (27.0) | 19 (51.4) | 0.095 |
| Beta-blocker | 23 (20.7) | 7 (18.9) | 8 (21.6) | 8 (21.6) | 0.947 |
- All the date are expressed as medians with interquartile range for continuous variables. P values for the comparison between three groups. We have bolded the P-values to highlight the areas where significant differences were observed.
- ACE, angiotensin-converting-enzyme, ARB, angiotensin-receptor blocker; ARNI, angiotensin receptor neprilysin inhibitor; BMI, body mass index; BNP, brain natriuretic peptide; eGFR, estimate glomerular filtration rate; LVEDP, left ventricular end-diastolic pressure; LVEF, left ventricular ejection fraction; QTc, corrected QT interval.
The median cTp-e interval was 114.5 [91.2–147.0] ms. The patients were categorized according to tertiles of the cTp-e interval (tertile [T] 1: 52.4–96.9 ms; T2: 100.1–129.1 ms; T3: 131.7–309.8 ms). There was no significant difference in age, sex, body mass index or the prevalence of coronary risk factor between the groups. The patients in T3 had a prolonged QTc interval, lower LVEF, higher LV end-diastolic pressure and higher estimated glomerular filtration rate than those in T1 and T2.
Angiography-derived index of microvascular resistance
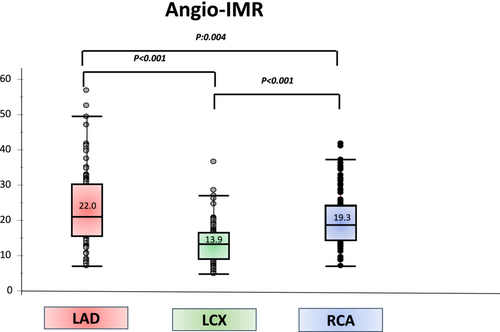
Angio-IMR analysis was performed in at least one epicardial coronary artery in 111 patients (111 patients had left anterior descending artery Angio-IMR, 111 patients had left circumflex artery Angio-IMR, and 109 had right coronary artery Angio-IMR). Angio-IMR values were higher in the left anterior descending artery than in the left circumflex and right coronary arteries (22.0 [15.8–29.6] vs. 13.9 [8.9–16.6] and 19.3 [14.2–24.2], both P < 0.001) (Figure 2).
Twenty patients were randomly selected (60 arteries in total) to establish the degree of agreement between investigators. A kappa index of 0.9636 was obtained (P < 0.001).
Relationship between the cTp-e interval and angiography-derived index of microvascular resistance and coronary microvascular dysfunction
A scatter plot of individual paired maximum Angio-IMR values in each of the three coronary arteries and the cTp-e interval are shown in Figure 3. There was a moderate positive correlation between maximum Angio-IMR values in each of the three coronary arteries and the cTp-e interval (y = 58.255 + 2.605 × x, R2 = 0.294; P < 0.001).
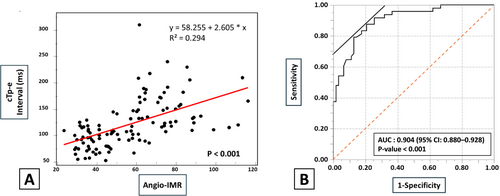
The receiver operating characteristic analysis showed that the area under the curve for the cTp-e interval as an indicator of CMD (Angio-IMR ≥ 25 in at least one coronary artery) was 0.904. The optimal cut-off value of the cTp-e interval was 115.0 ms (sensitivity, 87.5%; specificity, 79.4%; P < 0.001; 95% CI: 0.880–0.928) (Figure 3).
Relationship between the grade of a prolonged cTp-e interval and severity of coronary microvascular dysfunction
There was a stepwise increment in the maximum Angio-IMR values in each of the coronary arteries in tertiles of the cTp-e interval (T1 vs. T2 vs. T3: 16.1 [14.7–19.3] vs. 21.8 [16.0–31.1] vs. 29.0 [27.2–31.9], P < 0.001) (Figure 4).
Relationship between cTp-e interval and cardiovascular magnetic resonance
Cardiovascular magnetic resonance (CMR) was performed in 43 of 111 patients. Of the 43 patients, 15 patients (34.9%) showed late gadolinium enhancement (LGE), and 31 patients (72.1%) showed T2 high signal on CMR. There were no significant differences in cTp-e interval between LGE groups and non-LGE groups (107.2 [89.4–134.2] vs. 116.1 [94.2–144.4]; P = 0.315) and between T2 high signal groups and non-T2 high signal groups (116.2 [92.4–141.2] vs. 107.8 [90.8–118.8]; P = 0.463).
Predictors of in-hospital adverse cardiovascular events
In-hospital adverse cardiovascular events occurred in 53 of 111 patients. Of these, acute heart failure occurred in 43 patients, cardiogenic shock in 21, life-threatening arrhythmia in 10, thrombotic events in 7, stroke in 1 and death in 9. In the univariate analysis, patients who experienced adverse cardiovascular events had significantly prolonged QTc (P = 0.025) and cTp-e intervals (P < 0.001), a lower ejection fraction on admission (P < 0.001), higher LV end-diastolic pressure (P = 0.007), lower haemoglobin concentrations (P < 0.001), lower albumin concentrations (P < 0.001), higher brain natriuretic peptide concentrations on admission (P < 0.001), higher Angio-IMR values in the left anterior descending artery (P = 0.033) and the left circumflex artery (P = 0.021) and a maximum value of three vessels (P = 0.020) than patients without adverse cardiovascular events (Table 2). The incidence of in-hospital adverse cardiovascular events also did not differ significantly between LGE groups and non-LGE groups (26.7% vs. 32.1%; P = 0.709) and between T2 high signal groups and non-T2 high signal groups on CMR (22.6% vs. 50.0%; P = 0.079).
| No MACE (n = 58) | MACE (n = 53) | P | |
|---|---|---|---|
| Age, years | 78.0 [71.0–81.0] | 77.0 [69.5–84.0] | 0.970 |
| Female (%) | 48 (82.8) | 43 (81.1) | 0.824 |
| BMI | 20.6 [17.9–25.9] | 19.3 [17.8–22.5] | 0.474 |
| EF on admission (%) | 47.0 [38.9–55.0] | 38.6 [30.0–46.0] | <0.001 |
| LVEDP (mmHg) | 11.0 [7.0–15.0] | 15.0 [10.0–20.0] | 0.007 |
| Trigger | |||
| Emotional stress (%) | 10 (17.2) | 5 (9.4) | 0.280 |
| Physical stress (%) | 27 (46.6) | 32 (60.4) | 0.280 |
| Unknown (%) | 21 (36.2) | 16 (30.2) | 0.280 |
| ECG features on admission | |||
| ST elevation (%) | 34 (58.6) | 36 (67.9) | 0.310 |
| Reciprocal change (%) | 4 (6.9) | 3 (5.7) | 0.789 |
| ST depression (%) | 19 (32.8) | 17 (24.5) | 0.339 |
| Inverted T wave, (%) | 52 (89.7) | 52 (98.1) | 0.067 |
| QTc interval (ms) | 458.6 [406.3–493.0] | 487.4 [418.3–543.0] | 0.025 |
| cTp-e interval (ms) | 102.2 [79.3–126.8] | 123.8 [105.3–172.6] | <0.001 |
| Laboratory findings on admission | |||
| Haemoglobin (g/dL) | 13.4 [11.7–14.0] | 11.3 [10.3–13.3] | <0.001 |
| eGFR (mL/min/1.73 m2) | 66.5 [43.8–86.0] | 61.0 [45.8–77.1] | 0.869 |
| Albumin (g/dL) | 3.9 [3.4–4.3] | 3.2 [2.8–3.7] | <0.001 |
| BNP (pg/mL) | 112.2 [38.6–250.2] | 469.4 [111.2–956.8] | <0.001 |
| Troponin I (ng/mL) | 0.7 [0.1–2.5] | 0.9 [0.1–3.6] | 0.055 |
| Angio-IMR | |||
| Left anterior descending artery | 20.0 [15.9–28.2] | 27.0 [15.2–30.7] | 0.033 |
| Left circumflex artery | 11.8 [8.9–16.1] | 14.5 [8.7–17.7] | 0.021 |
| Right coronary artery | 18.9 [14.4–23.5] | 19.9 [13.3–24.9] | 0.528 |
| The maximum Angio-IMR of 3 vessels | 20.8 [16.1–28.2] | 27.0 [16.9–41.2] | 0.020 |
| Medication | |||
| ACE inhibitor or ARB or ARNI | 24 (41.4) | 21 (39.6) | 0.851 |
| Beta-blocker | 9 (15.5) | 14 (26.4) | 0.157 |
- All the date are expressed as medians with interquartile range for continuous variables. P values for the comparison between MACE and no MACE group. We have bolded the P-values to highlight the areas where significant differences were observed.
- ACE, angiotensin-converting-enzyme; ARB, angiotensin-receptor blocker; ARNI, angiotensin receptor neprilysin inhibitor; BMI, body mass index; BNP, brain natriuretic peptide; eGFR, estimate glomerular filtration rate; LVEDP, left ventricular end-diastolic pressure; LVEF, left ventricular ejection fraction; QTc, corrected QT interval.
Relationship between the cTp-e interval and in-hospital adverse cardiovascular events
Prolonged cTp-e interval was significantly associated with acute heart failure (129.1 [110.8–181.6] vs. 102.2 [81.3–126.1]; P < 0.001), cardiogenic shock (124.5 [111.9–175.9] vs. 108.1 [87.6–137.8]; P = 0.026) and life-threatening arrhythmia (148.8 [107.5–181.7] vs. 111.1 [90.3–138.9]; P = 0.007).
There was a stepwise increment in the incidence of in-hospital adverse cardiovascular events in tertiles of the cTp-e interval (T1 vs. T2 vs. T3: 27.1% vs. 54.1% vs. 62.2%, P = 0.007) (Figure 5). On the other hands, the cTp-e interval on admission was significantly prolonged compared with the time at discharge and the time of first visit to our hospital after discharge (114.5 [91.2–145.3] vs. 82.0 [68.0–96.3] vs. 71.0 [61.2–85.2], both P < 0.001). (Figure S1) The prolongation of the cTp-e interval gradually shortened over time. Figure S2 showed the comparison between three groups according to the tertiles of the cTp-e interval on admission at each timing. There was a significant difference in cTp-e interval between T3 and T1 at discharge (86.1 [67.5–96.3] vs. 78.7 [60.0–93.2], P = 0.018), but no significant differences between three groups at the time of first visit to our hospital after discharge (Figure S2). These findings indicate that the prolonged cTp-e interval at admission, which reflects the increased incidence of CMD and in-hospital adverse cardiovascular events, gradually improved during the chronic phase.
Multivariate analysis of predictors for in-hospital adverse cardiovascular events
The multivariable analysis showed that brain natriuretic peptide concentrations (odds ratio [OR]: 1.02; 95% CI: 1.00–1.03; P = 0.011), albumin concentrations (OR: 0.90; 95% CI: 0.81–0.99; P = 0.031), haemoglobin concentrations (OR: 0.96; 95% CI: 0.92–0.98; P = 0.007), the cTp-e interval (OR: 1.30; 95% CI: 1.12–1.56; P < 0.001) and the LVEF (OR: 0.94; 95% CI: 0.89–0.99; P = 0.019) on admission were independent predictors of in-hospital adverse cardiovascular events (Table 3).
| Variables | Univariate analysis | Multivariate analysis | ||
|---|---|---|---|---|
| OR (95% CI) | P | OR (95% CI) | P | |
| Female | 1.12 (0.42–2.94) | 0.824 | 1.52 (0.36–6.45) | 0.574 |
| Trigger | 2.37 (0.72–3.56) | 0.276 | 1.38 (0.23–8.23) | 0.860 |
| BNP on admission (per 10 pg/mL) | 1.02 (1.01–1.04) | <0.001 | 1.02 (1.00–1.03) | 0.011 |
| Alb on admission (per 0.1 g/dL) | 0.88 (0.83–0.94) | <0.001 | 0.90 (0.81–0.99) | 0.031 |
| Hb on admission, (per 0.1 g/dL) | 0.97 (0.94–0.99) | <0.001 | 0.96 (0.92–0.98) | 0.007 |
| cTp-e interval (per 10 ms) | 1.21 (1.10–1.35) | <0.001 | 1.30 (1.12–1.56) | <0.001 |
| LVEF on admission | 0.93 (0.89–0.96) | <0.001 | 0.94 (0.89–0.99) | 0.019 |
- We have bolded the P-values to highlight the areas where significant differences were observed.
- BNP, brain natriuretic peptide; CI, confidence interval; LVEF, left ventricular ejection fraction; OR, odds ratio.
Discussion
To the best of our knowledge, this is the first study to evaluate the relationship between electrocardiographic findings of the cTp-e interval and CMD in patients with TTS. The main findings of our investigation were as follows: (1) The cTp-e interval was markedly prolonged, in TTS patients with severe CMD; (2) the severity of CMD could be predicted from electrocardiographic findings without invasive assessment by measuring the cTp-e interval; and (3) the incidence of in-hospital adverse cardiovascular events was associated with the degree of cTp-e prolongation, and CMD was implicated in its pathogenesis.
The mechanism of the relationship between a prolonged cTp-e interval and CMD in patients with TTS has not been fully investigated. Asil et al. reported that the minimal decrease in conduction velocity and delayed recovery of excitability in ischaemic myocardium at the acute phase and, K+, Na+ and Ca2+ imbalance occurs in intracellular and extracellular components of the myocardium at the reperfusion period affect repolarization markers in the electrocardiogram, such as the Tpeak-Tend and QT intervals, in patients with MINOCA.20 Myocardial ischaemia that develops after CMD may affect repolarization markers in the electrocardiogram in patients TTS by a mechanism similar to MINOCA.10
The association between a prolonged cTp-e interval and in-hospital adverse cardiovascular events is related to CMD in TTS, but the detailed mechanism of its prognostic effect is not fully understood. La Rosa et al. reported that a prolonged Tpeak-Tend interval was associated with ventricular arrhythmias in patients with TTS.21 In our study, patients who presented with life-threatening arrhythmia had a significantly prolonged cTp-e interval compared with those without life-threatening arrhythmia, similar to previous studies.21 Therefore, a prolonged cTp-e interval is generally believed to be associated with fatal arrhythmias. However, a recent meta-analysis reported an association between a prolonged Tpeak-Tend interval and heart failure and cardiovascular death, regardless of TTS.22 Piccirillo et al. reported that the Tpeak-Tend interval was associated with the severity of heart failure and mortality and morphological and structural alterations of the myocardium, such as abnormality of K+, Na+ and Ca2+ channels and transport mechanisms.23 This situation may result in specific modifications of repolarization markers in the electrocardiogram in patients with acute heart failure. A study showed that structural alterations of the myocardium due to myocardial oedema associated with CMD-related heart failure may have contributed to prolongation of the Tpeak-Tend interval in patients with TTS.24 Furthermore, a prolonged cTp-e interval was associated not only with the degree of CMD but also with factors related to in-hospital adverse cardiovascular events, such as the LVEF and LV end-diastolic pressure. Therefore, the cTp-e interval is considered to be an important predictor of all adverse cardiovascular events.
The optimal cut-off value for the cTp-e interval as an indicator of ventricular arrhythmia has been reported to be 113.6 ms in the general population, but no specific cut-off value exists because the cTp-e interval varies by disease and article. The optimal cut-off value of the cTp-e interval as an indicator of CMD was 115.0 ms in this study, as shown in Figure 3. The cut-off value of 115.0 ms was considered reliable as an indicator of poor prognostic factors because of the liner relationship between cTp-e interval and CMD and between cTp-e interval and in-hospital adverse events, the close cut-off value of 113.6 ms in previous studies and the high sensitivity (87.5%) and specificity (79.4%) from receiver operating characteristic analysis.
CMD is a major mechanism involved in worsening of the prognosis in patients with TTS and is reflected in the cTp-e interval on admission. The evaluation of CMD in patients with TTS could be useful to identify patients who have a higher risk of developing adverse cardiovascular events and could lead to a closer clinical examination and more rigid treatment plan for them. Assessment of the cTp-e interval on an electrocardiogram at admission can stratify the severity of CMD without the use of invasive tests and may contribute to the prognosis of TTS.
Study limitations
There are several limitations to our study. First, this was a single-centre, retrospective study, and thus, the results should be considered hypothesis-generating only. Second, Angio-IMR has been validated as a pressure-wire-free alternative to IMR for evaluating CMD, but it is only a surrogate method and does not directly assess the coronary microcirculation. Third, there is no specific cut-off point of Angio-IMR to define CMD in patients with TTS. EAPCI consensus document on ischemia with no obstructive coronary arteries defines values of IMR ≥25 units as indicative of CMD.15 In addition, JordiSans-Rosell et al. reported that CMD was defined as an NH-IMR angio ≧25 and CMD was an independent predictor of the long-term clinical outcome in patients with TTS.6 Based on previous studies, we consider that the widely used cut-off point of 25 to define the presence of CMD in patients without epicardial atherosclerosis could be suitable for this population. Nevertheless, the lack of an established cut-off point in this setting could affect our results. Further research is required to determine the exact Angio-IMR cut-off values for evaluating CMD in patients with TTS.
Conclusions
The cTp-e interval on admission reflected the severity of CMD and predicts in-hospital adverse cardiovascular events in patients with TTS.
Acknowledgements
We thank all of the staff of Kindai University Hospital Department of Cardiology. We thank Ellen Knapp, PhD, from Edanz (https://jp.edanz.com/ac) for editing a draft of this manuscript.
Conflict of interest
None declared.
Funding
The authors did not receive any funding for this work.


