Swollen heart in COVID-19 patients who progress to critical illness: a perspective from echo-cardiologists
Drs. Liu and Xie contribute equally to this work.
Abstract
Aims
Cardiac complications are common and associated with mortality in critically ill patients with COVID-19; however, the diagnostic and prognostic implications of critical care echocardiography (CCE) have not been studied.
Methods and results
A cohort of 43 patients with COVID-19 who were in the intensive care unit (ICU) underwent bedside CCE during their disease course. Demographic, clinical, and survival data were collected. The echocardiographic analyses revealed high frequencies of pericardial effusion (90.7%), increased left ventricular mass index (60.5%), elevated relative wall thickness (76.7%), and reduced left ventricular stroke volume index (LVSVi; 53.5%) and cardiac index (51.2%). Twenty-two (51.2%) patients died in the ICU. In multivariate Cox regression, the strongest predictor of in-ICU death was decreased cardiac index [hazard ratio (HR), 0.67, 95% confidence interval (CI), 0.45–0.98; P = 0.041], after adjusting for male sex, shock status, high-sensitivity cardiac troponin I, and N-terminal pro-B-type natriuretic peptide. Negative associations with mortality were observed for LVSVi (HR, 0.91, 95% CI 0.85–0.96; P = 0.002), tricuspid annular plane systolic excursion (HR, 0.74, 95% CI 0.64–0.84; P < 0.001), and S′ (HR, 0.78, 95% CI 0.69–0.88; P < 0.001). Kaplan–Meier analyses indicated that reductions in LVSVi, cardiac index, TAPSE, and S′ were associated with a shorter survival time.
Conclusions
Pericardial effusion and increased ventricular mass in COVID-19 might indicate a swollen heart. Both left and right heart dysfunction and a reduced cardiac index may lead to an increased risk of mortality. Clinicians should pay special attention to cardiac haemodynamic disorders in critical patients with COVID-19.
Introduction
Since the novel coronavirus disease (COVID-19) became a public health emergency of international concern, it has been accepted that this disease not only attacks the lungs but also involves several other organs, including the heart.1 Although cardiovascular complications are seen in only 4.2% of COVID-19 cases, 18.3% of COVID-19 deaths can be attributed to them.2 The common co-morbidities in COVID-19 patients include hypertension (8–56.6%), obesity (41.7%), diabetes (19–33.8%), and coronary heart disease (8–11%); and hypertension and coronary artery disease both increase the risks of intensive care unit (ICU) requirement and death.3, 4 However, limited imaging and pathological data have elucidated the details of what happens to the heart.
Bedside critical care echocardiography (CCE) is a reasonable choice to provide information when cardiac involvement is suspected and cardiac magnetic resonance (CMR) or myocardial biopsy is infeasible in critically ill COVID-19 patients, especially for evaluating cardiac function and haemodynamics. The diagnostic and prognostic implications of CCE for COVID-19 have not been studied. In this study, we focused on the following two aims: (i) to investigate the echocardiographic characteristics of critical patients with COVID-19 and (ii) to explore independent echocardiographic predictors of mortality.
Methods
Patient characteristics
From 26 January 2020 to 15 April 2020, a national medical team from Peking Union Medical College Hospital (PUMCH) provided medical care for critical patients with COVID-19 in a newly built quarantined ICU at Tongji Hospital, Huazhong University of Science and Technology, Wuhan. Fifty-six adults with a confirmed diagnosis of COVID-19 underwent transthoracic echocardiography, while 13 patients were excluded (see Figure S1 for details). Demographic, clinical, and treatment data were collected from 43 patients. Abnormal high-sensitivity cardiac troponin I (hs-cTnI) was defined as exceeding the 99th percentile upper reference limit (28 ng/L in this study). The pericardial effusion (PE) was defined as fluid sonolucent area in the pericardial cavity at least 3 mm and at least two views on the end-diastole phase. The direct cause of death was recorded for all deceased patients. The study protocol was approved by the ethics committee of PUMCH. Written informed consent was waived due owing the rapid emergence of this infectious disease. No patient information is potentially identifiable in images or data.
Echocardiography
Bedside CCE was performed by two well-trained echo-cardiologists using a GE Venue with an S12 transducer (GE Medical Systems, USA) according to the protocols of the European Association of Cardiovascular Imaging.5 Consecutive two-dimensional (2D) tissue Doppler images and colour Doppler images were stored and later analysed independently by two senior echocardiography groups at the PUMCH and the Anzhen Hospital of Capital Medical University. The observers were blinded to the status of each subject. Measurements were repeated 48 h later in a randomly selected group of 10 patients to determine intra-observer variability. Tom-Tec software (Image-Arena, Tom-Tec imaging system, Germany) was chosen to analyse the dataset.
Volume and function of the left heart
The left ventricular (LV) echocardiographic parameters included LV end-diastolic dimension (LVEDd), LV end-systolic dimension, LV outflow tract (LVOT), LV mass index (LVMi), LV end-diastolic volume index, LV end-systolic volume index, LV fraction shortening, and LV ejection factor (LVEF) determined by a Teich method in M-M mode, by a Simpson method with a biplane approach, and by strain echocardiography. The velocity time integral and the stroke volume (SV) of the LVOT were acquired by artificial intelligence (AI) in the GE Venue software to avoid manual tracing errors. Then, the cardiac index was computed by multiplying the LVSV index (LVSVi) by the heart rate. Relative wall thickness (RWT) was calculated as LV posterior wall end-diastolic thickness × 2/LVEDd. To identify diastolic dysfunction, lateral and septal E′ velocity, the E/E′ ratio, the left atrial end-systolic volume index (LAVi), E wave velocity, the transmitral E/A ratio, E wave deceleration time (DT), and the left atrial area index were collected.
Volume and function of the right heart
Two-dimensional echocardiography was performed with apical and subxiphoid four-chamber views to focus on the right atrium and right ventricle (RV). The right atrial volume index and estimated right atrial pressure (RAP) were recorded, the latter of which was defined as 3, 8, or 15 mmHg according to the diameter and respiratory collapse of the inferior vena cava computed by the AI function of the Venue software (Figure S2). The RV parameters included thickness of the RV free wall, RV diameter (RVD), proximal diameter of RV outflow tract, RV end-diastolic area index, RV end-systolic area index, and fractional area change (FAC) determined by a 2D approach and by strain echocardiography in the four-chamber view. Pulmonary artery diameters and pulmonary artery systolic pressure (PASP) were also recorded, the latter of which was derived from the RAP and the velocity of tricuspid valvular regurgitation (TR) (PASP = 4TR2 + RAP). To evaluate RV systolic function, tricuspid annular plane systolic excursion (TAPSE) and tricuspid lateral annular s′ velocity (S′) were measured.
Strain echocardiography
To present the global and regional systolic function quantitatively, 2D speckle tracking-derived global longitudinal strain (GLS), global radial strain, global circumferential strain, and segmental strains of the RV free wall were recorded. All the measurements used a standardized operating procedure that has been extensively described (File S1).
Statistical analysis
Continuous variables are expressed as the mean ± SD or median (inter-quartile range) according to a normal or non-normal distribution; and an independent samples t-test and the Wilcoxon rank sum test, respectively, were used to analyse the differences between survivors and non-survivors. Categorical variables are expressed as percentages and are compared by a χ2 or Fisher's exact test. To identify imaging determinants of mortality, Cox regression was performed for univariate and multivariate analyses. The independent risk factors in the Cox regression were also tested in the Kaplan–Meier survival analysis using log-rank tests. The reproducibility of echocardiographic measurements was described by bias (95% confidence interval) in Bland–Altman analyses, and intra-class correlations (ICCs) were evaluated in 10 datasets to determine intra-observer and inter-observer variability. A two-tailed P value < 0.05 was defined as significant. All analyses were performed using SPSS version 21.0 (IBM, Armonk, NY).
Results
Clinical descriptions
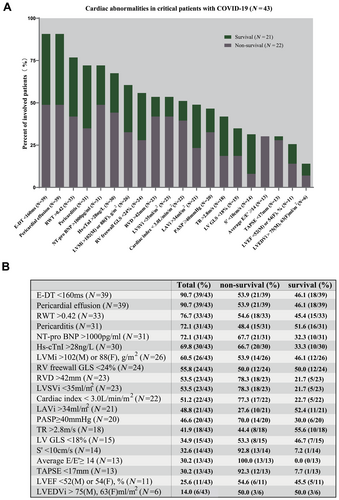
A total of 43 critical patients with COVID-19 and acute respiratory distress syndrome (ARDS) were enrolled in our study. The mean age was 64.5 ± 10.0 years, and 51.2% of patients were male. Prior mild hypertension, smoking, diabetes, and coronary artery disease were seen in 44.2%, 37.2%, 27.9%, and 11.6% of involved cases, respectively. Of these patients, 53.5% progressed to septic shock, and 51.2% needed vasopressors to maintain organ perfusion. Thirty patients exhibited elevated levels of hs-cTnI on admission, and 31 patients had peak values of N-terminal pro-B-type natriuretic peptide (NT-proBNP) higher than 1000 pg/mL (Figure 1). Most of these patients received anticoagulation therapy (31, 72.1%) and invasive mechanical ventilation (39, 90.7%) (Table 1), the latter of which contained therapy of high-level positive end-expiratory pressure because of serious lung injury and ARDS.
| All patients (n = 43) | Non-survivors (n = 22) | Survivors (n = 21) | P value | |
|---|---|---|---|---|
| Demographic parameters | ||||
| Age (years) | 64.5 ± 10.0 | 64.9 ± 10.4 | 64.1 ± 9.8 | 0.82 |
| Male | 22 (51.2%) | 15 (68.2%) | 7 (33.3%) | 0.022 |
| Prior coronary artery disease | 5 (11.63%) | 4 (18.2%) | 1 (4.8%) | 0.35 |
| Pre-existing heart failure | 3 (7.0%) | 2 (9.1%) | 1 (4.8%) | 1.00 |
| Hypertension | 19 (44.2%) | 9 (40.9%) | 10 (47.6%) | 0.66 |
| Diabetes | 12 (27.9%) | 5 (22.7%) | 7 (33.3%) | 0.44 |
| Smoking | 16 (37.2%) | 9 (40.9%) | 7 (33.3%) | 0.61 |
| Clinical characteristics | ||||
| Symptom onset to ICU (days) | 22.0 ± 8.8 | 20.0 ± 8.0 | 24.1 ± 9.2 | 0.13 |
| Heart rate (b.p.m.) | 93.2 ± 14.4 | 95.4 ± 17.5 | 91.0 ± 10.3 | 0.33 |
| Shock status | 23 (53.5%) | 16 (72.7%) | 7 (33.3%) | 0.010 |
| Mean blood pressure (mmHg) | 94.8 ± 14.1 | 94.5 ± 13.0 | 95.0 ± 15.5 | 0.92 |
| Lymphocytes (×109/L) | 0.66 ± 0.37 | 0.58 ± 0.26 | 0.74 ± 0.45 | 0.16 |
| eGFRa (mL/min) | 78.0 (60.1–108.2) | 75.9 (55.3–92.9) | 78.5 (62.7–120.3) | 0.41 |
| Hs-CRPa (mg/L) | 125.4 (40.0–194.6) | 157.9 (79.4–260.4) | 44.1 (14.5–126.3) | 0.005 |
| D-dimera (mg/L) | 8.9 (2.7–21.0) | 20.8 (7.3–21.0) | 2.9 (1.8–9.0) | 0.002 |
| Hs-cTnIa (ng/L) | 64.7 (24.1–217.5) | 160.7 (66.2–294.6) | 25.9 (14.5–57.1) | 0.006 |
| NT-proBNPa (ng/L) | 3079.0 (892.0–7465.0) | 5804.0 (2439.8–14 347.8) | 908.0 (580.0–4088.0) | 0.001 |
| Supporting treatment | ||||
| Invasive mechanical ventilation | 39 (90.7%) | 20 (90.9%) | 19 (90.5%) | 0.96 |
| Prone position ventilation | 22 (51.2%) | 12 (54.6%) | 10 (47.6%) | 0.65 |
| Extracorporeal membrane oxygenation | 4 (9.3%) | 3 (13.6%) | 1 (4.7%) | 0.61 |
| Blood purification therapy | 11 (25.6%) | 7 (31.8%) | 4 (19.1%) | 0.34 |
| Intravenous Immunoglobulin | 30 (69.8%) | 17 (77.3%) | 13 (61.9%) | 0.27 |
| Intravenous methylprednisolone | 25 (58.1%) | 15 (68.2%) | 10 (47.6%) | 0.17 |
| Vasopressors | 22 (51.2%) | 15 (68.2%) | 7 (33.3%) | 0.022 |
| Anticoagulation | 31 (72.1%) | 17 (77.3%) | 14 (66.7%) | 0.44 |
- P values present the differences between survivors and non-survivors.
- eGFR, estimated glomerular filtration rate.
- a Non-normal distribution.
Echocardiographic manifestations
A small to middle amount of PE was seen in almost all the patients (39, 90.7%) (Figures 1 and S3), the majority of whom were suspected to have pericarditis (Figure S3C, Videos S1 and S2), while isolated PE was rare and no cardiac tamponade or massive PE was observed.
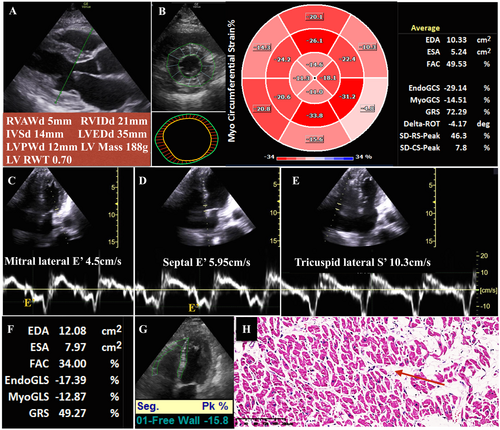
In LV structural measurements (Table 2), only six patients presented with LV enlargement (14.0%), while increased RWT was noticed in nearly 3/4 of involved patients, with a mean value of 0.8 (normal range ≤ 0.42)5 (Figures 1, 2, and S4). In addition, LVMi exceeded the normal range in 26 patients (>102 for men or >88 for women),5 which was even higher in deceased patients (Figures 1, 2, and S4). Heart failure with reduced and middle-range LVEF was only diagnosed in three and six patients, respectively; however, decreased LVSVi by Doppler was frequently reported, as was reduced cardiac index (Figures 1 and S5). Notably, LV-GLS, especially myocardial GLS (Figures S5 and S6, Video S3), was decreased in 15 patients (Figure 1). Among LV diastolic functional quantitative parameters, peak TR velocity > 2.8 m/s (Figure S6B), E-DT < 160 ms, average E/E′ ratio ≥ 14 (Figure S7), and LAVi > 34 mL/m2 were frequently reported (Figure 1). See Table 2 for more details about LV size and function and Table S1 for myocardial strain.
| All patients (n = 43) | Non-survivors (n = 22) | Survivors (n = 21) | P value | |
|---|---|---|---|---|
| Left heart | ||||
| LVEDd (mm) | 43.0 ± 8.6 | 42.9 ± 8.5 | 43.0 ± 8.8 | 0.95 |
| LVESd (mm) | 27.9 ± 6.9 | 28.4 ± 7.8 | 27.3 ± 5.9 | 0.61 |
| LVEDVi (mL/m2) | 44.6 ± 22.1 | 45.2 ± 21.0 | 43.9 ± 23.7 | 0.84 |
| LVESVi (mL/m2) | 16.6 ± 12.0 | 17.6 ± 11.6 | 15.5 ± 12.6 | 0.58 |
| LVEF—Simpson (%) | 62.5 ± 11.8 | 60.3 ± 13.5 | 64.7 ± 10.3 | 0.24 |
| LVEF ≤ 40% | 3 (7.0%) | 1 (4.8%) | 2 (9.1%) | 1.00 |
| E wave velocity (cm/s) | 74.0 ± 19.4 | 70.7 ± 17.9 | 78.8 ± 21.4 | 0.45 |
| Mitral valvular lateral E′ (cm/s) | 7.9 ± 3.7 | 7.5 ± 4.2 | 8.2 ± 3.1 | 0.53 |
| Mitral valvular septal E′ (cm/s) | 6.4 ± 3.9 | 7.2 ± 4.9 | 5.8 ± 2.6 | 0.26 |
| Average E/E′ ratio | 14.4 ± 7.9 | 18.5 ± 8.9 | 10.0 ± 2.6 | 0.001 |
| LVOT VTI (cm) | 19.0 ± 4.6 | 18.5 ± 5.0 | 19.4 ± 4.2 | 0.50 |
| LVSVi (mL/m2) | 33.3 ± 9.6 | 28.2 ± 7.9 | 38.5 ± 8.3 | <0.001 |
| Cardiac index (L/min/m2) | 3.0 ± 1.0 | 2.5 ± 1.0 | 3.5 ± 0.9 | 0.001 |
| RWT ratio | 0.8 ± 0.4 | 0.9 ± 0.4 | 0.7 ± 0.3 | 0.12 |
| IVSd (mm) | 11.0 ± 2.7 | 11.3 ± 3.0 | 10.6 ± 2.3 | 0.42 |
| LVPWd (mm) | 10.7 ± 2.6 | 11.2 ± 2.8 | 10.1 ± 2.2 | 0.15 |
| LVMi (g/m2) | 113.0 ± 38.2 | 119.3 ± 35.9 | 106.4 ± 40.2 | 0.38 |
| LAVi (mL/m2) | 37.8 ± 23.4 | 33.6 ± 20.4 | 42.2 ± 26.0 | 0.24 |
| Right heart | ||||
| RVDbasal (mm) | 36.4 ± 7.2 | 38.6 ± 7.8 | 34.3 ± 6.0 | 0.049 |
| RVDmedial (mm) | 26.9 ± 6.8 | 28.4 ± 8.0 | 25.4 ± 5.2 | 0.15 |
| RVDbase-apex (mm) | 66.4 ± 10.6 | 69.6 ± 9.2 | 63.2 ± 11.1 | 0.049 |
| RVOT (mm) | 28.9 ± 5.3 | 27.0 ± 5.6 | 30.6 ± 4.4 | 0.23 |
| RV free wall thickness (mm) | 5.5 ± 0.9 | 5.5 ± 1.0 | 5.5 ± 0.8 | 0.95 |
| RVEDAi (cm2/m2) | 9.0 ± 2.9 | 9.2 ± 3.6 | 8.8 ± 2.2 | 0.63 |
| RVESAi (cm2/m2) | 4.5 ± 2.1 | 4.5 ± 2.3 | 4.4 ± 1.9 | 0.92 |
| Pulmonary artery (mm) | 22.9 ± 3.0 | 22.7 ± 2.8 | 23.0 ± 3.2 | 0.78 |
| TAPSE (mm) | 19.0 ± 3.7 | 16.3 ± 2.2 | 21.8 ± 2.9 | <0.001 |
| FAC (%) | 47.2 ± 10.9 | 44.8 ± 10.9 | 49.3 ± 10.7 | 0.19 |
| Tricuspid lateral S′ (cm/s) | 11.5 ± 4.5 | 8.8 ± 0.04 | 14.6 ± 2.8 | <0.001 |
| Lateral E′ (cm/s) | 11.3 ± 6.0 | 11.1 ± 7.3 | 11.6 ± 4.4 | 0.83 |
| Tricuspid regurgitation velocity (m/s) | 2.7 ± 0.6 | 2.9 ± 0.7 | 2.6 ± 0.4 | 0.08 |
| PASP (mmHg) | 39.8 ± 15.3 | 45.1 ± 16.5 | 34.4 ± 12.0 | 0.02 |
| RAVi (mL/m2) | 28.5 ± 15.0 | 29.1 ± 13.8 | 27.7 ± 16.4 | 0.82 |
| Right atrial pressure (mmHg) | 9.9 ± 5.6 | 11.9 ± 4.9 | 7.9 ± 5.7 | 0.040 |
- P values present the differences between survivors and non-survivors.
- LVEDVi, left ventricular end-diastolic volume index; LVESd, left ventricular end-systolic dimension; LVESVi, left ventricular end-systolic volume index; RAVi, right atrial volume index; RVEDAi, right ventricular end-diastolic area index; RVESAi, right ventricular end-systolic area index; RVOT, right ventricular outflow tract; VTI, velocity time integral.
In addition, RV and RA enlargement was reported with high frequencies (Figure S8, Video S4). Strikingly, the majority of critical COVID-19 patients presented with thickened RV free walls (Tables 2, Figures S3B and S4). Moreover, nearly 50% of them featured pulmonary hypertension (Figures 1 and S6B) and RV systolic dysfunction, the latter of which presented as decreased S′ and TAPSE (Figures 1 and S9).
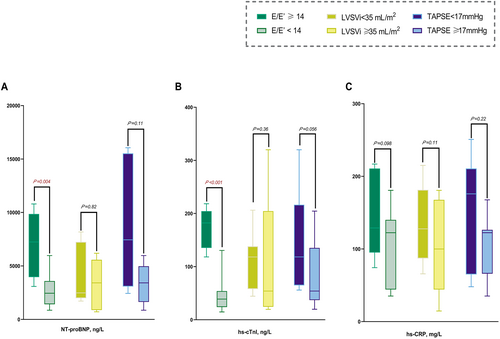
Correlations of clinical biomarkers with cardiac functional variables were further investigated. The results showed significantly higher levels of NT-proBNP and hs-cTnI in patients with elevated average E/E′ (Figure 3).
Outcomes and predictors
Forty-three patients underwent a median follow-up of 33 days (9–55 days) after echocardiography, and 22 deaths were recorded in the hospital (direct causes of death: 14 septic shock, six respiratory failure, one ventricular arrhythmia, and one cardiac arrest). Five patients underwent autopsies, with similar findings in the heart: remarkable myocardial interstitial oedema was common, with minimal inflammatory cells and enlargement of cardiac myocytes (Figure 2).
Non-survivors were reported to be male more frequently, with more frequent septic shock and higher levels of high-sensitivity C-reactive protein (hs-CRP), D-dimer, hs-cTnI, and NT-proBNP (Table 1). Among echocardiographic parameters, mitral average E/E′ was significantly increased, while LVSVi and cardiac index were decreased in the non-survivors (Table 2). In addition, RVDbasal, RVDbase-apex, PASP, and estimated RAP were higher in the non-survivors than in the survivors. Consistently, TAPSE and S′ were decreased significantly in deceased patients, reflecting impaired RV systolic function (Table 2). There is no significant difference of invasive mechanical ventilation, LVMi, RWT, PE (18/21 vs. 21/22), or pericarditis (16/21 vs. 15/21) between survivors and non-survivors.
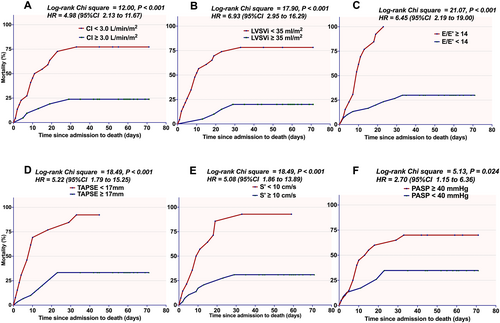
The variables with significant differences were included in the Cox regression model. The univariate analyses revealed that the odds of in-hospital death were higher in male patients and in patients with shock status, higher levels of hs-cTnI, NT-proBNP, and elevated RVDbase-apex, E/E′, and PASP, while LVSVi, cardiac index, TAPSE, and S′ were negatively associated with mortality. These variables were then adjusted for sex, shock status, hs-cTnI, and NT-proBNP in the multivariate analyses, and the significant predictors of mortality were LVSVi, cardiac index, TAPSE, and S′ (Table 3). The following Kaplan–Meier analyses showed similar results: decreased LVSVi, cardiac index, TAPSE, and S′, as well as increased average E/E′ and PASP, were associated with shorter survival times (Figure 4).
| Univariate | Multivariate adjusteda | |||
|---|---|---|---|---|
| HR (95% CI) | P value | HR (95% CI) | P value | |
| Clinical parameters | ||||
| Sex (female) | 0.34 (0.14–0.85) | 0.020 | ||
| Septic shock | 2.97 (1.16–7.62) | 0.024 | ||
| Hs-CRP > 10 mg/L | 2.06 (0.48–8.85) | 0.32 | ||
| D-dimer > 2 mg/L | 30.36 (0.40–2283.59) | 0.12 | ||
| Hs-cTnI > 28 ng/L | 6.83 (1.59–29.40) | 0.010 | ||
| NT-proBNP > 1000 ng/L | 12.52 (1.68–93.38) | 0.014 | ||
| Vasopressors | 2.53 (1.03–6.23) | 0.043 | ||
| Echocardiographic parameters | ||||
| RVDbasal | 1.07 (1.00–1.14) | 0.057 | 1.01 (0.95–1.08) | 0.72 |
| RVDbase-apex | 1.04 (1.00–1.09) | 0.049 | 1.02 (0.98–1.06) | 0.41 |
| Average E/E′ ratio | 1.08 (1.03–1.12) | 0.001 | 1.04 (0.99–1.10) | 0.15 |
| LVSVi | 0.91 (0.87–0.96) | <0.001 | 0.91 (0.85–0.96) | 0.002 |
| Cardiac index | 0.61 (0.43–0.86) | 0.005 | 0.67 (0.45–0.98) | 0.041 |
| TAPSE | 0.75 (0.66–0.85) | <0.001 | 0.74 (0.64–0.84) | <0.001 |
| S′ | 0.78 (0.70–0.87) | <0.001 | 0.78 (0.69–0.88) | <0.001 |
| PASP | 1.04 (1.01–1.07) | 0.010 | 1.01 (0.97–1.05) | 0.63 |
- CI, confidence interval; HR, hazard ratio.
- a Each echocardiographic parameter was adjusted for sex, shock status, hs-cTnI, and NT-proBNP in the multivariate Cox regression analysis (backward method).
Inter-observer and intra-observer variability
The inter-observer and intra-observer variability results for CCE measurements in Bland–Altman analysis are shown in Figures S10 and S11. The intra-observer ICCs of E/E′, S′, TAPSE, PASP, the cardiac index, and LVSVi were 0.92, 0.93, 0.92, 0.93, 0.94, and 0.93, respectively, and the inter-observer ICCs for these parameters were 0.95, 0.91, 0.93, 0.95, 0.95, and 0.94, respectively.
Discussion
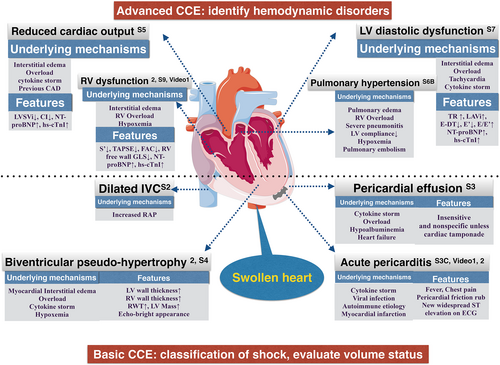
We presented CCE details of critical COVID-19 patients and explored their associations with clinical outcomes. Although cardiovascular complications are common and correlated with mortality in critical COVID-19 patients, no previous studies have described basic and advanced CCE systematically. We summarize the CCE findings in COVID-19 patients, as follows: (i) swollen heart, characterized by overwhelming cardiac weight and increased biventricular thickness immersed in the PE, are observed; (ii) decreased cardiac output and increased LV filling pressure are major cardiac haemodynamic features; and (iii) decreased RV systolic function is more common than LV systolic dysfunction, with RV enlargement and pulmonary hypertension (Figure 5).
Swollen heart
PE is the most common abnormality, and most patients have mild/moderate PE without specific symptoms. In a cohort study from Wuhan, PE was reported in 22 out of 112 COVID-19 patients, with a mean depth of 6.2 mm. Compared with non-severe cases (n = 3), severe cases (n = 19) were more likely to suffer from PE (6.7% vs. 28.4%, P < 0.01). More patients with adverse events than without presented with PE (13/31 vs. 9/81, P < 0.01).6 In fact, we noticed non-calcified pericardial thickening and inflammatory exudation adhering to the visceral pericardium, which are features of pericarditis. Based on the nature of the sustained inflammatory response and cytokine storm, including CRP, interleukin-6, and interferon-γ to tumour necrosis factor-α,7-9 the presence of pericarditis is reasonable in COVID-19.
Another outstanding finding in these critical COVID-19 patients is the presence of thickened biventricular walls and increased LVMi. LVMi is an imaging variable for the diagnosis of LV hypertrophy, and the calculated RWT is useful to categorize an LV mass increase as concentric (>0.42) or eccentric (≤0.42) hypertrophy.5 The typical characteristics of concentric remodelling are increased RWT with normal LVMi, which is usually observed in hypertension. However, we noticed elevations of both LVMi and RWT, while patients with blood pressure exceeding 160/100 mmHg were excluded. Hence, it is interesting to discuss the appearance of ‘biventricular pseudo-hypertrophy’. In a recent study of 120 patients, an elevated mean value of LVMi (142.8 ± 31.4 g/m2) was documented.10 Furthermore, a CMR patient exhibited a thickened LV wall with diffuse late gadolinium enhancement and biventricular walls with myocardial interstitial oedema.11 From the autopsy study of our five patients, consistent remarkable myocardial interstitial oedema was observed (e.g. Figure 2). Therefore, both CMR and pathologic evidence were consistent with the CCE characteristic of biventricular pseudo-hypertrophy.
Functional and haemodynamic disorder
CCE is a precise and accurate method for measuring cardiac output in critically ill patients.12 A cohort including 262 ICU patients with severe sepsis or septic shock revealed that reduced LVSVi was an independent predictor of both in-hospital mortality and overall mortality.13 In our study, more than half of the patients developed septic shock. Although the LVEFs were still within normal ranges in these patients, decreased LVSVi and cardiac indexes were observed, potentially indicating concomitant cardiogenic shock. Moreover, LVSVi and cardiac index were negatively correlated with in-hospital mortality in our study. This is the first investigation to consider LVSVi and cardiac index as predictors of mortality in critical patients with COVID-19.
Doppler measurement of CCE could also provide information about cardiac pressure or flow, such as mitral E/E′, which reflects the LV end-diastolic filling pressure. Diastolic dysfunction is common and associated with increased mortality in sepsis13, 14; however, a previous study reported normal E/E′ and no significant difference between survivors and non-survivors with COVID-19.10 In this study, we discovered an elevated E/E′ ratio in 13 patients, none of whom survived, and patients with a normal E/E′ ratio had a better prognosis. The values of the transmitral E/A ratio were limited because of the integration of E and A waves in patients with rapid heart rates.
The right heart is vulnerable in the setting of ARDS. Elevated PASP and decreased TAPSE were associated with disease severity and composite endpoints,6 as well as in-hospital mortality,10 which was also observed in the present study. In addition, FAC, TAPSE, and RV-GLS were predictors of mortality in Cox regression analyses, while RV-GLS exhibited the best predictive values (area under the receiver operating characteristic curve = 0.87).10 The results were somewhat different in our study. RV-GLS exhibited no superiority in association with adverse outcomes, but TAPSE and S′ were reduced in non-survivors. The difference in RV-GLS observations might be related to the following factors. First, only 22/120 patients were admitted to the ICU, and 15/120 patients received invasive mechanical ventilation in the previous study. However, the patients in our study were much more critical. Second, increased RV thickness is very common in critical patients, and the underlying RV interstitial oedema might confuse myocardial reactions to RV strain.
Scientific hypothesis and clinical implications
There are few data focusing on the pathophysiology of impaired cardiovascular dynamics and diastolic and RV systolic dysfunction. A pathology study observed myocardial matrix oedema15 and low-grade interstitial and endocardial inflammation, while sporadic viral particles were observed only in macrophages in the myocardial matrix, and no viral particles were found in myocytes.16 Hence, there was no direct evidence supporting viral myocarditis as a major cause of myocardial injury. The pathogenic evidence of diffuse oedema in the myocardium could be explained by two mechanisms. The first possible mechanism is the cytokine storm, which is documented by significant increases in inflammatory markers such as interleukin-6 and hs-CRP and can lead to microvascular dysfunction and increased permeability of the vessels.17 The other underlying mechanism is fluid overload. Excessive positive fluid balance is associated with higher mortality in sepsis.18 However, fluid loading to correct peripheral perfusion and mechanical ventilation in COVID-19 patients may increase the RV and LV preload. Moreover, pulmonary vascular and parenchymal involvement would increase RV afterload. Overload might be particularly hazardous, leading to excessive extracellular fluid, inducing myocardial interstitial oedema, hypoxia of cardiomyocytes, LV dysfunction, and decreased cardiac output.17, 19 In addition, non-compliant LV may aggravate pulmonary congestion and hypertension, RV enlargement, and RV systolic dysfunction.20 Last, the presence of pre-existing cardiac disorders may cause functional reserve impairment and ventricular remodelling.21 When myocardial metabolic demand increases in the situation of stress and severe infection, myocardial ischaemia and necrosis might be triggered.21 Hence, troponin I is of more value to indicate diastolic dysfunction and pulmonary hypertension than to identify acute myocarditis, while CCE could play an essential role in accessing cardiac load and exploring a suitable volume status in critical patients with COVID-19.
Conclusions
Pericardial effusion and increased biventricular mass are both outstanding features of critical patients with COVID-19. When the heart ‘struggles in fluid’, diastolic dysfunction, LVSV and cardiac index reduction, PASP elevation and RV systolic dysfunction might occur, leading to a higher risk of mortality.
Limitations
Patient-specific factors such as severe pneumonitis, obesity, mechanical ventilation, and prone ventilation may limit CCE acquisition, and image quality may be limited occasionally. In addition, CCE was performed only as a baseline evaluation, while a repeated examination after recovery might be more meaningful to define clinical significance.
Acknowledgements
We sincerely thank all of our colleagues who fight with us in the ICU of Tongji Hospital, Huazhong University of Science and Technology. We appreciate the donation of a Venue™ critical care ultrasound from GE and the kind help of Tom-Tec with technical support.
Conflict of interest
None declared.
Funding
This work was supported by the Chinese Academy of Medical Sciences Innovation Fund for Medical Sciences (CIFMS) (no. 2020-I2M-CoV19-001).


