Tensile Performance of Occlusive Bolt Connection in Load-Bearing Support and Hanger System
ABSTRACT
The connection joints in support and hanger systems for nonstructural components are prone to serious damage under vertical loads (including heavy pipeline gravity and vertical seismic actions), which poses an adverse impact on life safety and results in substantial property loss. Occlusive bolt connection, as one of the most frequently used connection types in load-bearing support and hanger systems, plays a critical role in determining the overall strength and stability of these systems. The cyclic and monotonic tests were conducted on occlusive bolt connections using cold-formed thin-walled channels to investigate the influence of different cross-sectional types and thicknesses. Different failure modes were observed under vertical loads, and the variation patterns of strength, stiffness degradation, strength degradation, and cyclic energy dissipation capacity of the connections were analyzed. Moreover, a refined finite element model and the formula for calculating the tensile yield load of the occlusive connection were established and verified, showing that the main failure types of occlusive bolt connection are tearing failure and shear failure at rolled edges. The tensile strength of the connection increases in two stages: the first stage is represented by the bending of the rolled edge corner, and the second stage is the tension of the upper flange. The yield strength can be effectively enhanced by increasing the thickness of cold-formed thin-walled channels and the edge distance of the channel nut, but it eventually stabilizes beyond a certain value. Furthermore, increasing the strength of channels shall further increase the yield strength and peak strength of the occlusive bolt connection.
1 Introduction
The main design of building structures is increasingly becoming refined and perfected, while the damage to buildings mainly occurs in nonstructural systems when disasters occur, which poses a significant impact on life safety and results in substantial property loss [1]. This indicates that the seismic design of nonstructural components cannot meet the seismic performance requirements of the whole building [2]. In the Northridge earthquake in the United States, the economic losses caused by the damage to nonstructural systems were as high as 85% [3]. The 2001 El Salvador earthquake proved that the pipeline systems suffered a large amount of nonstructural damage due to the lack of a complete seismic design [4]. In the 2010 Chile earthquake, the air handling system collapsed and the sprinkler pipe systems were damaged due to insufficient lateral supports of the support and hanger system [5]. The above studies have found that nonstructural damage is usually caused by its supports and anchoring problems [6-8]. Due to the increasing investment in the construction of nonstructural components in buildings [9], the seismic design of nonstructural components, especially for pipeline systems, is particularly important.
As the main load-bearing components of the pipeline system, the support and hanger system takes up most of the damage due to its insufficient tensile strength. Sun et al. [10-12] summarized the test method of seismic performance of support and hanger systems and pointed out that the connection form of the joint affects the seismic performance of the support and hanger system without diagonal braces significantly. The joints failed before the damage of structural members, thus, the “strong joint” design concept should be further forced in the design of the support and hanger system. Zeng et al. [13] found that the seismic support and hanger system with normal service load failed obviously under different loading directions, especially at seismic connectors. Shi and Li [14] proposed that the support and hanger system should implement a “prevention first” policy, and the seismic reinforcement of mechanical and electrical engineering equipment is strictly needed. Song et al. [15] found that the failure of support and hanger systems failed by pulling or shearing in cyclic tests. Goodwin, Maragakis, and Itani [16] conducted a shaking table test on the hospital pipeline system and found that the support hanger effectively limited the displacement of the pipeline system. Perrone et al. [8] conducted monotonic and cyclic experiments on four types of support and hanger systems and proposed two performance targets for the seismic design of support and hanger systems for pipelines. FEMA-414 puts forward relevant seismic measures for different forms of pipeline support and hanger systems [17], and Chinese standards “GB 50981-2014 Code for seismic design of mechanical and electrical equipment” [18] also puts forward seismic requirements for various pipeline systems.
There are two types of support and hanger systems available in the market, including the seismic support hanger system [19] and the load-bearing support and hanger system [20]. Among them, the load-bearing support and hanger system is widely used due to its safety, simplicity, and cost-effectiveness. Some scholars have conducted preliminary investigations into the mechanical properties of this structure. Zhang et al. [21] found that the occlusive bolt connection in the assembled load-bearing support and hanger system is prone to slip failure. Guo et al. [22] proposed a calculation formula for the tensile strength of occlusive high-strength bolt connections in load-bearing support and hanger systems based on the principle of yield line. The general occlusive bolt connection of the load-bearing support and hanger system is shown in Figure 1. The mechanical properties of the connection joint in this system have an important influence on the overall load-bearing property, and the occlusive bolt connection is the most important and fragile part of the load-bearing support and hanger system.
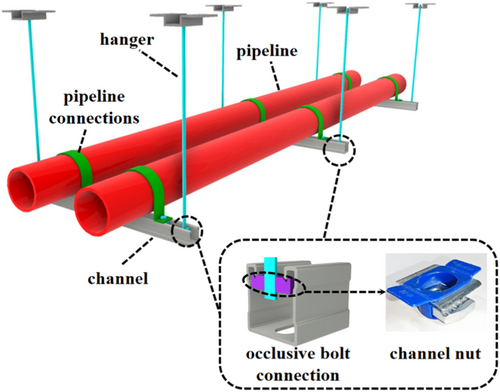
This paper aims to study the tensile process and force mechanism of the occlusive bolt connection in load-bearing support and hanger systems. The cyclic and monotonic experiments of occlusive bolt connection are carried out using single-channel and double-channel with thicknesses of 2.0 and 2.5 mm. The failure mode of the occlusive bolt connection, along with the variations in stiffness degradation, strength degradation, and energy dissipation capacity, are thoroughly examined. Additionally, a refined finite element model is developed to perform a parametric study on the edge distance of the connection and the steel grade of channels. This research is intended to provide practical guidance for the installation of load-bearing support and hanger systems for nonstructural components in infrastructure projects.
2 Tensile Experiment
2.1 Experimental Design
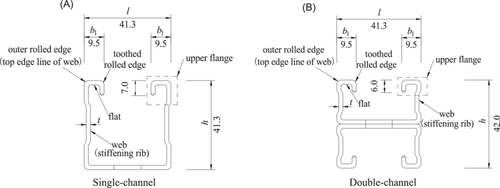
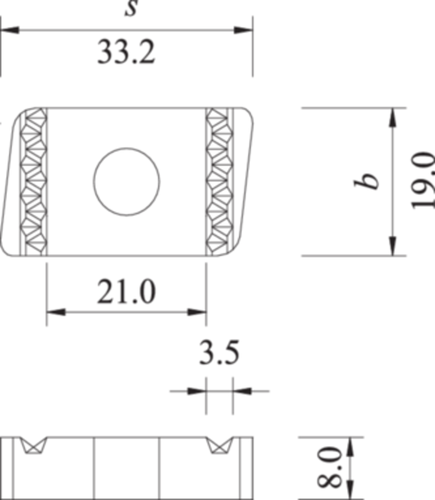
Two recommended types of cold-formed thin-walled steels in “T/CECS 731-2020 Technical specifications for assembled support and hanger systems” are used in the tensile test [23], that is, single-channel and double-channel. As shown in Figure 2A, the thickness and the height of the single-channel section are represented by t and h, respectively. The combination of “C” and “h − t” is used to represent the channel specifications, that is, “C41-2.0” and “C41-2.5” are used to represent 2.0- and 2.5-mm-thickness single-channels, respectively; “H” and “h/2 − t” are used to represent the double-channel specifications, that is, “H21-2.0” and “H21-2.5” are used to represent 2.0- and 2.5-mm-thickness double-channel, respectively, as shown in Figure 2B. The length of the single-channel and the double-channel component is 600 mm, and the dimension of the channel nut is shown in Figure 3. According to “T/CECS 731-2020 Technical specifications for assembled support and hanger systems” [23], the nominal diameter of high-strength bolts with the hexagonal head is suggested to be 10–12 mm. In this experiment, M10 high-strength bolts and channel nuts are selected. Existing research [24] shows that the installation torque does not affect the tensile performance of the occlusive bolt connection. Therefore, the installation torque of this experiment adopted the recommended installation torque provided by the bolt manufacturer, which is 10 N m (about 5.8 kN preload). The test parameters of specimens are shown in Table 1, the final abbreviations of the test number, that is, M and C, represent monotonic loading and cyclic loading, respectively.
| Test number | Specification | Thickness of steel member (mm) | Loading method |
|---|---|---|---|
| C41-2.0-M | C41-2.0 | 2.0 | Monotonic |
| C41-2.5-M | C41-2.5 | 2.0 | Monotonic |
| H21-2.0-M | H21-2.0 | 2.0 | Monotonic |
| H21-2.5-M | H21-2.5 | 2.0 | Monotonic |
| C41-2.0-C | C41-2.0 | 2.5 | Cyclic |
| C41-2.5-C | C41-2.5 | 2.5 | Cyclic |
| H21-2.0-C | H21-2.0 | 2.5 | Cyclic |
| H21-2.5-C | H21-2.5 | 2.5 | Cyclic |
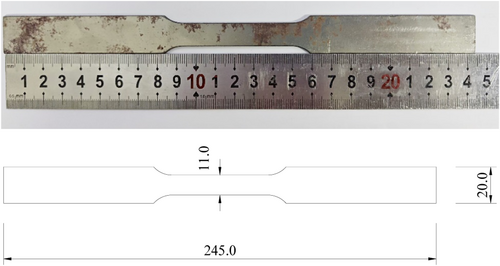
According to the tensile test method of metals [25], the dog-bone material samples of the tested channels are subjected to the unidirectional static tensile experiment, and the coupon is taken from the steel base material in the same pipeline as the channel, the size of the coupon was designed according to EN ISO 6892-1 [26]. The coupon geometry is shown in Figure 4, and the thicknesses of the coupons are 2.0 and 2.5 mm. The coupon test results are shown in Table 2.
| Steel thickness (mm) | Elastic modulus E (×105 MPa) | Yield strength (MPa) | Tensile strength (MPa) |
|---|---|---|---|
| 2.0 | 2.10 | 240 | 405 |
| 2.5 | 2.10 | 365 | 480 |
2.2 Loading Device
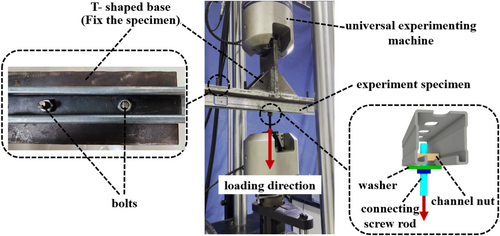
This experiment uses an electronic universal machine for loading; the onsite picture of the loading device is shown in Figure 5, where the loading fixture is a large T-shaped base with multiple connecting points. The single-channel (or double-channel) is fixed to the loading fixture by bolts. The upper fixed end of the universal machine clamps the T-shaped base, and the lower moveable end of the universal machine clamps the connecting screw rod to fix the single-channel (or double-channel). The screw rod connects with the channels by channel nuts, which is to achieve the occlusive connection. The connecting screw rod and the channel nut were pulled and pushed by the lower moveable end of the universal machine to apply tensile cyclic loading.
2.3 Loading Protocol
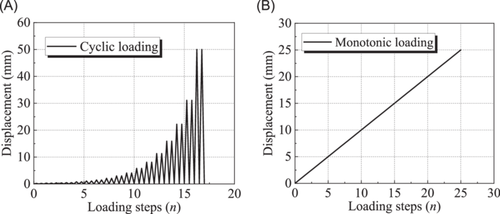
The experiment adopts two loading methods, that is, monotonic and cyclic loading, which are controlled by displacement loading until the specimen completely loses its strength. The loading protocol in the cyclic experiment adopts the recommended method by FEMA-461 [29] using variable amplitude displacement-controlled loading. The first level of loading displacement is 0.2 mm, and the next level of loading displacement is 1.4 times the previous loading displacement with two cycles at each loading level. The loading rate is 0.05 mm/s in the first 10 levels of displacement loading, and the loading speed is 0.2 mm/s thereafter. For monotonic loading, the loading rate is 0.1 mm/s. The loading protocol is shown in Figure 6.
3 Experimental Results
3.1 Failure Modes
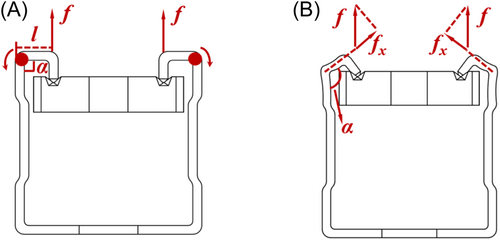
The stress mechanism of the experiment is summarized as follows: the tensile force on connecting screw rod is transmitted to the toothed rolled edge through the channel nut, and then to the flat of the upper flange. Since the flat of the upper flange is similar to a cantilever beam structure, the outer rolled edge works as the rotational constraint center on the flat part (see Figure 2). Therefore, the upper flange will rotate around the top edge line of the web when subjected to tension [22]. As the displacement continues to increase, the upper flange tilts and the preloading of connecting screw rod loses its effect, then yielding occurs near the top edge of the web subsequently, and the ultimate tensile strength of the specimen is reached. The failure modes are shown in Figure 7.

- 1.
For the 2.0-mm-thickness single-channel specimen, the upper flange of the channel rotates around the top edge of the web and the channel is deformed, while the outer rolled edge has no obvious damage. Only a slight shear failure at the toothed rolled edges occurs, as shown in Figure 7A. Finally, the specimen lost its overall strength due to the pull-out of the channel nut. It shows a general good ductility as a whole.
- 2.
In the monotonic and cyclic experiments of the 2.5-mm-thickness single-channel specimen, the top edge of the web enters the yield stage first, and the edge tears along the length direction because the tensile force on the outer rolled edge of the channel continues to increase. Finally, the upper flange is torn completely, as shown in Figure 7B.
- 3.
The cyclic experiment of the 2.0-mm-thickness double-channel and the 2.5-mm-thickness double-channel specimens show a similar phenomenon, that is, tearing failure and shear failure occur at the rolled edge simultaneously (named as combined failure), as shown in Figure 7C. The failure process is as follows: the outer rolled edge of the double-channel on one side undergoes tearing failure as the loading displacement increases, and then the crack width gradually develops and becomes larger. However, no obvious cracks appear on the other side, which has a certain restraining capacity on the channel nut and results in the tilt deformation of the channel nut, and the edge of the channel nut will exert a shear force on the other side. Finally, rolled edge tearing failure occurs on one side, and shear failure occurs on the other rolled edge.
The experiment shows that no matter what shape of cold-formed thin-walled steel, the occlusive bolt connection in the load-bearing support and hanger system shows tearing failure and shear failure patterns. However, due to the rotation at the outer rolled edge, it enters the plastic stage before the obvious deformation of the flat in the upper flange. Because of the significant difference in material properties between the rolled edge and the flat, the main deformation position is located at the outer rolled edge. Therefore, the outer rolled edge is first to be torn in the occlusive bolt connection, and then the total component fails due to the channel nut falling off, the upper flange breaking, and rolled edge shear failure.
3.2 Load–Displacement Relationship
The hysteretic curve obtained from the experiment is shown in Figure 8. At the beginning of loading, the specimen is in the elastic stage, the load–displacement relationship is basically linear, and the residual deformation is small during unloading; as the displacement increases, the specimen enters the elastic-plastic stage, the rolled edge of channels yields, and the slope of the cyclic curve changes and gradually tilts toward the displacement axis. In the later stage of loading, the plastic deformation of the specimen continues to develop, and the slope of the curve decreases with the number of cyclic loads. The residual deformation continues to increase and the channels lose their strength. It should be noted that during the unloading process, the washer prematurely contacted the buckled channel flange, resulting in negative load values on the hysteresis curves.

The peak load points of the first cycle of each level of the hysteretic curve are connected to obtain the backbone curve, which is compared with the curve obtained from the monotonic experiment, as shown in Figure 9.
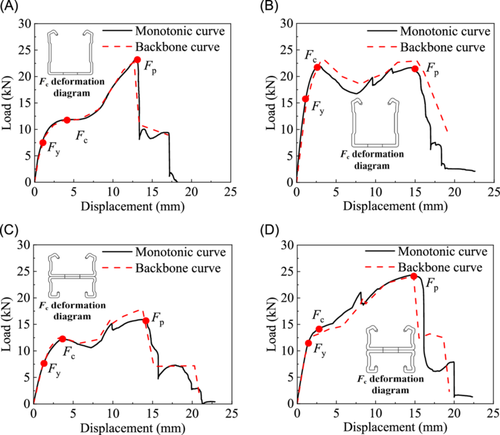
By comparison, it can be seen that the monotonic curve corresponds well with the backbone curve. When the load is relatively small, the specimen is in the elastic working stage until Fy, and then the outer rolled edge first enters the yield stage, and the upper flange of the specimen rotates around the outer rolled edge. The stress state of the upper flange changes from only rotating around the outer rolled edge to the compound action of rotating around the outer rolled and being subjected to the upward tension, and the critical load (Fc) of the outer rolled edge bending is reached. Subsequently, a plastic hinge is formed at the outer rolled edge, and a platform section appears in the curve. When the displacement continues to increase and the force on the upper flange completely transforms into tension, the curve continues to rise due to the strong tensile capacity of the steel, and the channel nut is pulled out when it reaches the peak load (Fp). In Figure 9B,C, after the plastic hinge is formed on the outer rolled edge, cracks appear on the outer rolled edge, so the load drops after the curve enters the platform section. When the force is completely transformed into the upper flange tension, the curve rises, but because the outer rolled edge is torn during the tension process, the curve has a slight falling section during the rising process. For Figure 9D, there is no obvious platform section. Because of the large thickness and small effective height of 2.5-mm-thickness double-channel, the upper flange entered the tension stage earlier, and then the curve had a falling section due to the tearing of the rolled edge.
The characteristic load and corresponding displacement are obtained by the geometric mapping method, as shown in Table 3.
| Specification | Secant stiffness E (×104 MPa) | Yield displacement (mm) | Yield load Fy (kN) | Critical load Fc (kN) | Peak load Fp (kN) |
|---|---|---|---|---|---|
| C41-2.0 | 0.7650 | 1.03 | 7.88 | 11.76 | 23.41 |
| C41-2.5 | 1.2927 | 1.23 | 15.90 | 22.14 | 21.66 |
| H21-2.0 | 0.4547 | 1.72 | 7.82 | 12.13 | 15.91 |
| H21-2.5 | 0.7756 | 1.56 | 12.10 | 13.74 | 24.30 |
- Note: The critical load indicates the state of large bending deformation of the roll edge, and the peak load indicates the specimen can no longer withstand a higher load.
For channels with the same cross-sectional shape, the yield strength of the connection specimen with 2.5-mm-thickness single-channel is 101.78% higher than 2.0 mm, and the specimen with 2.5-mm-thickness double-channel is 54.73% higher than 2.0 mm. For the critical load, the 2.5-mm-thickness single-channel is 88.23% higher than 2.0-mm-thickness single-channel, and the specimen with 2.5-mm-thickness double-channels is 13.27% higher than 2.0-mm-thickness single-channel. Then the upper flange of specimens is in tension at this stage. However, the peak strength of specimen with 2.5-mm-thickness single-channel is 7.48% lower than 2.0-mm-thickness single-channel, the reason is that the rolled edge has different degrees of initial damage when the channel is cold-bent, and slight void may aggregate and enlarge under large tensile forces, resulting in rapid crack development and premature failure of the 2.5-mm-thickness single-channel.
For the specimen with the same walled thickness, the yield strength and peak strength of occlusive bolt connection with single-channel is generally higher than that with double-channels. The ductility of the 2.0-mm-thickness single-channel is better, so it will not be damaged too early, and the peak load is greater than that of the 2.0-mm-thickness double-channel. Moreover, the single-channel and double-channel webs are equipped with stiffening ribs, which can improve local stiffness and enhance the strength of the outer rolled edge. Since the height of the stiffening ribs of the single-channel is much greater than that of the double-channel, the secant stiffness and strength of the specimen with single-channels are greater than those with double-channels.
3.3 Stiffness Degradation
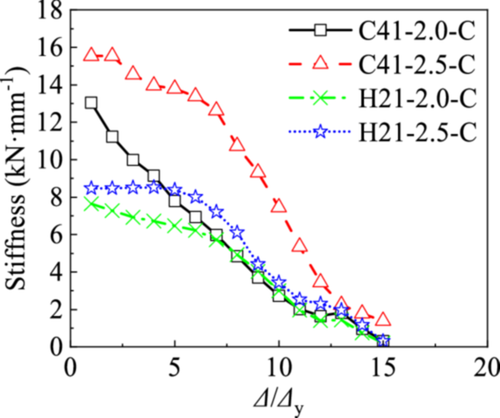
Since the specimens yielded and suffered different degrees of tearing damage at rolled edges, the stiffness of the four specimens degraded with the increase of loading displacement. The initial stiffness of the 2.5-mm-thickness single-channel is the highest, and the initial stiffness of the 2.0-mm-thickness double-channel is the lowest. However, the stiffness degradation of the 2.0-mm-thickness single-channel is the fastest during the initial loading. The reason may be that the 2.0-mm-thickness single-channel is taller and thinner, thus the channel is relatively soft. By comparison, it can be seen that the 2.0-mm-thickness single-channel entered the yield stage the earliest and had weaker deformation resistance, which led to a fast decrease in stiffness.
The degradation trend of secant stiffness is consistent with the variation of structural strength. When the cross-section of the steel component is the same, the stiffness and strength of the 2.5-mm-thickness specimen are higher than those of the 2.0-mm-thickness specimen. When the specimen thickness is the same, the stiffener ribs' height of the single-channel is higher than that of the double-channels, and thus, the initial stiffness and strength of the specimens with single-channel are higher than those with double-channels.
3.4 Strength Degradation
- 1.
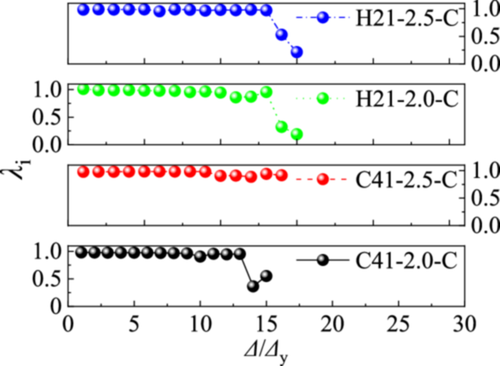
When the loading displacement is less than 12 mm (Δ/Δy = 13), the strength degradation coefficients of the four specimens are all greater than 0.9, indicating a good working performance; when the loading displacement is greater than 12 mm (Δ/Δy = 13), the stress state has completely entered the tensile plastic stage. The deformation at the rolled edge is large and different degrees of damage occur, and the strength degradation is more obvious.
- 2.
The strength degradation coefficient of experiment C41-2.5-C is much greater than that of the other three specimens when the loading displacement is greater than 15 mm (Δ/Δy = 14), it shows that in the occlusive bolt connection with the 2.5-mm-thickness single-channel has the best collaborative performance and can improve the strength degradation of specimens effectively.
3.5 Energy Dissipation Analysis
The viscous damping coefficient he and the energy dissipation coefficient Ed of each specimen are calculated by the above formula, and the results are shown in Table 4. The equivalent viscous damping coefficient of the 2.5-mm-thickness double-channel is the largest at the yield point, and the equivalent viscous damping coefficient of the 2.5-mm-thickness single-channel is the smallest. The upper flange rotates around the outer rolled edge, and the equivalent viscous damping coefficients are increased at the critical load. When the tensile peak load is reached, only the equivalent viscous damping coefficient of the 2.5-mm-thickness single-channel continues to rise, and the equivalent viscous damping coefficients of the other three specimens all decrease to varying degrees.
| Specification | hey | Edy | hec | Edc | hep | Edp |
|---|---|---|---|---|---|---|
| C41-2.0-C | 0.0550 | 0.3455 | 0.1113 | 0.6991 | 0.0579 | 0.3639 |
| C41-2.5-C | 0.0471 | 0.2958 | 0.0923 | 0.5799 | 0.1137 | 0.7142 |
| H21-2.0-C | 0.0488 | 0.3064 | 0.0790 | 0.4961 | 0.0604 | 0.3793 |
| H21-2.5-C | 0.0647 | 0.4062 | 0.0906 | 0.5694 | 0.0854 | 0.5367 |
- Note: hey, hec, and hep, are the equivalent viscous damping coefficient at yield point, critical point, and peak point, respectively. Edy, Edc, and Edp are the energy dissipation coefficient at yield point, critical point, and peak point, respectively.
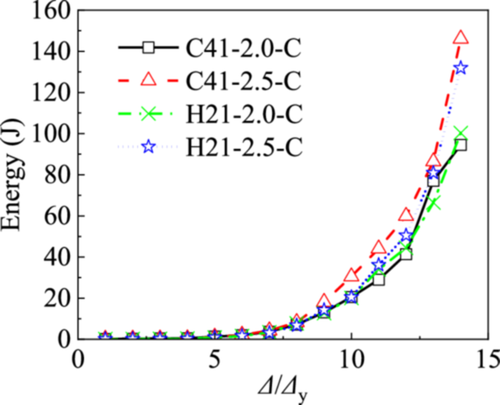
The cumulative energy dissipation of the specimens is calculated, and the cumulative energy dissipation curve is shown in Figure 12. Before the outer rolled edge of channels yields, the energy dissipation of the specimen is relatively small, and there is almost no residual deformation. With the yield of the outer rolled edge, residual deformation occurs and the cumulative energy also increases. Then the force of channels changes from rotation around the outer rolled edge to tension on the upper flange, and the energy dissipation is further enhanced. The cumulative energy dissipation of specimens continues to increase with the increase of displacement, and the growth rate is the same. The cumulative energy dissipation of the 2.5-mm-thickness single-channel is the highest. Combined with the equivalent viscous damping coefficient, it can be seen that the energy dissipation capacity of 2.5-mm-thickness single-channel is best.
4 Numerical Analysis
4.1 Finite Element Model
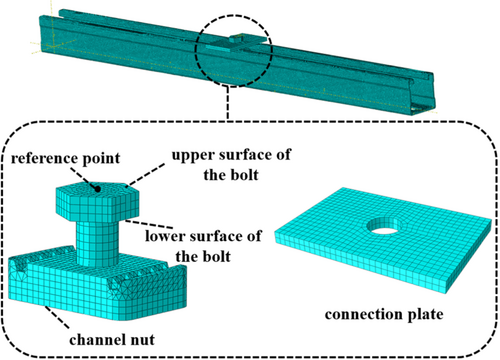
The failure modes of single-channel and double-channel with the same thickness are similar, however, the 2.0-mm-thickness single-channel and the 2.5-mm-thickness single-channel are quite different. Therefore, the 2.0-mm-thickness single-channel and the 2.5-mm-thickness single-channel are used as representatives to conduct finite element validation of the tensile test. To facilitate the application of bolt preload, bolts are used instead of screws for modeling. The overall mesh unit type adopts C3D8R in ABAQUS, and some meshes that cannot be divided into hexahedral units are divided into the C3D4 unit. Three-dimensional solid element is used in the numerical simulation, which may have the hourglass phenomenon in simulation. Whether the hourglass phenomenon influences the results depends on the ratio of artificial strain energy (ALLAE) to internal energy (ALLIE). If the proportion of ALLAE is less than 10% of ALLIE, the simulation is considered effective. In numerical simulations, the ALLAE is 6% of the ALLIE, which satisfies the premise that it is less than 10% of the internal energy, so the simulation is effective.
To balance the accuracy and computational efficiency of the numerical models, the mesh sensitivity analysis was carried out, taking a 2.0 mm thickness single-channel, for example. Three mesh sizes, including 6.0, 3.0, and 0.5 mm, were adopted, and the comparison results are shown in Figure 13 and Table 5. It can be found that the ALLAE/ALLIE ratio for the 6.0 mm mesh numerical model is greater than 10%, indicating a serious hourglass phenomenon, while the analysis time of the 0.5 mm mesh numerical model is too long. Both the accuracy and the analysis time of the 3.0 mm mesh numerical model are reasonable. Therefore, a mesh size of 3.0 mm is selected.

| Mesh size (mm) | Analysis time (h) | ALLAE/ALLIE (%) | Yield load (kN) |
|---|---|---|---|
| 6.0 | 6 | 15 | 8.83 |
| 3.0 | 7 | 6 | 8.29 |
| 0.5 | 50 | 7 | 7.80 |
- Abbreviations: ALLAE, artificial strain energy; ALLIE, internal energy.
The material properties adopt nominal stress–strain relationships and the Johnson–Cook constitutive model. For the material properties at the rolled edge, the enhancement model proposed in the previous study [27] is used to calculate the yield and ultimate stress–strain relationship at the rolled steel part. The analysis step adopts an explicit dynamic approach for quasistatic analysis, and the contact adopts an explicit general contact method. The normal direction is “hard” contact and the friction coefficient is 0.3 in the tangential direction. The reference point is coupled with the upper surface of the bolt to apply displacement load to the reference point, the lower surface of the bolt is in tie contact with the connection plate, and the bolt is also in tie contact with the channel nut. The bottom hole of the single-channel is fixed and constrained. The finite element model is shown in Figure 14.
4.2 Validation
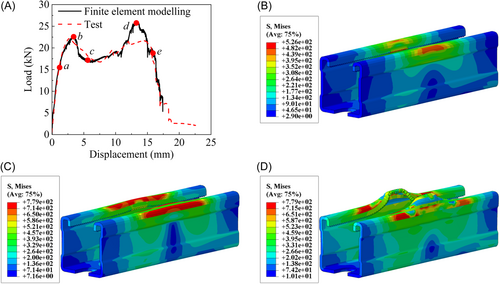
The load–displacement curve and stress contour map obtained by finite element are shown in Figures 15 and 16. The yield load of the occlusive bolt connection (with 2.0-mm-thickness single-channel) from the numerical model and experiment is 8.29 and 7.88 kN, respectively. For the specimen with 2.5-mm-thickness single-channel, the yield load measured by the finite element model is 16.21 kN, and the yield load obtained from the experiment is 15.90 kN, showing a slight difference of 1.95%. Since the finite element model does not consider the initial defects, no premature failure in the simulation of 2.5-mm-thickness single-channel appears.

It can be seen from Tables 6 and 7 that the experimental and numerical yield load, yield displacement, and critical load have good agreement, while the peak load has a relatively large difference for C41-2.5, probably due to experimental uncertainties.
| Secant stiffness E (×104 MPa) | Yield displacement (mm) | Yield load Fy (kN) | Critical load Fc (kN) | Peak load Fp (kN) | |
|---|---|---|---|---|---|
| C41-2.0 | |||||
| Experiment | 0.7650 | 1.03 | 7.88 | 11.76 | 23.41 |
| Numerical model | 0.7208 | 1.15 | 8.29 | 11.44 | 21.6 |
| Difference value δ (%) | 5.78 | 11.65 | 5.20 | 2.72 | 7.73 |
- Note: Difference value δ = |simulation value − experimental value|/experimental value × 100%.
| Secant stiffness E (×104 MPa) | Yield displacement (mm) | Yield load Fy (kN) | Critical load Fc (kN) | Peak load Fp (kN) | |
|---|---|---|---|---|---|
| C41-2.5 | |||||
| Experiment | 1.2927 | 1.23 | 15.90 | 22.14 | 21.66 |
| Numerical model | 1.3396 | 1.21 | 16.21 | 22.89 | 26.29 |
| Difference value δ (%) | 3.63 | 1.63 | 1.95 | 3.39 | 21.38 |
- Note: Difference value δ = |simulation value − experimental value|/experimental value × 100%.
Overall, there is no obvious difference between the simulation and the experiment results, which proves the accuracy of the numerical model and provides a basis for subsequent parametric analysis. When the critical load is reached, the outer rolled edge sustains the most stress, and the upper flange rotates around the outer rolled edge, at this time, the deformation is shown in Figures 15C and 16C. As the displacement continues to increase, the upper flange of the single-channel completely enters the tension stage, which is determined by the tensile strength of the single-channel. Finally, the channel reaches the peak strength and the deformation shape is consistent with the experiment, as shown in Figures 15D and 16D.
4.3 Analysis of the Failure Process
The load–displacement curve of the occlusive bolt connection in the load-bearing support and hanger system shows a two-stage rise phenomenon. The process of the single-channel being pulled upward is divided into three stages: the rolled edge bending stage, the deformation continuous development stage, and the upper flange tension stage.
As shown in Figures 15A and 16A, points a, b, c, d, and e are the yield point, critical load point, upper flange tension point, peak load point, and ultimate load point (taking 0.85 times the peak load). The ob stage is the rolled edge bending stage. Assuming the upward tensile force is f and the lever arm is l, the stress of the single-channel is shown in Figure 17A during initial loading. The angle α = 90° and channel nut is in contact with the teeth of the channel at this time, then the outer rolled edge works as a support, and the upper flange of the channel rotates around it under tensile forces. After the displacement loading reaches point a, the outer rolled edge of the channel enters the yield stage, and the curve no longer moves linearly. As the displacement increases to point b, the strength of the outer rolled edge takes most of the effect, and then the loading enters the bc stage which is the deformation continuous development stage. At this time, a platform or a downward trend can be observed with the increase of displacement, which is due to local tightening or cracks in the outer rolled edge. When loaded to point c, the upper flange enters the cd tensile stage as shown in Figure 17B, the angle α at the outer rolled edge continues to increase and the tensile force f gradually increases. The upper flange of the channel is completely transformed from rolled edge bending to tension, and the sustained load of the occlusive bolt connection is still increasing. The channel reaches the peak strength at point d, and there is a significant deformation and the channel nut falls off the channel. Finally, the channel completely loses its strength and the occlusive bolt connection completely fails at point e.
5 Design Suggestions
5.1 Strength Calculation
The strength of tested specimens is compared, as shown in Tables 8 and 9. By comparing the theoretical formula with the experimental and numerical analysis results, the maximum positive and negative deviations of yield load are 17.77% and −12.09%, and the average deviation is −4.10%, which indicates the rationality of the calculation results.
| Specimen | Yield load Fy (kN) | Difference value δ (%) | |
|---|---|---|---|
| Experimental | Theoretical | ||
| C41-2.0 | 7.88 | 7.46 | −5.31 |
| C41-2.5 | 15.90 | 14.25 | −10.38 |
| H21-2.0 | 7.82 | 7.46 | −4.58 |
| H21-2.5 | 12. 10 | 14.25 | 17.77 |
- Note: Difference value δ = |theoretical value − experimental value|/experimental value × 100%.
| Specimen | Yield load Fy (kN) | Difference value δ (%) | |
|---|---|---|---|
| Numerical | Theoretical | ||
| C41-2.0 | 8.29 | 7.46 | −9.99 |
| C41-2.5 | 16.21 | 14.25 | −12.09 |
- Note: Difference value δ = |theoretical value − numerical value|/numerical value × 100%.
5.2 Edge Distance of Channel Nut
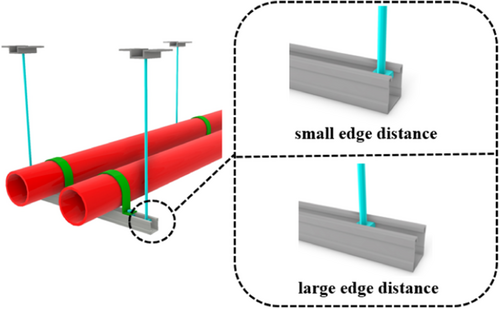
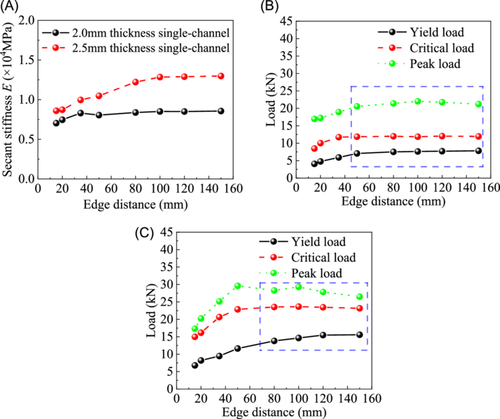
The edge distance represents the spacing from the channel nut to the end of the channel, as shown in Figure 18. The edge distance greatly affects the strength of the occlusive bolt connection. If the edge distance is too small, the strength of the occlusive bolt connection cannot meet the requirements for sustaining heavy pipelines. A large edge distance represents that the support and hanger system takes up a large installation space and may collide with the surrounding nonstructural components, indicating the waste of materials from the economic perspective. Therefore, an appropriate edge distance has a crucial impact on the installation of the load-bearing support and hanger system. However, the code “T/CECS 731-2020 Technical specifications for assembled support and hanger systems” [23] stipulates that the edge distance of high-strength bolts should be greater than 2d0, while the standard “GB50738-2011 Code for construction of ventilation and air conditioning” [28] takes the bolt edge distance as 50 mm. Therefore, the design value of the edge distance of the occlusive bolt connection in load-bearing support and hanger systems has not yet been fully agreed upon in the relevant specifications. To design a reasonable edge distance of the occlusive bolt connection, by keeping the bottom constraint of the channel unchanged, the finite element method is used to simulate the C41-2.0 and C41-2.5 single-channels with different edge distances, including 15, 20, 35, 50, 80, 100, 120, and 150 mm. The yield load is taken as the strength value as recommended in “T/CECS 731-2020 Technical specifications for assembled support and hanger systems” [23].
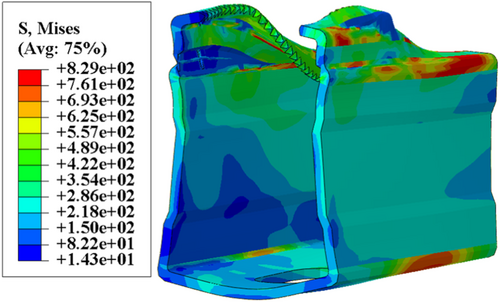
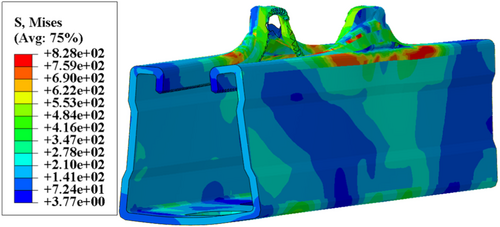
Through finite element simulation, it can be seen that the deformation of channels with different edge distances is significantly different. The end of the single-channel has less constraint on the upper flange when the edge distance is too small. Therefore, the deformation of the channel on both sides of the bolt is not the same under monotonic loading. Taking the 2.0-mm-thickness single-channel as an example, as shown in Figure 19, when the edge distance is 20 mm, it can be seen that the channel near the edge has no constraint, and the upper flange is completely turned out as the displacement increases, and the webs on both sides of the channel are sunken inward. Overall, the -channel shows good plastic deformation due to the weak constraint, but the strength is poor. Finally, the rolled edge tearing failure occurs at the outer rolled edge, and the failure phenomenon is the same as the rolled edge tearing failure in the experiment. Since the bolt is at a certain distance from the edge when the edge distance increases to 120 mm (see Figure 20), the channel at the edge has an obvious constraint effect at the tensile position. The web of the single-channel is sunken inward at the edge, and the rolled edge tearing failure occurs finally.
The parametric study results on different edge distances of 2.0-mm-thickness single-channel are shown in Table 10, and the results with 2.5-mm-thickness single-channel under different edge distances are shown in Table 11.
| Edge distance | Secant stiffness E (×104 MPa) | Yield displacement (mm) | Yield load Fy (kN) | Critical load Fc (kN) | Peak load Fp (kN) |
|---|---|---|---|---|---|
| 15 | 0.7033 | 0.64 | 4.07 | 8.47 | 16.96 |
| 20 | 0.7461 | 0.71 | 4.76 | 10.01 | 17.23 |
| 35 | 0.8301 | 0.77 | 5.91 | 11.72 | 18.92 |
| 50 | 0.8047 | 0.98 | 7.05 | 11.86 | 20.56 |
| 80 | 0.8373 | 1.01 | 7.51 | 11.98 | 21.42 |
| 100 | 0.8508 | 1.01 | 7.63 | 11.86 | 22.02 |
| 120 | 0.8503 | 1.01 | 7.71 | 12.02 | 21.75 |
| 150 | 0.8556 | 1.01 | 7.82 | 11.94 | 21.20 |
| Edge distance | Secant stiffness E (×104 MPa) | Yield displacement (mm) | Yield load Fy (kN) | Critical load Fc (kN) | Peak load Fp (kN) |
|---|---|---|---|---|---|
| 15 | 0.8594 | 0.79 | 6.79 | 14.98 | 17.31 |
| 20 | 0.8723 | 0.94 | 8.20 | 16.15 | 20.25 |
| 35 | 0.9958 | 0.95 | 9.46 | 20.66 | 25.15 |
| 50 | 1.0478 | 1.11 | 11.63 | 22.86 | 29.60 |
| 80 | 1.2212 | 1.13 | 13.80 | 23.53 | 28.28 |
| 100 | 1.2842 | 1.14 | 14.64 | 23.65 | 29.30 |
| 120 | 1.2892 | 1.20 | 15.47 | 23.45 | 27.83 |
| 150 | 1.2975 | 1.20 | 15.57 | 23.16 | 26.49 |
Figure 21 shows the changing trend of mechanical characteristics at different edge distances, the secant stiffness, yield load, critical load, and peak load all show an upward trend with the increase of the edge distance. (1) For the occlusive bolt connection with 2.0-mm-thickness single-channels, the strength tends to be stable at approximately 7.05 kN when the edge distance exceeds 50 mm. (2) For 2.5-mm-thickness single-channel, the strength is 13.80 kN when the edge distance reaches 80 mm, and it does not change much afterward. Therefore, it is recommended that the edge distance for 2.0-mm-thickness single-channel is greater than 50 mm, and the recommended edge distance is at least 80 mm for 2.5-mm-thickness single-channels.
5.3 Steel Grade of Channel
The widely used steel components in load-bearing support and hanger systems are made of Q235 steel and Q355 steel [23]. Currently, photovoltaic load-bearing support and hanger systems are extensively deployed as well, and their installation form is the same as that of traditional load-bearing support and hanger systems, but the steel used is of higher strength, such as galvanized steel S420GD. To explore the influence of steel grade on the strength of occlusive bolt connection, Q355 and S420GD are selected to supplement the simulation of the experimental Q235 steel, and the results are shown in Table 12. Compared with Q235 steel, the changing trend of each mechanical parameter is shown in Figure 22.
| Specification | Yield strength (MPa) | Secant stiffness E (×104 MPa) | Yield displacement (mm) | Yield load Fy (kN) | Critical load Fc (kN) | Peak load Fp (kN) |
|---|---|---|---|---|---|---|
| C41-2.0-Q235 | 235 | 0.9114 | 0.79 | 7.20 | 12.37 | 21.44 |
| C41-2.0-Q355 | 355 | 0.9359 | 0.92 | 8.61 | 13.87 | 28.84 |
| C41-2.0-S420GD | 420 | 0.9396 | 1.08 | 9.96 | 15.33 | 33.77 |
| C41-2.5-Q235 | 235 | 1.4027 | 1.13 | 15.85 | 22.73 | 25.86 |
| C41-2.5-Q355 | 355 | 1.4050 | 1.20 | 16.86 | 24.25 | 26.88 |
| C41-2.5-S420GD | 420 | 1.4983 | 1.15 | 17.23 | 26.33 | 30.54 |
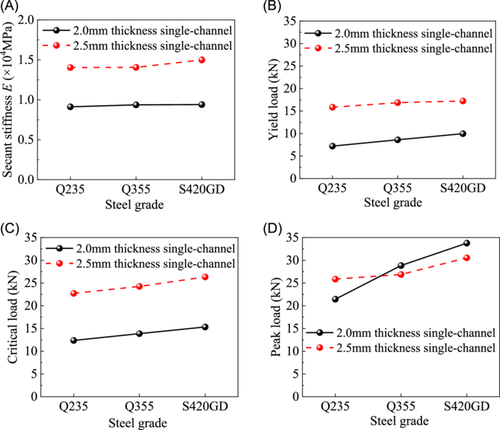
By changing the material properties of the channel, it can be seen that after increasing the steel grade, the secant stiffness does not change much, but the yield load and critical load of the occlusive bolt connection with two different thickness channels both show an upward trend. Moreover, the peak strength increases significantly with a higher-strength channel, especially for the occlusive bolt connection with 2.0-mm-thickness single-channels. Overall, taking the yield load as the strength of the channel, the parametric study shows that the strength of the occlusive bolt connection can be effectively improved by increasing the steel grade.
6 Conclusions
- 1.
The tensile failure modes of the occlusive bolt connection are divided into two types, that is, tearing failure and shear failure at the rolled edge. The entire loading process can be divided into three stages, including the rolled edge bending stage, the deformation continuous development stage, and the upper flange tension stage.
- 2.
The thickness of channels has a significant impact on the overall strength of the occlusive bolt connection. The yield strength of the specimen with a 2.5-mm-thickness single-channel is 101.78% higher than that with a 2.0-mm-thickness single-channel, and the yield strength of the specimen with a 2.5-mm-thickness double-channel is increased by 54.73% compared with that with 2.0-mm-thickness double-channel. The equivalent viscous damping coefficient of the 2.5-mm-thickness double-channel is the highest; thus, increasing the walled thickness improves the strength and energy dissipation capacity of the connection in load-bearing support and hanger system effectively.
- 3.
The strength degradation coefficient is greater than 0.9 regardless of the form of the channel before loading to 12 mm, while the strength degradation coefficients of the specimen with the 2.0-mm-thickness single-channel, 2.0-mm-thickness double-channel, and 2.5-mm-thickness double-channel drop significantly when the displacement is greater than 15 mm.
- 4.
The strength of the occlusive bolt connection increases with the increase of the edge distance of channel nuts. When the edge distance exceeds 50 mm for the connection with the 2.0-mm-thickness channel and 80 mm for that with the 2.5-mm-thickness channel, the strength stabilizes. Therefore, the recommended minimum edge distances are 50 and 80 mm for the connection with a walled thickness of 2.0 and 2.5 mm, respectively.
- 5.
Increasing the strength of channels does not change the stiffness of the occlusive bolt connection under tensile forces, while a higher strength of steel can increase the yield strength and peak strength of the occlusive bolt connection in load-bearing support and hanger systems effectively.
Acknowledgments
The research is supported by the National Natural Science Foundation of China (Grant No. 52478558). The technical support from graduate students Yihang Li, Jiabao Jia, and Guangze Wei in the structural laboratory is sincerely appreciated.
Conflicts of Interest
The authors declare no conflicts of interest.


