Seasonal Changes in Fish eDNA Signal Vary Between Contrasting River Types
Funding: This work was supported by Environment Agency, UK.
ABSTRACT
Due to the societal reliance on goods and services provided by river systems and their close proximity to settlements, few modern-day rivers are without significant anthropogenic modifications. The natural river hydrology is often altered as a consequence of pumping water for flood alleviation, retaining water for irrigation, and modifying channels for navigation. In recent years, water pumping stations have been found to have several adverse impacts, including fish mortality (direct and indirect) and habitat fragmentation. More broadly, modern-day river systems face a myriad of anthropogenic flow and channel modifications, with varying impacts on different fish life stages. To manage such risks in line with policy, knowledge of the overall fish community and priority species present is required. It is therefore important to understand the robustness of developing survey strategies across differently managed river systems. This study investigates the seasonal patterns of environmental DNA (eDNA) metabarcoding fish detections from water samples taken across three differently managed river types over a one-year period. We observed some significant seasonal variation in detection rates and fish communities; however, this variation was not consistent among river types. Despite this, we found comparatively poor fish communities upstream of pumping stations all year round, with pumped catchments containing significantly fewer species than the adjacent main river channel and our regional control site. Finally, we highlight that seasonal variation in detectability for the overall fish community may not always reflect that of priority species. In our case, we found favorable European eel (Anguilla anguilla) detection in the summer months across all river types. It is therefore recommended that rather than focusing on overall detectability, policy-driven targeted surveys should be designed with priority species ecology in mind.
1 Introduction
European rivers are under broad-scale pressures from hydromorphological alteration, resulting in habitat fragmentation and flow alteration (Szabolcs et al. 2022). This makes addressing and prioritizing lotic freshwater conservation a challenge. Migratory species such as the European eel (Anguilla anguilla) are especially vulnerable to these pressures and have faced significant declines over the last four decades (Aalto et al. 2016; Correia et al. 2018; ICES 2019). In response, the EC Eel Regulation (1100/2007) was implemented, which requires the development of eel management plans (EMPs) aiming to achieve safe passage of > 40% historic silver eel biomass between inland waters and the sea (Council of the European Union 2007). However, with over one million barriers fragmenting European river systems (Belletti et al. 2020), it is important that mitigation measures can be prioritized to maximize the impacts of limited resources.
Due to the mounting evidence that water pumping stations can adversely impact fish communities in rivers (Norman et al. 2023a, 2023b; Solomon and Wright 2012), particularly the critically endangered A. anguilla (Bolland et al. 2019; Buysse et al. 2014; Jacoby and Gollock 2014), it is essential that we can prioritize management resources at these structures effectively. These impacts are direct and indirect, including fish mortality from blade strikes during downstream passage and acting as barriers to both upstream and downstream migration (Bolland et al. 2019; Buysse et al. 2014, 2015; Kroes et al. 2020). However, in the absence of present-day knowledge of the fish community in such catchments, it is challenging to apply evidence-based prioritization to mitigate these impacts (Solomon and Wright 2012). Recent comparisons with environmental DNA (eDNA) metabarcoding have suggested that current standard practice surveys (seine netting/electrofishing) may under-represent low abundance priority species, including A. anguilla, in heavily managed catchments (Griffiths et al. 2020; McDevitt et al. 2019). Elsewhere, studies have also found that eDNA-based monitoring can provide a high sensitivity method of detecting priority species more generally (Burgoa Cardás et al. 2020; Halvorsen et al. 2020; McColl-Gausden et al. 2021; Muha et al. 2021; Weldon et al. 2020).
In order to implement eDNA-based monitoring into prioritization frameworks in heavily managed river catchments, it is important that we first understand the dynamics of eDNA in such systems. It has recently been highlighted that to successfully integrate DNA-based methods into aquatic monitoring, best practice guidelines and standards must be developed (Blancher et al. 2022). Studies have found that eDNA metabarcoding can reflect long-term (Hänfling et al. 2016) and contemporary (Di Muri et al. 2020) fish catch data in lentic systems. Further, in lentic systems, the eDNA signal has been found to be more homogenous in autumn/winter compared to summer, and, as a result, detection probability is increased (Blabolil et al. 2022; Handley et al. 2019). Numerous studies have also found eDNA metabarcoding to yield high sensitivity in lotic systems (Griffiths et al. 2020; Hallam et al. 2021; McColl-Gausden et al. 2021; McDevitt et al. 2019; Muha et al. 2021; Pont et al. 2018), but detectability in rivers can be more unpredictable. Pumped catchments have artificial and highly variable flows (Kroes et al. 2020), switching from lentic (i.e., pumps off) to lotic (i.e., pumps on), thus making it difficult to predict how hydrology would influence eDNA assessments. It has been suggested that due to transportation of eDNA in rivers (Pont et al. 2018), high waterflow events can integrate more species and increase detection probability (Milhau et al. 2019). On the other hand, high flows have been observed to have conflicting effects by diluting eDNA of rare species and reducing detectability (Curtis et al. 2021). Seasonal peaks in detectability of certain species have also been observed as a result of their ecology and lifecycle traits (i.e., spawning activity Bracken et al. 2019; Bylemans et al. 2017; Di Muri et al. 2022; Inui et al. 2021; Tillotson et al. 2018). Despite this, Milhau et al. (2019) found that waterflow had a global influence on seasonal eDNA signal while the reproductive period only influenced specific species. Ultimately, understanding seasonal patterns in lotic systems is more challenging since temporal variations in hydrological conditions and species ecology can influence detectability, which may also vary depending on how flows are regulated and managed. As a result, seasonal trends of eDNA-based monitoring have varied between different systems and target species (Burgoa Cardás et al. 2020; Curtis et al. 2021; Milhau et al. 2019; Sales et al. 2021; Wacker et al. 2019), and thus warrant further investigation in heavily managed catchments.
- Assess the seasonal variation of eDNA metabarcoding detections over a one-year period across different river types.
- Determine the impact of pumping stations on overall fish communities when compared to the main river channel and an unregulated regional control site.
- Compare the seasonal detectability of priority species (A. anguilla) with that of the overall fish community.
2 Methods
2.1 Study Systems
- –
River Ancholme pumped catchments (APC).
- –
Main River Ancholme (MRA).
- –
Main River Hull (MRH).
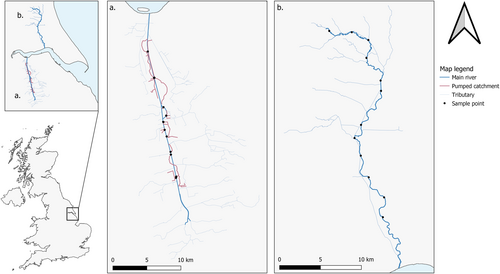
Twelve sample points were selected in each river type, allowing for four seasonal revisits over a one-year period. Sampling points were selected in the River Ancholme based on the position of the 12 water pumping stations present (Figure 1a), allowing paired upstream and downstream samples to be taken. In the River Hull, sampling points were allocated based on approximately equidistant access points. Since the River Hull channel is a more dynamic system, we prioritized a representative spread of sampling points (access permitting) spanning from the lower to the upper catchment (Figure 1b).
2.2 Water Sampling
Across our study sites, 144 2 L surface water samples were taken using new sterile Gosselin HDPE plastic bottles (Fisher Scientific UK Ltd., Loughborough, UK). Each river type was sampled at 12 points (Figure 1) each season-based on the four UK meteorological seasons. This allowed for 48 samples to be taken from each river type, with the Ancholme and Hull catchments being sampled during Spring (11/03/2019, 27/05/2020), Summer (02/07/2019, 29/08/2019), Autumn (17/10/2019, 28/11/2019) and Winter (17/01/2020, 26/02/2020) respectively. This one-year timeframe was expected to allow sufficient ecological (i.e., fish spawning, migration, activity) and environmental (i.e., temperature, rainfall, flow) variation across river types. Each 2 L sample taken consisted of 5 × 400 mL sub-samples spaced a few meters apart to account for any stochasticity in eDNA distribution within the watercourse. All samples were taken from the river bank, using a reach pole where required (Figure 2a). Sterile gloves were worn by the sampler and changed between samples; the sampling pole was cleaned with bleach (10%) and thoroughly rinsed between samples to prevent contamination. For each sampling visit, a 2 L field blank (purified water) was taken out and handled alongside eDNA water samples to monitor for contamination.

Upon collection, water samples were immediately placed on ice in a bleach-sterilized cool box during transit and taken back to a dedicated eDNA filtration facility (Figure 2b). All samples and blanks were transferred to a fridge (4°C) upon receipt and vacuum filtered within 24 h of the time collected. All surfaces and equipment in the filtration lab were sterilized using 10% v/v chlorine-based commercial bleach solution (Elliott Hygiene Ltd., Hull, UK). Between each filtration run, equipment was immersed in 10% bleach solution for 10 min, soaked in 5% v/v MicroSol detergent (Anachem, Leicester, UK) for an additional 10 min, and following this rinsed thoroughly with purified water to remove any detergent residue. When possible, the full 2 L of water was vacuum filtered through sterile 0.45 μm cellulose nitrate membrane filters with pads (47 mm diameter; Whatman, GE Healthcare, UK) using Nalgene filtration units—two filters were used per sample to reduce filter clogging. Once 1 L of water had passed (or after 30 min under vacuum) the filters were removed from units using sterile tweezers, rolled, and placed back-to-back in sterile 5 mL Axygen screw cap transport tubes (Fisher Scientific UK Ltd., Loughborough, UK) each pre-prepared with 1 g of 0.15 mm and 1–1.4 mm diameter sterile garnet beads ready for extraction (Sellers et al. 2018), then stored at −20°C.
2.3 DNA Extraction
DNA from each sample was co-extracted from duplicate filters alongside extraction blanks using a designated sterile extraction area, following the Mu-DNA: Water protocol (Sellers et al. 2018). Following extraction, the eluted DNA extracts (100 μL) were quantified and checked for purity using a NanoDrop Spectrophotometer to confirm that DNA was isolated successfully, then stored at −20°C until PCR amplification.
2.4 Library Preparation
The eDNA metabarcoding and library preparation workflow applied in this study follows that outlined in (Griffiths, Wright, and Hänfling 2023). This is summarized below:
Nested metabarcoding following a two-step PCR protocol was performed, using multiplex identification tags in both steps to enable sample identification as described in (Kitson et al. 2019). The first PCR (PCR1) was performed in triplicate (3× PCR replicates per eDNA extract), amplifying a 106 bp fragment using published 12S ribosomal RNA primers 12S-V5-F (5′-ACTGGGATTAGATACCCC-3′) and 12S-V5-R (5′-TAGAACAGGCTCCTCTAG-3′) (Kelly et al. 2014; Riaz et al. 2011). These primers have been previously validated in silico, in vitro, and in situ for UK freshwater fish, confirming that all UK species can be detected with the exceptions of distinctions between Lampetra planeri/Lampetra fluviatilis and Perca fluviatilis/Sander lucioperca; three species of Asian carp (Hypophthalmichthys nobilis, Hypophthalmichthys molitrix and Ctenopharyngodon idella); and species within the genera Salvelinus and Coregonus (Hänfling et al. 2016). PCR-negative controls (Molecular Grade Water) were used throughout, and positive controls using DNA (0.05 ng μl−1) from the non-native cichlid Maylandia zebra were also used. All PCR replicates were pooled, and samples from each PCR1 plate were normalized and pooled to create sub-libraries. Sub-libraries were then purified using MagBIND RxnPure Plus magnetic beads (Omega Bio-tek Inc., Norcross, GA, USA), following a double size selection protocol (Quail, Swerdlow, and Turner 2009). Ratios of 0.9× and 0.15× magnetic beads to 100 μL of amplified DNA from each sub-library were used. Following this, a second shuttle PCR (PCR2) was performed on the cleaned product to bind Illumina adapters to the sub-libraries. A second purification was then carried out on the PCR2 products with Mag-BIND RxnPure Plus magnetic beads (Omega Bio-tek Inc., Norcross, GA, USA). Ratios of 0.7× and 0.15× magnetic beads to 50 μL of each sub-library were used. Eluted DNA was then refrigerated at 4°C until quantification and normalization. Once pooled, the final library was then purified again (following the same protocol as the second clean-up), quantified by qPCR using the NEBNext Library Quant Kit for Illumina (New England Biolabs Inc., Ipswich, MA, USA) and verified for fragment size and purity using an Agilent 2200 TapeStation with High Sensitivity D1000 ScreenTape (Agilent Technologies, Santa Clara, CA, USA). Once verified, the library was loaded (mixed with 10% PhiX) and sequenced on an Illumina MiSeq using a MiSeq Reagent Kit v3 (600 cycle) (Illumina Inc., San Diego, CA, USA).
After sequencing, sub-libraries were demultiplexed to the sample level using a custom Python script. Tapirs, a reproducible workflow for the analysis of DNA metabarcoding data (https://github.com/EvoHull/Tapirs), was subsequently used for taxonomic assignment of demultiplexed reads. Sequence reads were quality trimmed, merged, and clustered before taxonomic assignment against a curated UK fish reference database (Hänfling et al. 2016). Note that due to the minimum read length parameters selected for this study (90 bp), Lampetra detections are not expected in the results. Taxonomic assignment here used a lowest common ancestor (LCA) approach based on basic local alignment search tool (BLAST) matches with minimum identity set at 98%.
2.5 Data Processing and Analysis
Data were analyzed and visualized using R version 4.2.1 (R Core Team 2020). A low-frequency reads threshold was applied to all eDNA samples prior to downstream analysis, which removed any reads making up less than 0.1% of total reads assigned to each sample, as previously applied with this 12S marker (Handley et al. 2019; Hänfling et al. 2016). In addition to the low-frequency reads threshold, all assignments of Cyprinus carpio with fewer than 100 reads were omitted due to detections of this species in process blanks (3–65 reads). Samples with < 500 reads were regarded as low quality and omitted from further analysis to reduce stochastic PCR effects. One site ‘ICAR’ from the APC was removed from analysis due to instances of inhibition (samples < 500 reads) and an artificial fishing pond directly upstream, meaning that detections were not representative of the fish community in the pumped catchments.
Prior to any statistical analysis, species richness data were screened for normality using base R. Differences in species richness between river types and across seasons were tested for significance using ANOVA and nonparametric Kruskal–Wallis tests, followed by post hoc Tukey (using TukeyHSD function in base R) and Dunns (using the FSA package; Ogle, Wheeler, and Dinno 2020) tests, respectively, depending on whether the data conformed to normality. Differences in fish community between river types and across seasons were also tested using PERMANOVAs, using the “adonis” function in the Vegan package (Oksanen 2013). Here, read counts were converted to presence/absence and Jaccard's dissimilarity matrices were computed. To enable comparison, outputs were visualized by Non-Metric multidimensional scaling (NMDS) using the METAMDS function and then differences between groupings were tested for significance using PERMANOVA. Species accumulation curves, including standard deviation based on 100 permutations, were computed and visualized using the ‘specaccum’ function in the vegan package (Oksanen 2013). Maps were created using QGIS software (QGIS Development Team 2022). All additional plots and visualizations were made using ggplot2 in R (Wickham 2016).
3 Results
3.1 Overall Fish Community Between River Types
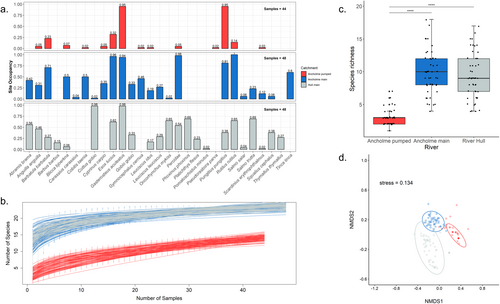
When considering all samples taken across our study, the overall fish community varied between the three river types (Figure 3). The species present and site occupancy values were notably different between river types, with APC appearing to represent a diminished subset of the MRA, dominated by two stickleback species, Gasterosteus aculeatus and Pungitius pungitius (Figure S2), while the overall composition of the MRH is visually different (Figure 3a). The total number of fish species detected across this study was 29, and there were significant differences in species richness between river types (x2 = 84.676, df = 2, p < 2.2e-16), as the APC (n = 14) supported fewer species than the MRA (n = 23) (post hoc Dunn test: Z = 8.29, p < 0.05) and MRH (n = 23) (Z = 7.74, p < 0.05) but MRA and MRH were similar (Z = 0.56, p = 0.58) (Figure 3c). Two species, sand goby (Pomatoschistus minutus) and topmouth gudgeon (Pseudorasbora parva) only appeared in a single sample across the whole study in MRH and APC, respectively; however, they were retained following the low-frequency reads threshold. Excluding single detections within each river type, the species richness retained for the APC = 9 (64.3%), MRA = 21 (91.3%), and MRH = 21 (91.3%). The overall fish community varied significantly between river types (PERMANOVA, R2 = 0.44, df = 2, p = 0.001) (Figure 3d), and further inspection of the data suggests that this is driven by Nestedness in the APC (Figure S1). This highlights that the species-poor APC is largely driven by a subset of the species found in MRA; the main species driving the community here are the two species of sticklebacks (Figure S2). While the MRA has many unique species not present in APC (Figure 3).
3.2 Seasonal Dynamics of eDNA
3.2.1 Ancholme Pumped Catchments (APC)
In the APC, 5/14 species (35.7%) were detected consistently across the four seasonal sampling events (Figure 4a). While no single sampling event detected all species, the highest species richness (n = 10) was in summer and the lowest (n = 7) in spring (Figure 4b). Overall, however, species richness was generally low and statistically comparable between seasons (x2 = 3.09, df = 3, p = 0.3781) (Figure 4c). The overall fish community also did not vary between seasons (PERMANOVA, R2 = 0.03, df = 3, p = 0.982) (Figure 4d).

3.2.2 Main River Ancholme (MRA)
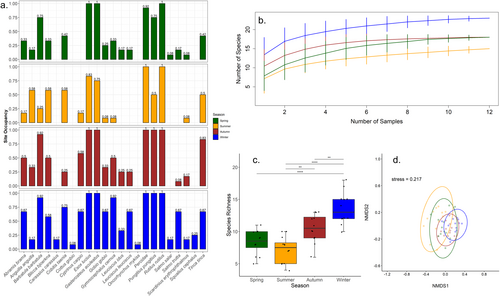
In the MRA, 14/23 species (60.9%) were detected consistently across the four seasonal sampling events (Figure 5a). All 23 species were detected in winter, while summer (n = 15) sampling detected the lowest overall species richness (Figure 5b). Species richness (ANOVA; F = 20.354, df = 3, p < 0.0001) (Figure 5c) and overall fish community (PERMANOVA, R2 = 0.23, df = 3, p = 0.001) (Figure 5d) varied significantly between seasons.
3.2.3 Main River Hull (MRH)
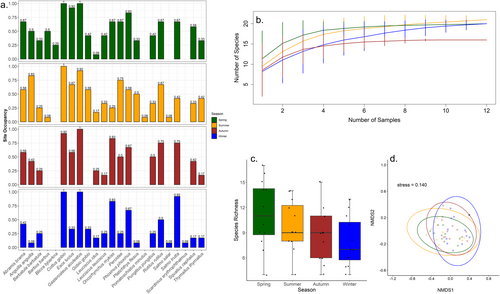
In the MRH, 16/23 species (69.6%) were detected consistently across the 4 sampling events (Figure 6a). While no single sampling event detected all species, the overall species richness was highest in summer (n = 21) and lowest in autumn (n = 16) (Figure 6b), but seasonal differences were not statistically significant (ANOVA; F = 2.3305, df = 3, p = 0.0873) (Figure 6c). However, the overall fish community detected varied significantly between seasons (PERMANOVA, R2 = 0.12701, df = 3, p = 0.015) (Figure 6d).
3.3 Priority Species (Anguilla anguilla)
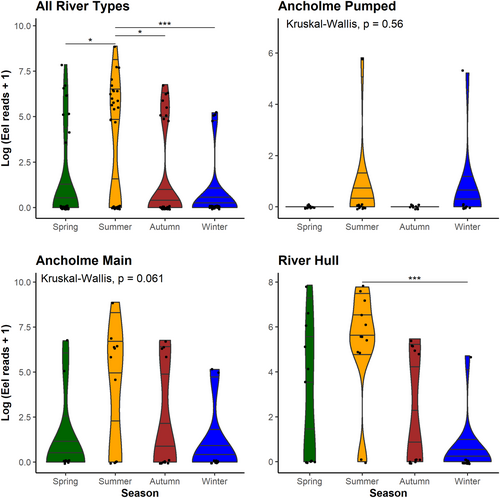
A. anguilla detections were consistently highest in summer between river types (Figure 7), that is, 46.4% of eel detections in the MRA and 45.4% in the MRH. Consequently, across our study, almost half (46.2%) of all eel detections (18/39) occurred in summer sampling events, which was significantly higher than 9/39 (23.1%) in autumn (p < 0.05), 8/39 (20.5%) in spring (p < 0.05), and 4/39 (10.3%) in winter (p < 0.001) (Figure 7). Eels were only detected in two samples within the APC; both detections occurred at the same sampling site in summer and winter. In the MRH, average eel reads were significantly higher (p < 0.001) in summer than in winter sampling events (Figure 7).
4 Discussion
This study for the first time compared the performance of fish eDNA metabarcoding among heavily managed and contrasting lotic environments; 12 tributaries with water pumping stations to regulate water levels (APC), a lowland river regulated by a sluice gate (MRA) and a chalk stream with man-made weirs (MRH). Variation in the seasonal performance of eDNA monitoring was assessed through comparing alpha diversity (i.e., average species richness per sampling occasion) and community similarity (i.e., Jaccard's index). The three river types investigated in this study showed contrasting patterns of seasonal variation in eDNA-based fish detection. Overall species richness was not significantly different among seasons in the APC and MRH, but differed significantly in the MRA. Based on community similarity analysis, there was no overall significant difference among samples from different seasons in the APC, but significant differences were observed in MRA and MRH. There was less seasonal variation in the MRH but marked seasonal differences in the MRA, while the APC showed a significantly impoverished fish fauna irrespective of the monitoring season. We also observed favorable detections of our priority species A. anguilla in summer across all river types, despite significantly higher overall species detectability in the MRA winter samples.
4.1 Seasonal Dynamics of eDNA
The different seasonal responses in eDNA detectability among river types could be driven by differences in their fish communities or abiotic environments, especially hydrological conditions. Previous studies have shown seasonal peaks in detectability of certain species and that these are in turn influenced by their specific ecology and lifecycle traits, especially the timing of spawning activities (Bracken et al. 2019; Bylemans et al. 2017; Di Muri et al. 2022; Inui et al. 2021; Tillotson et al. 2018). This is one potential explanation for the patterns observed in our study, as fish communities varied significantly between the three river types (Figure 3), although the species present in APC were a subset of those detected in MRA (Figure S1). Additionally, the significantly higher detection rates observed in MRA winter samples appear to be driven by a broad increase in the eDNA signal (Figure 5). This suggests that, in this instance, abiotic factors, including hydrological conditions, may be driving seasonal variation in detectability. Indeed, a study by Milhau et al. (2019) found that water flow had a global influence on eDNA-based taxonomic richness, while fish reproductive periods only influenced specific species. Further, it was suggested that sampling in periods of higher flow may be beneficial to obtain a more integrative overview of the fish community (Milhau et al. 2019). In addition, environmental DNA metabarcoding has been found to have increased detection efficiency in the autumn/winter for fish communities in mountain streams (Suzuki, Nakano, and Kobayashi 2022). Our data support this, with significantly increased detectability in winter samples in the MRA. Other studies, however, have reported that increased flow can dilute eDNA concentrations and therefore reduce detectability (Curtis et al. 2021).
More species were detected consistently across all seasons in MRH (69.6%) and MRA (60.9%) than in APC (35.7%). Although, despite the poor consistency of low-frequency species detections in APC, there were no significant differences in species richness or fish community between sampling seasons (Figure 4). By contrast, in the more species-rich MRA and MRH, the fish communities detected varied significantly between sampling seasons (Figures 5 and 6). While both were significant, the MRA community composition was much more variable than that of the MRH (Figures 5d and 6d). Given that the MRA is heavily managed and channelized with a sluice gate regulating river levels at the mouth, flows are more variable. While the MRH is less intensively managed and is a chalk stream with more stable flows, it is still subject to seasonal variation in flow rate (Figure S1). It is possible that the significant differences in seasonal detection in MRA are also driven by these increased fluctuations in hydrological conditions; however, further research into this is required. In addition, water temperature, UV light, and pH levels can all influence the shedding and degradation rates of eDNA (Buxton et al. 2017; Strickler, Fremier, and Goldberg 2015). This could lead to more patchy distributions of eDNA in the absence of high flows leading to mixing and downstream transportation (Pont et al. 2018). With this in mind, it is likely that seasonal changes in fish community detections are influenced by many interacting factors, which may be amplified in highly variable catchments.
4.2 Fish Community in Pumped Catchments
Fish communities varied significantly between the three river types, with significantly fewer species detected in the APC compared to MRA and our regional control site, MRH (Figure 3), although the species present in APC were a subset of those detected in MRA (Figure S1). Furthermore, one consistent characteristic of APC was the low-diversity fish community dominated by the stickleback species G. aculeatus and P. pungitius, which indicates poor habitat quality. It is already well established that pumping stations can lead to fish mortality during downstream passage (Buysse et al. 2014, 2015; Kroes et al. 2020). More recently, Norman et al. (2023b) found extreme flood-relief pump operations significantly altered resident fish populations due to heavily degraded longitudinal habitat and isolated lateral connectivity limiting access to flow refuge. In addition, pumping stations often act as barriers to upstream fish movement, thereby hindering lateral connectivity with the main river (Bolland et al. 2012; Manfrin et al. 2020), including re-colonization following extreme pumping events. Despite this, there was a single low-reads detection of the invasive topmouth gudgeon here in Spring. It seems likely this low-strength single detection is from environmental contamination rather than species introduction. However, careful consideration should be given to any repeat detections since eDNA methodologies can provide early warnings for invasive species presence.
4.3 Targeting Priority Species (Anguilla anguilla)
Despite the variation in overall detectability between river types, we found that A. anguilla detection was consistently favorable in summer and lowest in winter in MRA and MRH (Figure 7). This is in contrast with a recent study by (Burgoa Cardás et al. 2020), which found increased eel detections associated with their upstream migration period (February–April) and reduced detection in the summer months (July). The aforementioned study, however, attributed these increased detection rates to glass eel recruitment leading to additional positive sites downstream in the system, while upstream resident eels were detected consistently through the seasons. In our study, peaks in summer could be due to increased activity and DNA shedding rate of resident eels in conjunction with slower flows allowing eDNA of rare/low abundance species to accumulate by reducing the dilution effect associated with high flows (Curtis et al. 2021). Additionally, resident eels display overwintering dormancy behavior in colder temperatures, where they avoid shallow areas and remain motionless (Westerberg and Sjöberg 2015), likely reducing eDNA shedding. These contrasting results are an example of how eDNA dynamics may not always be uniform across different workflows, river systems, and target species. Regarding the APC, only two detections of A. anguilla occurred across our study, both upstream of the same pumping station. This could suggest an element of increased connectivity at this structure given the catadromous life cycle of A. anguilla, and thus, its absence upstream of 11/12 pumping stations further highlights the lack of upstream passability. This finding is an example of how eDNA-based methods can be applied to prioritize structures for eel regulations, for example. In addition, we would recommend summer months as the optimal sampling period for A. anguilla in such modified river systems.
5 Conclusions
Our findings support that seasonal variation in eDNA patterns is not always comparable between lotic systems, and that this should be taken into consideration when designing and planning future studies and monitoring programs. In addition, flow management is likely to be a contributing factor in this, since it has an impact on eDNA transport and concentration. Previous studies have found conflicting results between seasonal eDNA signals, and our metabarcoding workflow responded differently in our three river types. This has been observed in species-specific analysis, where (Curtis et al. 2021) highlighted that such factors may be as or more important than the density of target species when explaining eDNA outputs. It is acknowledged that eDNA production, persistence, and movement will differ by system and target species (Klymus et al. 2015), and other studies have observed seasonal changes in fish assemblages using eDNA metabarcoding (Milhau et al. 2019; Sales et al. 2021; Suzuki, Nakano, and Kobayashi 2022). Our findings highlight that seasonal variation in eDNA performance for detecting fish communities is not always transferable between contrasting river systems. We also highlight the impact of pumping stations in heavily managed river catchments, leading to an impoverished fish community in comparison with the associated main river channel. While overall seasonal detectability did vary between river types, detection of our target species A. anguilla was favorable in summer, and significantly higher than winter in our naturally flowing control site. Based on these results, we recommend that both biotic (i.e., specific species ecology) and abiotic (i.e., flow modifications) factors of heavily managed river systems should be considered when designing sampling strategies, particularly surrounding the anthropogenic modifications to hydrodynamics and spatial resolution requirements for sampling. Given the highly modified nature of European river systems (Belletti et al. 2020; Szabolcs et al. 2022), and the increasing drive for eDNA integration into aquatic monitoring (Blancher et al. 2022), we emphasize that future research regarding the impact of specific modification regimes on eDNA dynamics should be considered to aid in interpreting results for management purposes.
Author Contributions
N.P.G., B.H., R.M.W., and J.D.B. conceived the ideas and designed methodology. N.P.G., J.A.M., and G.S.S. led on sampling. N.P.G., J.A.M., and P.B. carried out lab and data analysis. N.P.G., B.H., and J.D.B. led the writing of the manuscript. All authors contributed critically to the drafts and gave final approval for publication.
Conflicts of Interest
The authors declare no conflicts of interest.
Open Research
Data Availability Statement
All scripts and the corresponding data have been archived and made available at Zenodo: https://doi.org/10.5281/zenodo.12629881.


