External quality assessment of flow cytometric bronchoalveolar lavage cellular analysis: 20 years' experience in The Netherlands
Abstract
Background
Bronchoalveolar (BAL) cellular analysis can be supportive in the diagnosis of interstitial lung disease. The flow cytometric analysis of BAL fluid cells is complicated by cell fragility and adherence and autofluorescence of macrophages, making conventional analysis of BAL fluid cells as done in external quality schemes (EQA) for blood lymphocyte subsets, not representative. Following a procedure for stabilized BAL cells, a separate EQA was set up. The results of 20 years' experience are presented.
Methods
From each round between 2000 and 2020 the following flow cytometric parameters were recorded from each participant: total lymphocyte population (TLY), CD3+ lymphocytes, CD3+ CD4+ lymphocytes, CD3+ CD8+ lymphocytes, CD3− CD16+/56+ lymphocytes, CD19+ lymphocytes and CD103 + CD3+ lymphocytes. In addition, the eosinophils and neutrophils were recorded. The mean and standard deviation of each parameter per round were calculated. The 40 rounds were divided in four respective groups of 10 in order to compare the results as function of time. In addition the interpretation of the results of participants was scored.
Results
The median SD in the four groups was below 10% for all parameters except for TLY and the CD103+ CD3+ lymphocytes. No improvement in time was observed for any (sub)population except for the CD3+ CD4+ subset. Interpretation of the results varied based on disease, with greatest consensus for sarcoidosis cases and lowest for nonspecific interstitial lung disease cases.
Conclusions
A dedicated EQA for BAL fluid cellular analysis appears to be justified as the test material is substantially different from that of peripheral blood. We show that adequate analytical and post-analytical quality control can be achieved.
1 INTRODUCTION
In patients with interstitial lung disease (ILD) bronchoalveolar lavage (BAL) cellular analysis can support the diagnosis. For accurate interpretation it is required that BAL is performed correctly and that the BAL fluid is handled and processed properly (Barry et al., 2002; Meyer et al., 2012). The cellular analysis consists of leukocyte differentiation in combination with immunophenotyping of lymphocyte subsets. (Gharsalli et al., 2018).
External quality assessment (EQA) programs are important as the backbone of quality control in clinical laboratories. Since the late 1980s EQA programs for flow cytometric clinical cell analysis have been developed (Brando et al., 2007) for many different applications such as leukemia/lymphoma immunophenotyping (Virgo & Gibbs, 2012), CD34+ hematopoietic stem cell enumeration (Levering et al., 2007), peripheral blood lymphocyte subsets (Bainbridge et al., 2018; Levering et al., 2008) or, in leukodepleted blood products, low level lymphocyte counting (Barnett et al., 2001). When an EQA program for enumeration of lymphocyte subsets in BAL was designed in the Netherlands in the late 1990s, no international EQA for this application existed yet at that time.
BAL fluid is a low protein containing fluid in which the stability of the cells is limited as a function of time. BAL fluid contains adhering and autofluorescent macrophages, and lymphocytes in varying concentrations (Tighe et al., 2019). Special attention has to be paid to the pre-analytical and analytical conditions (Preijers et al., 2016) to assure that the BAL cellular profile can be characterized correctly. In 2000, the BAL working group in the Netherlands agreed that a quality control program for the cellular analysis of BAL leukocytes should warrant a separate EQA program in addition to the program for lymphocyte subset analysis in peripheral blood. Therefore, this manuscript summarizes the data compiled in the bi-annual BAL EQA send outs in the period 2001–2020.
Most EQA programs assess the analytical phase, comparing the analytical results. It can be of added value to include (components of) the pre-analytical and post-analytical phase as well. For the post-analytical phase the interpretation of the results and the advice given to clinicians are items that can be included in an EQA program (Preijers et al., 2016). In the Dutch protocol for BAL analysis (https://www.skml.nl/uploads/7e/38/7e3890e983d3886843389cf9b33c34d8/Consensusprotocol-voor-onderzoek-op-BAL-materiaal.pdf, accessed July 22, 2022) revised in 2016, recommendations are given how to summarize the results of the analysis and which components of the analysis have to be mentioned in the final report (Table 1).
| Cytometric items | Microscopic items |
|---|---|
Leukocyte count Leukocyte differentiation Lymphocyte subsets T-cell subsets (preferably related to peripheral blood) CD103 expression on CD4+ T cells |
Presence of: Epithelial cells Bacteria Asbestos Inclusions in macrophages Hemosiderin positive macrophages |
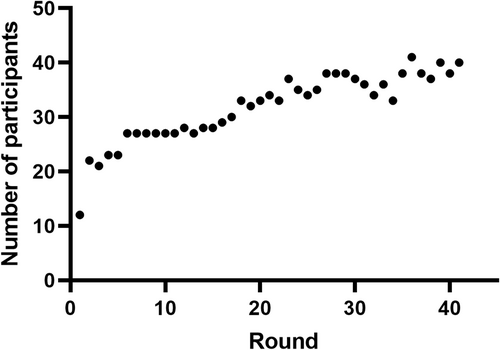
Since BAL fluid contains adhering macrophages and cells are collected in a milieu containing only low concentrations of protein, its cellular components have to be preserved in order to be suitable as external control material. For this purpose, a stabilization method has been developed (Eidhof et al., 2021). A pilot experiment with this stabilized material was performed with 12 participants from different parts of the Netherlands (Figure 1, represented by leftmost data point). Since this pilot experiment was considered successful, each subsequent year two send outs with a stabilized BAL were distributed (one in spring, one in autumn). Ever since, the number of participants has grown to around 40 in the Netherlands and Belgium (Figure 1). From 2001, this BAL program is embedded in the Dutch EQA organization Stichting Kwaliteitsbewaking Medische Laboratoria (SKML). Each autumn the outcome of both rounds is discussed during a general assembly of the participants. At these meetings the outcomes of the technical performance and the correct interpretation of the results are discussed, and recommendations about analysis and correct formulation of the conclusion are given.
Here, we review 20 years of experience with this EQA program. We addressed whether or not the analytical performance improved over the years and for which parameters. Finally, we addressed whether improvement was seen regarding the correct interpretation of the results as a function of time.
2 MATERIALS AND METHODS
2.1 Preparation of cell suspensions for EQA exercises
The coordinating center selected twice a year from left-over BAL fluid a sample with sufficient leukocytes and ideally a lymphocyte population >10%. Unstained cytospins were produced for each participant from these left-over BAL fluid cells. Thereafter the cells were stabilized conform the procedure as described in Eidhof et al., 2021. The leukocyte concentrations and the homogeneity of the suspension were monitored during and after preparation of the EQA vials. For each exercise, each participant received a vial containing stabilized cells, an unstained cytospin and a description of the anonymized case, including relevant clinical information.
The recipients were asked to perform analysis of the leukocyte and lymphocyte subsets, and to interpret the results in the same way as they routinely perform BAL lymphocyte subset analysis. The results were reported to SKML. In response, each participant received a report with their performance compared to the All Labs Trimmed MEAN (ALTM) statistic of all participants (Thelen et al., 2017).
2.2 Analysis of EQA results (2001–2020)
Forty samples have been distributed in addition to the pilot sample in 2000. Since in this period no major changes in the design of the EQA program had been made, we arbitrarily chose to divide the 40 samples in four subsequent cohorts of 10 samples and compared these cohorts with those of the pilot sample and each other. These data are shown in Figure S1 as reference.
The data collected included total leukocyte number and percentages of granulocytes and eosinophils (from cytospin countings). The percentages of the lymphocytes and the major lymphocyte subsets (CD3+, CD3+ CD4+, CD3+ CD8+, CD19+, CD3- CD16+/CD56+) were determined by flow cytometry. In addition, the co-expression of the integrin alpha E (ITGAE, also known as CD103) on CD3+ cells as a marker for intra-epithelial T lymphocytes was recorded.
The participants interpretation of the results were scored as correct, incorrect or no interpretation given. Correct, if the final clinical diagnosis was mentioned in the differential diagnosis in the conclusion of the BAL. Incorrect, if the final clinical diagnosis was not mentioned in the differential diagnosis or was excluded in the interpretation. No interpretation given was scored if the final conclusion that was reported, did not contain a possible clinical diagnosis or did not exclude such diagnosis.
2.3 Statistical analysis
Standard deviation of the mean per parameter per round in the four groups were compared with Kruskal-Wallis test. If significance was observed the four groups were compared to each other using Mann Whitney with Bonferroni correction. Linear regression was done to detect changes over time. This was statistically tested using F-test.
3 RESULTS
3.1 Analysis of cell populations
The pilot experiment was started in 2000 with 12 laboratories. After presenting and discussing the results of the pilot experiment the bi-annual EQA program was started in 2001. The number of participants has grown steadily from 20 in 2000 to 41 in 2018, to remain around 35–40 thereafter (Figure 1).
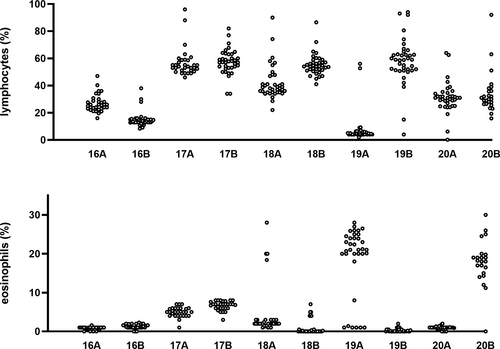
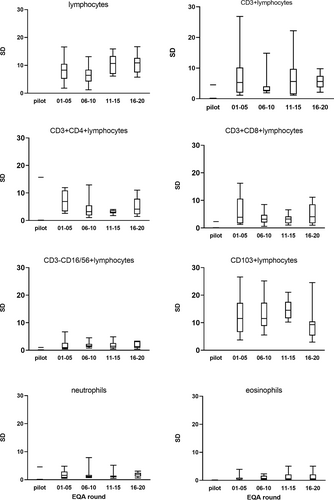
To evaluate whether or not there was improvement of the performance of the laboratories with regard to the lymphocyte subsets the standard deviation (SD) was calculated for each parameter after the database had been divided in four subsequent groups of each 10 EQA rounds. All the original data are shown in the Figure S1 and an example of the results of the lymphocyte and the eosinophil population in the first (lymphocytes) and last (eosinophils) rounds are highlighted in Figure 2. In Figure 3 Box-Whisker plots show the standard deviation per parameter per group compared to the pilot experiment. Using Kruskal-Wallis a significant difference was found for the lymphocyte measurement (p = 0.03) and an almost significant difference for the eosinophils (p = 0.06) and CD103+ lymphocytes (p = 0.05). Sub-analysis of the four groups showed that after correction for multiple comparison statistics using the Bonferroni correction (Bland & Altman, 1995), no significance was left (all corrected p values >0.008, i.e., 0.05/6). To see if the changes constituted an improvement or deterioration in time, linear regression was performed. This analysis showed some improvement of the SD of the CD4+ population in time (p < 0.03) and a deterioration of the SD of the eosinophils (p < 0.05). The other changes did not reach significance (data not shown).
3.2 Interpretive comment
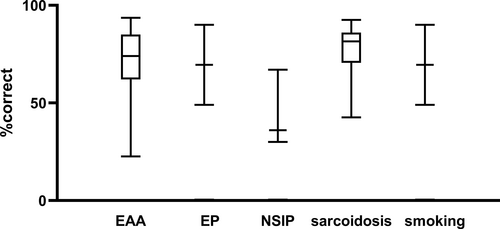
The mean number of correct interpretation of the results of the analysis in combination with the clinical information varied between 30 and 100%. In general when the final diagnosis was sarcoidosis (n = 20), smoking related abnormalities (n = 2), eosinophilic pneumonia (n = 2) or extrinsic allergic alveolitis (EAA) (n = 11), most participants mentioned these diseases in the differential diagnosis, whereas the majority of the interpretations in cases with non-specific interstitial pneumonia (NSIP) did not mention this outcome (Figure 4, median proportion of correct answers 36%). The correct interpretation in the other six samples ranged from 40% to 80% and these consisted of normal lavage (n = 1), Glivec® induced pneumonitis (n = 1), scleroderma (n = 1), chronic obstructive pulmonary disease (n = 1), smoking related ILD (n = 1). The sixth sample had been manipulated by the coordinating laboratory, that is, by mixing peripheral blood lymphocytes in the lavage, in order to obtain a test sample with sufficient lymphocytes. This sample was not scored for correct interpretation.
4 DISCUSSION
External quality assessment allows for a comparison of a laboratory's testing procedures to other laboratories. EQA samples should be treated as if they are a patient sample and the EQA sample should be as patient-like as possible. Since BAL fluid is a low protein containing fluid in which the stability of the cells is limited in time and BAL fluid contains large numbers of adhering and auto fluorescent macrophages, the EQA program for lymphocyte subsets in peripheral blood was considered not representative for BAL fluid. The cells recovered from the lung by lavage are much more heterogeneous than the cells obtained from the peripheral blood. The major cell populations include macrophages, neutrophils, eosinophils, and lymphocytes. Often the fluid contains a considerable amount of erythrocytes. Less frequently mast cells, plasma cells, squamous and alveolar epithelial cells are observed. This heterogeneity of cellular populations makes that light scatter patterns often show overlapping clusters of cells and debris, in which specific lymphocyte populations are difficult to delineate. Cellular autofluorescence and nonspecific binding can strongly mimic specific staining of dimly expressed markers. In 2000, effort was made to set up an EQA program with BAL fluid as sample type. Since nucleated cells in BAL fluid degrade quickly and adherence of macrophages can be a problem (Harbeck, 1998) a stabilization method was developed to preserve the cells (Eidhof et al., 2021). To our knowledge, the current EQA program is unique: we are not aware of similar programs with low protein containing samples as BAL or cerebrospinal fluid (CSF) cell immunophenotyping that have 20 years of experience. UK-NEQAS has a program on Immunophenotyping of leukemic cells into CSF, this program runs as a pilot program that has started in 2019.
In 20 years, 40 rounds have taken place. In order to evaluate the performance of the participants over time, we compared the standard deviations of the lymphocyte subset populations over time dividing the cohort in four subsequent sub-cohorts of 10 rounds. The SD of the percentage of lymphocytes and the SD of the CD103+ positive lymphocyte population were high in comparison to the other flow cytometric markers. The composition of the EQA samples was diverse over the years. Some had low lymphocyte numbers, some high, all representing daily practice in BAL analysis. When expressing the SD in relation to the size of the population, i.e. as coefficient of variation (CV), it was clear that smaller lymphocyte populations had higher CV (Figure S2). As the heterogenous composition of the cellular components of the BAL fluid can interfere with unequivocal gate setting, a well-defined strategy is important. Although over time more participants have chosen for CD45side scatter gating instead of forward-side scatter gating and multi-color flow cytometry is common, the SD did not improve over time. In fact, the SD of the forward- side scatter gating group was lower than in the CD45 side scatter gating group (data not shown). However since the number of laboratories that used forward-side scatter gating was much lower in comparison to the CD45 side scatter gating this may have an impact in lowering the SD. No or incomplete data were recorded about number of events measured, type of flowcytometers or used monoclonal antibody clones.
The SD of the CD103+ lymphocyte population was also relatively high compared to the other flow cytometric markers. CD103 expression on lymphocytes is not routinely measured in peripheral blood. In the lavage the CD103-CD4+ CD3+ population is thought to represent the CD4+ lymphocytes that intruded the bronchoalveolar space from the peripheral blood in contrast to the CD103 + CD4 + CD3+ lymphocytes representing the epithelial residing lymphocytes. CD103 was added to the EQA in 2002 as novel marker. In the annual participant meetings, it was outlined that, since CD103 expression can be dim on CD3+ lymphocytes, an antibody with a stronger fluorochrome should be chosen and the monoclonal antibodies chosen to detect CD103 should be titrated to optimal discriminate positive and negative populations. We saw the SD of the CD103+ population decline as a function of time although outliers still occurred (data not shown) but data are missing to link this observation directly to the given advice regarding conjugates and titrations.
The size of the lymphocyte population in the lavage is the most important parameter in the analysis. This parameter skews the differential diagnosis to lymphocyte poor or lymphocyte rich ILDs. Although for the interpretation of the results no definite lymphocyte cut-off values do exist, it is disappointing to see that the SD for this parameter is relatively high (round 10%) in comparison to the others (≤5%) and did not improve in time. In order to assess the performance achieved in this EQA we looked for literature on EQA on lymphocyte populations in order to compare but did not find comparable studies with reported standard deviation or coefficient of variation for the lymphocyte population as a whole. Bainbridge et al (Bainbridge et al., 2018) published an evaluation of 11 years on immune monitoring program data from UK NEQAS with 132 samples distributed to 1287 participants. This enabled them to demonstrate that duration time of participation in the EQA program was a significant contributor for improvement of the absolute residual of lymphocyte subsets. However, their data are all on absolute numbers and as such not comparable to our data. Levering et al. (Levering et al., 2007; Levering et al., 2008) chose in their evaluations on CD34+ stem cell enumeration and on lymphocyte subset enumeration to present their data related to a benchmark data set. This approach, however, is impossible with the present study design and data.
Next important parameters for the clinical interpretation are the eosinophils and neutrophils, skewing the diagnosis to or from diseases with fibrotic components. The SD of those parameters were consistently low (Figure 2 and supplemental data Figure 1), however for the SD of the eosinophilic population we observed a small but significant deterioration in time. For the eosinophils we observed greater variation in results with increasing size of the population (see Figure S2). This may be due to the use of different technologies, that is, counting using cytospins vs flow cytometry.
Since the late 1990s, a Dutch protocol for cellular analysis of BAL is in force. This protocol not only pays attention to the technical requirements of the analysis but also recommends which components of the analysis should be reported to the clinician. Aside from the cellular composition specific aspects have to be named because they can point the clinician to a diagnosis (detailed in Table 1). From the beginning of the EQA program, we asked the participants to report the outcome of the analysis of the EQA sample in the same way as for their regular analysis of lavage cells. The participants received relevant clinical information about each case and were able to report their outcome as free text. As a result, the post-analytical phase is included in this EQA. Since in this program for flow cytometric analysis stabilized cells are sent out and all participants receive a cytospin with unmanipulated cells for microscopic evaluation as reference, the pre-analytical phase is not covered by this EQA.
Interpretation of the results of the analysis of both the microscopic and the flow cytometric determined components of the lavage must be done with consideration of both the clinical information and the results of radiology. A description which interstitial lung disease(s) is/are most compatible with the obtained results in the context of the clinical information and radiology results is appreciated by the clinicians. In each EQA round of the program clinical and radiological data are given and the participants are invited to formulate their interpretation. Evaluation of these comments showed that the clinical interpretation from samples from sarcoidosis, eosinophilic ILD or extrinsic alveolitis patients showed high concordance among the participants and high concordance with the final clinical diagnosis in contrast to interpretations of lavages from patients with connective tissue related ILD. This is not a surprising outcome since BAL cellular analysis has been from the beginning quite common in case of sarcoidosis and extrinsic alveolitis and characteristics of the expected cellular profiles have been published extensively. The role of interstitial lung disease in connective tissue disease has since the last past years gotten far more attention, but much less is known about specific characteristics (Meyer et al., 2012).
In summary, EQA of BAL fluid has been performed in the Netherlands since 2000. The outcome of the rounds was discussed in annual meetings. The growing number of participants from 12 to 42shows that this program meets a need. We show that EQA with BAL cells is feasible, and enables laboratories to compare their analytical and post-analytical performance, as is required for ISO15189 accreditation.


