Programmed death-ligand 1 expression and prognostic significance in bevacizumab treated ovarian cancer patients: Results from the phase IV MITO16A/MaNGO OV-2 translational study
Present Address: Domenica Lorusso, Clinical Pathology Unit, ASFO “Santa Maria degli Angeli” Hospital of Pordenone, Pordenone, Italy.
Eliana Pivetta, Faculty of Medicine and Surgery, Humanitas University, Milan, Italy, and Operative Unit of Gynecologic Oncology, Humanitas San Pio X, Milan, Italy.
S. Pignata and G. Baldassarre equally contributed as senior authors to this work.
F. Basso-Valentina, V. Canzonieri and R. De Cecio equally contributed to this work.
Dear Editor,
We are pleased to present our latest analyses, showing that multiple immunofluorescence (MIF) can be used in large multicenter clinical trials to define the prognostic/predictive value of programmed death-ligand 1 (PD-L1) by concomitantly and precisely assessing its expression and spatial distribution in the tumour tissue, outperforming classical immunohistochemistry (IHC).
Immunotherapy with Immune Checkpoint Inhibitors (ICIs) has revolutionized cancer treatment, becoming the primary therapeutic option for several types of tumours.1 One of the main ICIs targets is the PD-1/PD-L1 axis, and the assessment of PD-L1 expression by IHC is used as a predictive biomarker of response. Although ICIs have not proven successful for Epithelial Ovarian Cancer (EOC) patients and PD-L1 expression did not show a predictive value,2-4 new results of the Keynote-B96 trial suggest otherwise and support the research for better biomarkers of ICIs activity. Accordingly, while new studies have explored the combination of ICIs with targeted agents in EOC—such as PARP inhibitors and the anti-angiogenic agent bevacizumab (BEV)—and are supported by growing evidence that BEV can modulate the tumour microenvironment (TME) and enhance ICIs efficacy through synergistic effects, these efforts have largely failed due to the lack of reliable predictive biomarkers to identify patients most likely to benefit.5, 6 Here, we analyzed by Multiple Immuno-Fluorescence (MIF) the expression and spatial localization of immune cells and PD-L1 in 292 samples from patients enrolled in the prospective phase IV MITO16A-MaNGO OV-2 clinical trial, which aimed to explore the prognostic role of selected clinical and biological factors in EOC patients treated in first line with standard chemotherapy plus BEV (Table 1 and Figure S1).7 The choice of using MIF relies on the possibility of precisely assessing biomarkers’ spatial distribution in the tissue and of defining which cell types express PD-L1 in the tumour or the surrounding stroma.
| Population enrolled (n = 398) | Patients in analysis for IHC (n = 100) | Patients in analysis for MIF (n = 292) | ||||
|---|---|---|---|---|---|---|
| 59.1(49.8–66.5) | 60.7 (48.8–66.5) | 59.2 (49.8–66.5) | ||||
| Median age (IQR) | n | (%) | n | (%) | n | (%) |
| Age category | ||||||
| < 65 | 278 | (70) | 67 | (67.0) | 202 | (69.2) |
| ≥65 | 120 | (30) | 33 | (33.0) | 90 | (30.8) |
| ECOG performance status | ||||||
| 0 | 315 | (79.2) | 87 | (87.0) | 234 | (80.1) |
| 1 | 69 | (17.3) | 13 | (13.0) | 51 | (17.5) |
| 2 | 14 | (3.5) | 0 | (0) | 7 | (2.4) |
| Residual disease | ||||||
| None | 153 | (38.4) | 42 | (42.0) | 115 | (39.4) |
| ≤ 1 cm | 72 | (18.1) | 22 | (22.0) | 60 | (20.5) |
| > 1 cm | 120 | (30.2) | 31 | (31.0) | 90 | (30.8) |
| Not operated | 53 | (13.3) | 5 | (5) | 27 | (9.2) |
| FIGO stage | ||||||
| IIIB | 36 | (9.1) | 11 | (11.0) | 27 | (9.2) |
| IIIC | 275 | (69.1) | 70 | (70.0) | 207 | (70.9) |
| IV | 87 | (21.9) | 19 | (19.0) | 58 | (19.9) |
| Tumor histology | ||||||
| High Grade serous | 333 | (83.7) | 82 | (82.0) | 254 | (87.0) |
| Low Grade serous | 13 | (3.3) | 6 | (6.0) | 9 | (3.1) |
| Endometrioid | 9 | (2.3) | 3 | (3.0) | 8 | (2.7) |
| Clear Cell | 11 | (2.8) | 3 | (3.0) | 10 | (3.4) |
| Mucinous | 3 | (0.8) | 0 | (0) | 1 | (0.3) |
| Mixed | 4 | (1.0) | 2 | (2.0) | 2 | (0.7) |
| Other | 25 | (6.3) | 4 | (4.0) | 8 | (2.7) |
- IHC = Immunohistochemistry.
- MIF = Multiple Immuno-Fluorescence.
- IQR = Interquartile Range.
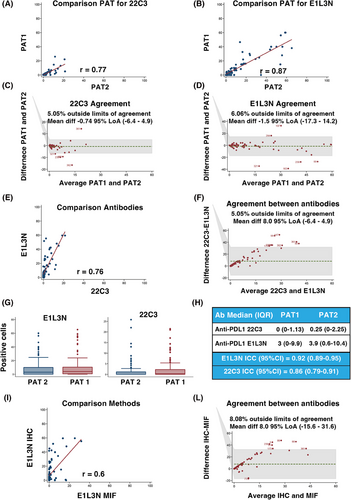
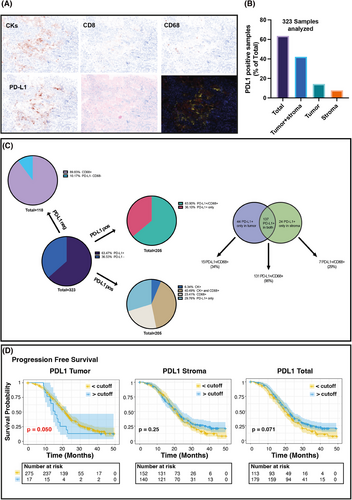
We first compared two different anti-PD-L1 antibodies, and assessed their concordance in scoring PD-L1 on 100 selected samples, using IHC which is the gold standard for PD-L1 evaluation in the clinic.8 Statistical analyses showed high correlation and concordance between two independent pathologists and the two antibodies (Figure 1A–G). The anti-PD-L1 E1L3N antibody demonstrated slightly better performance in scoring PD-L1 positivity and was selected for MIF analyses (Figure 1H and Figure S2). The correlation and the agreement between MIF and IHC using the E1L3N antibody were very high, demonstrating that the evaluation of PD-L1 by MIF is comparable to classical IHC (Figure 1I-L) although, as expected, the percentage of positive cells decreased approximately 40-fold in MIF computer-assisted count compared to the human evaluation (Supporting Information results). On these bases, we moved to large-scale MIF analyses and stained 326 samples from 292 patients for the expression of CD8 (tumour infiltrating T cells), CD68 (tumour infiltrating monocyte/macrophages), cytokeratins (tumour cells), and nuclei, along with CD274 (PD-L1) (Figure 2A). Five color-stained slides were studied using a multispectral camera and computer-assisted analyses. Pearson correlation analyses demonstrated a high correlation in PD-L1 expression between primary and metastatic lesions in 32 patients who donated both samples (r = 0.83; p < 0.0001). Sixty-three per cent of the analyzed samples were positive for PD-L1 expression, and most of the positive samples had PD-L1-positive cells both in the tumour and the stroma (Figure 2B). By analyzing the expression and localization of PD-L1, we observed that the majority of PD-L1-positive samples were also positive for CD68 (64%), suggesting that the major source of PD-L1 in the analyzed EOC samples was due to the presence of cells from the monocyte/macrophage lineage. Among PD-L1-positive samples, 6% contained cells that expressed PD-L1 only on the tumour cells (PD-L1+/CK+), while 23% of the samples had cells that were PD-L1+/CD68+ only. Finally, for 30% of the samples, we were unable to identify the cell subtype that expressed PD-L1 (Figure 2C). PD-L1 negative samples were mostly CD68 positive, further supporting the notion that cells from the monocyte/macrophage lineage were the immune cells predominantly present in EOC samples.9


We then asked whether PD-L1 expression (positive vs. negative, Figure S3) and spatial distribution could have any prognostic significance in the MITO16A population, applying univariate or multivariable analysis. In univariate analyses, PD-L1 did not significantly predict tumour prognosis for progression-free survival (PFS) or overall survival (OS) (Table S1). However, when the model was adjusted for the clinical variables age, ECOG performance status, residual disease, FIGO stage and tumour histology, PD-L1 negative samples in the stroma and in both stroma and tumour were associated with a significantly worse prognosis both in PFS (Hazard Ratio [HR] = 1.57, p = 0.003) and in OS (HR = 1.56, p = 0.048) (Table 2).
| Progression-free survival | Overall survival | |||||
|---|---|---|---|---|---|---|
| MODEL PD-L1 | HR | (95% CI) | p | HR | (95% CI) | p |
| Tumour—Continuous linear | 1.00 | (0.99–1.01) | 0.167 | 1.57 | (0.65–3.76) | 0.316 |
| Tumour—Zero value | 1.08 | (0.79–1.49) | 0.629 | 0.83 | (0.31–2.21) | 0.709 |
| Stroma—Continuous linear | 1.00 | (0.99–1.01) | 0.453 | 1.00 | (0.99–1.01) | 0.278 |
| Stroma—Zero value | 1.40 | (1.01–1.93) | 0.044 | 1.52 | (0.96–2.4) | 0.077 |
| Sum—Continuous linear | 1.00 | (0.99–1.01) | 0.109 | 1.00 | (0.99–1.01) | 0.492 |
| Sum—Zero value | 1.57 | (1.17–2.11) | 0.003 | 1.56 | (1.00–2.42) | 0.048 |
- Model adjusted for age (as category < 65 vs. ≥65), ECOG performance status (0 vs. 1–2), Residual disease (None; ≤1 cm; > 1 cm; not operated), FIGO stage (III vs. IV) and Tumor histology (High-Grade Serous vs other).
- HR = Hazard Ratio.
- CI = Confidence Interval.
- p = p-value.
- In bold significant differences.
We then searched for the best cutoff that minimizes the p-value of Hazard Ratio (HR) for PD-L1 total, tumoural, and stromal expression. Very high expression of PD-L1 (best cutoff = 117.9) in the tumour was associated with increased HR for PFS (Figure 2D and Table S2). A high number of PD-L1+ cells in the tumour (HR = 2.08 p = 0.014), and a low number (<0.3) of PD-L1+ cells in the stroma or the whole tumour section were associated with shorter PFS (HR 0.65, p = 0.005 for stroma and HR 0.65, p = 0.003 for total PD-L1) but not OS (Figure S4 and Table S3). However, in both cases, when adjusted for overfitting HR estimates using the bootstrap-percentile method,10 the associations did not maintain statistical significance (Tables S2 and S3).
This study has some limitations that include the type and number of analyzed cells, the impossibility of comparing the results with other techniques and the percentage of staining failure.
Despite these limitations, we propose MIF as a feasible technique with potential clinical utility for the analysis of the spatial distribution of selected biomarkers. Our data suggest that the absence of PD-L1-positive cells in the tumour, along with the presence of PD-L1-positive cells in the stroma of EOC, could be associated with a better prognosis when BEV is added to the standard chemotherapy. The evaluation of PD-L1 expression using MIF in future prospective ICI trials is warranted to properly evaluate its predictive value.
AUTHOR CONTRIBUTIONS
Conceptualization: GB and SP; Data curation: VC, FBV, EP and RDC; Formal Analysis: PC and LA; Funding acquisition: GB and SP; Investigation: VC, FBV and EP; Methodology: DR, AS, DC, GS and ADM; Project administration: GB, SP and FP; Resources: SP, DL, SCC, GA, CDA, SC and VS; Software: GB and SP; Supervision: GB and SP; Validation; Visualization: GB and FBV; Writing—original draft: GB, FBV and SP; Writing—review & editing: GB, FBV and SP. All authors read and approved the manuscript.
ACKNOWLEDGEMENTS
We are grateful to the patients who consented to donate their tumour samples and all the members of the MITO group for their support.
Open access funding provided by BIBLIOSAN.
CONFLICT OF INTEREST STATEMENT
The authors declare no conflict of interest.
FUNDING INFORMATION
This work was supported by grants from: CRO Aviano Ricerca Corrente core grant (linea 1) of Ministero della Salute (G. Baldassarre); Associazione Italiana Ricerca sul Cancro (AIRC) (IG 26253) (G. Baldassarre); Alleanza Contro il Cancro (ACC) (RCR-2022-23682287) (G. Baldassarre); Ministero della Salute (PNRR-MAD-2022-12375663) (G. Baldassarre); Ministero Università e Ricerca (MIUR) (ARS01_00568) (G. Baldassarre); Ministero della Salute (CO-2018-12367051) (S. Pignata); Associazione Italiana Ricerca sul Cancro (AIRC) (IG 25932) (S. Pignata); Ricerca Corrente L3/13 of Ministero della Salute (S. Pignata); Associazione Italiana Ricerca sul Cancro (AIRC) (Italy Post-Doc Fellowship 29639 and 31335) (F. Basso-Valentina).
ETHICS STATEMENT
MITO16A-MaNGO OV-2 is a phase IV multicenter single-arm registered trial (www.clinicaltrials.gov number: NCT01706120). The study was approved by the Ethics Committee and all patients provided written informed consent.
Open Research
DATA AVAILABILITY STATEMENT
Data sharing is not applicable to this article as no datasets were generated during the current study.


