Spatial transcriptomics reveals regional characteristics of lupus nephritis in murine kidneys and immune response to prednisolone or Gancao Nourishing-Yin decoction therapies
Yanjuan Chen and Yong Chen have contributed equally to this work.
Dear Editor,
This study reveals the spatial immune landscape in Lupus nephritis (LN) mouse kidneys and evaluates the therapeutic effects of prednisolone (PDL) and Gancao Nourishing-Yin decoction (GCNY).
LN is a major cause of end-stage renal disease and increases mortality in systemic lupus erythematosus patients.1 Current treatments—glucocorticoid, cytotoxic drugs, and biological agents are effective but come with notable side effects.2 Traditional Chinese medicine (TCM) has recently shown promise in addressing LN-related kidney injury.3 Our previous research found GCNY, a TCM formulation, demonstrated anti-inflammatory and antioxidative effects,4, 5 suggesting that GCNY could be a complementary or alternative treatment for LN by modulating immune responses. Since glucocorticoids are considered a fundamental therapy,2 PDL was chosen as the control for GCNY treatment.
Spatial transcriptomics (ST) is a powerful tool for investigating the cellular dynamics and therapeutic effect in LN kidneys.6 In 2023, Tang et al. applied ST to LN patient kidney biopsies, identifying elevated APOE+ monocytes that facilitated macrophage trafficking.7 In this study, we conducted ST on kidney tissues from lupus-prone MRL/Lpr (Lpr) mice, Lpr mice treated with either PDL or GCNY, and MRL/Mpj (Mpj) control mice, using 10× Genomics Visium platform (Figure S1A). After bioinformatic analysis, totally 16 428 spatial spots and 32 285 genes were identified, exceeding 670 spots and averaging 3984 genes and 15 404 unique molecular identifiers (UMIs) per sample (Figure S1B). UMAP analysis showed effective integration across all groups (Figure S1C). Unsupervised clustering classified the spots into six regions 1–6, with region 2 having the fewest genes and UMIs, possibly due to its unique cell types (Figure 1A, Figure S1D). Region 1 was the largest, followed by regions 2 and 3 (Figure 1B).
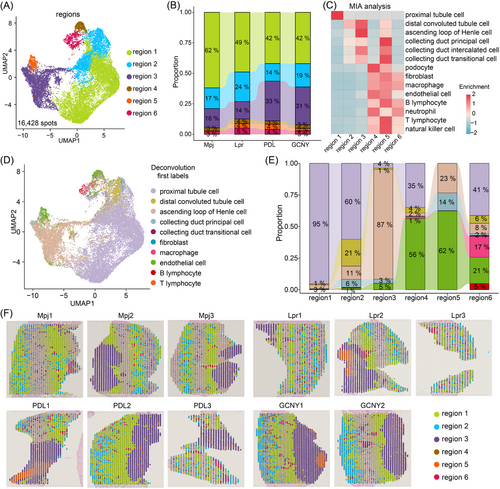
Using the scRNA-seq data as a reference (Figure S1E),8 the multimodal intersection analysis (MIA) indicated region 4, 5 and 6 mainly comprised podocytes, macrophages, neutrophils, T/B lymphocytes and natural killer cells (Figure 1C). The abundance of immune cells in regions 4–6 was highest in Lpr mice and reduced in PDL-treated or GCNY-treated mice (Figure 1B). Aligning with MIA results, spatial deconvolution analysis showed region 1 as predominantly proximal tubule cells and region 3 as mainly ascending loop of Henle cells (Figure 1D,E). Regions 4 and 6 exhibited the greatest variety of immune cell types, such as B lymphocytes and macrophages (Figure 1E). Based on spatial localization, regions 4 and 6 are scattered in the renal cortex, indicating their potential involvement in glomerular inflammation (Figure 1F). The characteristics of regions are detailed in Figure S2A–C. These results offer insights into the distinct spatial landscapes of LN kidney.
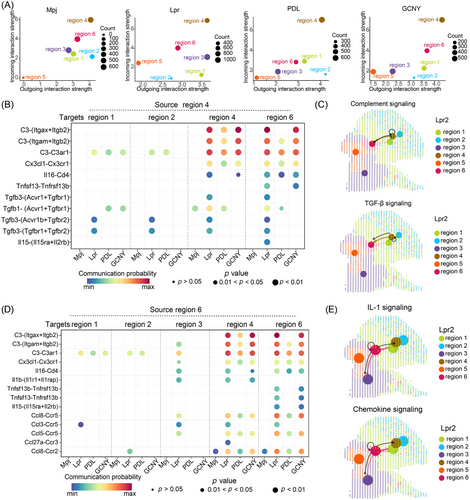
CellChat analysis showed that Lpr mice exhibited the highest level of cell-cell interactions, which decreased with PDL or GCNY treatments (Figure S3A). The majority of interactions were concentrated in regions 4 and 6, areas rich in immune cells (Figure 2A, Figure S3B). In Lpr mice, complement signalling was notably elevated between these regions through Itgax-Itgb2, Itgam-Itgb2 and C3-C3ar1 ligand-receptor interactions (Figure S3C,D; Figure 2B,C). Similarly, transforming growth factor-β (TGF-β) signalling was upregulated via Acvr1-Tgfbr1, Acvr1b-Tgfbr2, and Tgfbr1-Tgfbr2 receptor pairs. Region 6 also interacted with itself and region 4 through complement-related ligand-receptor pairs (Figure 2D,E). Interleukin-1 (IL-1) signalling was particularly directed from region 6 to regions 3 and 4 in Lpr mice. Additionally, chemokine signalling was elevated among regions 3, 4, and 6 through Ccl8-Ccr5, Ccl3-Ccr5 and Ccl5-Ccr5 pairs (Figure 2D,E). The complement, TGF-β, IL-1 and CCL signalling were significantly diminished in treated kidneys. These pathways likely contribute to the anti-inflammatory effects of PDL and GCNY in treating LN.
Macrophages are the key contributors to inflammation in LN.7 Deconvolution analysis showed that macrophages accounted for 2% of kidney cells in Lpr mice (Figure S1F). Scoring of macrophage-specific genes confirmed their elevated presence in region 6 and region 4 (Figure S4A). Additionally, the score level was increased in LN kidneys, which significantly declined after treatment (Figure S4B,C). GSEA revealed suppression of lymphocyte and complement pathways in macrophages after PDL treatment (Figure S4C). In GCNY-treated mice, lymphocyte activation was also downregulated but innate immunity pathways remained active (Figure S4D). However, immune-related pathways were still activated in GCNY-treated mice compared with PDL-treated mice (Figure S4E).
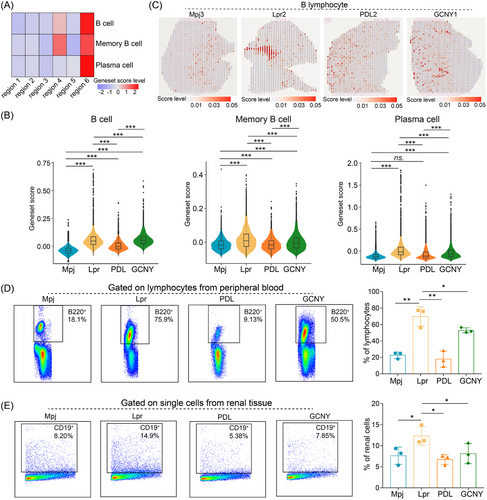
In LN, the infiltration of B cells and plasma cells into renal tissues worsens inflammation.1, 6 Scoring of B cell-related genes confirmed their elevated presence in region 6 and region 4 (Figure 3A). Compared to control mice, Lpr mice demonstrated a marked increase in B cell infiltration in the kidneys (Figure 3B,C). Treatment reduced the abundance scores of memory B cells and plasma cells (Figure 3B). Flow cytometry further confirmed a decrease in peripheral B220+ B cells and renal CD19+ B cells following PDL or GCNY therapy (Figure 3D,E). GCNY's immunosuppressive effect appears milder than PDL's. TCM, including our GCNY formula, tends to have a slower onset of action compared to the more rapid effects of chemical drugs like PDL.
Additionally, signatures scores for T cells and natural killer cells were highest in region 6 (Figure 4A). These score levels were also declined post-treatment; however, the anti-inflammatory effects of GCNY were less pronounced than those of PDL (Figure 4B,C). Previous research has indicated that immune cell clusters, identified as tertiary lymphoid structures (TLS), progressively form in LN kidneys.9 Our current study recognized TLS enriched with immune cells in the Lpr2 slice, which showed elevated enrichment scores for macrophages, B cells, and T cells (Figure 4D). Cells in the TLS expressed high levels of markers for leukocytes (Ptprc), T cells (Cd3e, Cd4), B cells (Ms4a1), plasma cells (Cd79a), macrophages (Cd68), and dendritic cells (Itgax).7, 8, 10 On contrast, low expression of Cd8a suggested the TLS in LN kidney tissue contained few CD8+ T cells.
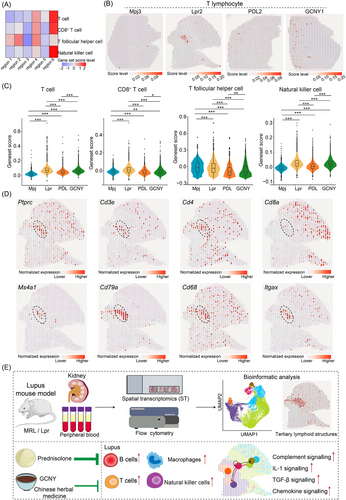
Taking together, this study uncovers the regional characteristic in the LN kidney and captures a snapshot into TLS (Figure 4E). We found that GCNY treatment affected macrophage, B cell and T cell populations, though further research is needed to clarify the underlying mechanisms. These results offer insight to GCNY's therapeutic potential and provide a foundation for future clinical applications.
AUTHOR CONTRIBUTIONS
Yanjuan Chen: Conceptualization; data curation; formal analysis; funding acquisition; investigation; methodology; project administration; resources; validation; visualization; funding acquisition; writing—original draft; writing—review and editing. Yong Chen: Conceptualization; investigation; methodology; resources; software; visualization; funding acquisition; writing—review and editing. Xufa Yang: Resources. Xiaoping Hong, Dongzhou Liu and Zhenyou Jiang: Supervision; funding acquisition; writing—review and editing.
ACKNOWLEDGEMENTS
We would like to thank the editors and reviewers who helped improve this presentation. We thank the staff members of the Animal Center of Shenzhen People's Hospital, Shenzhen, China.
CONFLICT OF INTEREST STATEMENT
The authors declare no conflicts of interest.
FUNDING INFORMATION
The study was supported by the National Natural Science Foundation of China (grant numbers: 82302030, 82460325), the Cultivation Project of Shenzhen People's Hospital (grant numbers: SYWGSLCYJ202203), the Sanming Project of Medicine in Shenzhen (grant numbers: SZSM202111006) and the Shenzhen Key Medical Discipline Construction Fund (grant numbers: SZXK011).
ETHICS APPROVAL
The study design was approved by the Institutional Review Boards of the Shenzhen People's Hospital (approved no. LL-KY-2019504).
Open Research
DATA AVAILABILITY STATEMENT
The data presented in the current study are available from the corresponding author upon reasonable request.


