m6A modification of lncRNA PCAT6 promotes bone metastasis in prostate cancer through IGF2BP2-mediated IGF1R mRNA stabilization
Abstract
Background
Bone metastasis is the leading cause of tumor-related death in prostate cancer (PCa) patients. Long noncoding RNAs (lncRNAs) have been well documented to be involved in the progression of multiple cancers. Nevertheless, the role of lncRNAs in PCa bone metastasis remains largely unclear.
Methods
The expression of prostate cancer-associated transcripts was analyzed in published datasets and further verified in clinical samples and cell lines by RT-qPCR and in situ hybridization assays. Colony formation assay, MTT assay, cell cycle analysis, EdU assay, Transwell migration and invasion assays, wound healing assay, and in vivo experiments were carried out to investigate the function of prostate cancer-associated transcript 6 (PCAT6) in bone metastasis and tumor growth of PCa. Bioinformatic analysis, RNA pull-down, and RIP assays were conducted to identify the proteins binding to PCAT6 and the potential targets of PCAT6. The therapeutic potential of targeting PCAT6 by antisense oligonucleotides (ASO) was further explored in vivo.
Results
PCAT6 was upregulated in PCa tissues with bone metastasis and increased PCAT6 expression predicted poor prognosis in PCa patients. Functional experiments found that PCAT6 knockdown significantly inhibited PCa cell invasion, migration, and proliferation in vitro, as well as bone metastasis and tumor growth in vivo. Mechanistically, METTL3-mediated m6A modification contributed to PCAT6 upregulation in an IGF2BP2-dependent manner. Furthermore, PCAT6 upregulated IGF1R expression by enhancing IGF1R mRNA stability through the PCAT6/IGF2BP2/IGF1R RNA-protein three-dimensional complex. Importantly, PCAT6 inhibition by ASO in vivo showed therapeutic potential against bone metastasis in PCa. Finally, the clinical correlation of METTL3, IGF2BP2, IGF1R, and PCAT6 was further demonstrated in PCa tissues and cells.
Conclusions
Our study uncovers a novel molecular mechanism by which the m6A-induced PCAT6/IGF2BP2/IGF1R axis promotes PCa bone metastasis and tumor growth, suggesting that PCAT6 may serve as a promising prognostic marker and therapeutic target against bone-metastatic PCa.
Abbreviations
-
- BM
-
- bone metastasis
-
- FISH
-
- fluorescence in situ hybridization
-
- GSEA
-
- gene set enrichment analysis
-
- H&E
-
- hematoxylin and eosin stain
-
- IHC
-
- immunohistochemistry
-
- ISH
-
- in situ hybridization
-
- m6A
-
- N6-methyladenosine
-
- mut
-
- mutant-type
-
- PCa
-
- prostate cancer
-
- PCAT6
-
- prostate cancer-associated transcript 6
-
- PRAD
-
- prostate adenocarcinoma
-
- RIP
-
- RNA immunoprecipitation
-
- shRNA
-
- small hairpin RNA
-
- TCGA
-
- The Cancer Genome Atlas
-
- Wt
-
- wild-type
1 BACKGROUND
Prostate cancer (PCa) ranks first in terms of incidence and is the second leading cause of cancer-related mortality in men worldwide.1 In clinical practice, metastasis is the foremost cause of death in PCa patients, and bone is the most common distant metastatic organ in PCa.2 Appropriately 90% of patients with advanced PCa develop bone metastasis (BM), leading to a decline in quality of life and poor prognosis beyond 5 years.3 Unfortunately, the treatment options against BM in PCa remain limited, suggesting that understanding the molecular mechanism of how PCa cells metastasize to the bone will contribute to disease control. Although previous studies have revealed the significant role of proteins and non-coding RNAs in PCa BM, the precise molecular mechanisms are still largely unclear.
Long noncoding RNAs (lncRNAs) are a class of transcripts more than 200 nt in length with little or no protein-coding potential, commonly considered transcriptional noise, and their function was unclear for the past two decades. However, with the advancement of biotechnology, many lncRNAs have been identified and shown time- and tissue-specific expression.4, 5 Simultaneously, dysregulation of lncRNAs has been revealed in many pathological stages, such as tumor growth and metastasis in lung, prostate, gastric, colon, and ovarian cancers.6-10 LncRNAs can act as a sponge for miRNAs to inhibit miRNA-mediated degradation of related target genes, remodel chromatin to modulate the activity of transcriptional regulators, bind to RNA-binding proteins (RBPs) to control RNA stabilization; or be translated to proteins.11-14 Accumulating emerging findings suggest that lncRNAs may serve as prognostic factors and diagnostic markers, which provide novel insights into the treatment for human diseases, including cancers. However, to the best of our knowledge, studies on the function of lncRNAs in PCa BM are still lacking.
N6-methyladenosine (m6A) is the most abundant posttranscriptional modification detected in mRNAs and ncRNAs, that controls RNA fate in several steps, such as RNA splicing and transportation from nucleus to cytoplasm, as well as RNA stabilization and translation efficiency.15 In recent years, numerous studies have reported the role of m6A-modified ncRNAs in the progression of human cancers.15-18 For example, m6A-modified circNSUN2 is transported from nucleus to cytoplasm in a YTHDC1-dependent manner to promote liver metastasis in colorectal cancer.15 LncRNA RP11 which is accumulated in the nucleus induced by m6A modification promotes the metastasis of colorectal cancer cells by upregulating ZEB1.19 METTL14 inhibits the progression of colorectal cancer via degradation of lncRNA XIST in an m6A-dependent manner.20 Other investigations also revealed that m6A modification is required for lncRNA's function and regulates the binding of RBPs to lncRNA.21, 22 A recent study found that NEAT1-1 promotes BM in PCa by enhancing the interaction between CYCLINL1 and CDK19 and the Ser2 phosphorylation of RNPII through the m6A sites in NEAT1-1 transcript.23 Nevertheless, the role of m6A-modified lncRNA in PCa BM and the underlying mechanisms remain largely unknown, which need to be further investigated.
In this study, we found a specific lncRNA, prostate cancer-associated transcript 6 (PCAT6), which is located on chromosome 1q32.1. PCAT6 was significantly upregulated in PCa tissues with BM and related to poor survival in PCa patients. Functional experiments indicated that PCAT6 knockdown significantly inhibited PCa cell migration, invasion, and proliferation in vitro, as well as BM and tumor growth in vivo. Mechanistic analysis revealed that METTL3-mediated m6A modification of PCAT6 led to the upregulation of PCAT6 in an IGF2BP2-dependent manner and PCAT6 enhanced the stability of IGF1R mRNA by interacting with IGF2BP2. Clinically, the correlation of the m6A/PCAT6/IGF1R axis with PCa was further verified in PCa tissues and cells. This study suggests that PCAT6 may function as a crucial marker to predict BM and a promising therapeutic target against bone-metastatic PCa.
2 METHODS
2.1 Immunohistochemistry and in situ hybridization assays
Immunohistochemistry (IHC) assay and score calculations were performed following our previous study.24 Antibodies against METTL3 (1:500; #ab195352) and Cytokeratin 8 (CK8; 1:250; #ab53280) from Abcam (Cambridge, UK), IGF2BP2 (1:300; #11601-1-AP) from Proteintech (Wuhan, China), and IGF1R (1:2500; #3027), p-AKT (ser473; 1:100; #4060), Ki67 (1:600; #9449), and p65 (1:1000; #8242) from Cell Signaling Technology (Danvers, MA, USA) were used in the IHC assay to determine their expression in PCa tissues or xenografts tumors. Proliferation index, the percentage of Ki67-positive tumor cells in all tumor cells, was used to calculate staining score of Ki67. ISH staining and scoring were conducted in accordance with a previous study.25 The biotin-labeled PCAT6 probe (sequence: 5′-TCCGCCCCAGTCCAAGCCCAAGGATCCGGTATCGCCTCGACGTCGGGT-3′, Axl-bio, Guangzhou, China) was used to assess PCAT6 expression by ISH staining in paraffin-embedded PCa tissues. The slides were stained with DAB Enhanced Liquid Substrate System (Sigma, Chicago, IL, USA). The staining score (SI) was assigned by two independent pathologists for comparative evaluation of the expression of target lncRNA or proteins. SI of 4 was used to distinguish tissues with high or low expression of target molecules (high expression: SI > 4; low expression: SI≤4).
2.2 Quantitative real-time PCR
The protocol for quantitative real-time PCR (RT-qPCR) was detailly described in a previous study.26 Total RNA was extracted from PCa tissues and cells with TRIzol reagent (Invitrogen, Waltham, MA, USA). The primer pairs are presented in Table S1. The relative fold expression was calculated using the comparative threshold cycle (2−ΔΔCt ) method.27
2.3 Cell proliferation assays
Cell viability was determined by colony formation assay and MTT assay according to a previous study.3, 28 Cell populations at different phases were detected by cell cycle analysis and EdU assay. Detailed information about the cell cycle analysis is described in our previous study.27 EdU assay was performed using EdU Kits (RiboBio, Guangzhou, China) following the manufacturer's instructions.
2.4 RNA stability assay
The RNA stability assay was carried out according to the previous description.16 Briefly, PCa cells were cultured in 6-well plates overnight. Next, 5μg/ml actinomycin D (MedChemExpress) was added to PCa cells to inhibit gene transcription for various times as indicated. Then, RNA was extracted and determined by RT-qPCR. The RNA levels at different times in the indicated group were calculated and normalized to GAPDH.
2.5 Tumor model
All animal experiments were approved by the Institutional Animal Care and Use Committee of Sun Yat-sen University (Approval number: L102012020070J). For the animal model of BM, eight BALB/c-nu mice (male, 4–6 weeks old) in the indicated groups were injected with PC-3 cells (1 × 10⁶) in 100 μl PBS into the left cardiac ventricle and further analyzed and measured by In Vivo Imaging System (IVIS, Caliper Life Sciences), X-ray, hematoxylin and eosin (H&E), and IHC staining as previously described.2 To investigate the treatment effect of ASO targeting PCAT6 in vivo, 24 mice were used to establish a BM animal model. At 1 week post-injection with PC-3 cells, mice were randomly assigned to three groups (n = 8 per group): the ASO-NC group (injection with ASO negative control targeting unknown sequence, 5 nmol in 100 μl PBS for each mouse), the ASO-L group (injection with low-dose ASO targeting PCAT6, 5 nmol in 100 μl PBS for each mouse), and the ASO-H group (injection with high-dose ASO targeting PCAT6, 10 nmol in 100 μl PBS for each mouse). ASOs were injected through the tail vein once every 5 days for a total of four times. The tumorigenesis assay was carried out as described previously.29 Mice were randomly divided into two groups (male, n = 5 per group). The indicated PC-3 cells (1 × 10⁶) were injected subcutaneously into the left or right dorsum. Tumor volume was measured every 4 days and calculated according to the equation (length × width2)/2. At 4 weeks post-injection, all tumors were harvested and weighed.
2.6 Statistical analysis
GraphPad Prism 7.0 and SPSS 19.0 were used for all data analyses. The results are reported as the mean ± standard deviation (SD). n represented the number of mice or clinical tissues used in independent experiments. All experiments were repeated three times unless otherwise specified. Significant differences between the two groups were analyzed by Student's t-test for normally distributed data or Mann-Whitney U test for non-normally distributed data. For comparison of more than two groups, ANOVA test was used to calculate p value. The χ2 test was used to compare the rates (constituent ratios) of two groups or analyze the correlation between two categorical variables. For survival analysis, statistical differences between Kaplan-Meier curves were detected by the log-rank test. The correlation between two study variables was determined by Spearman bivariate correlate analysis. p < 0.05 (two-tailed) was considered statistically significant.
The additional experimental procedures are provided in Supplementary Methods.
3 RESULTS
3.1 PCAT6 is upregulated in PCa tissues with BM and related to poor prognosis
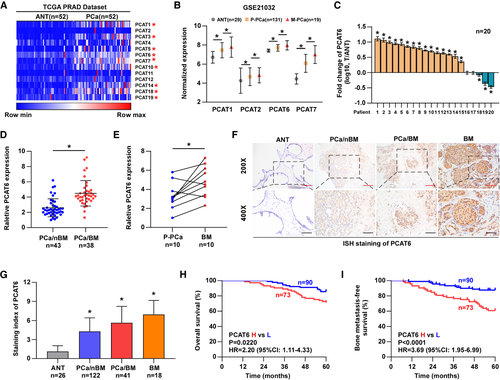
Emerging evidence suggests that lncRNAs play critical roles in the metastasis of human cancers, but the function of lncRNAs in BM of PCa remains largely unknown. We observed that a class of RNA transcripts associated with PCa (prostate cancer-associated transcript, PCAT) have been reported to participate in the pathological process of multiple cancers, such as colorectal, prostate, lung, and liver cancers.2, 30-33 Therefore, we wanted to investigate the biological role of PCATs in PCa BM. First, we analyzed the lncRNA expression profile in The Cancer Genome Atlas (TCGA) dataset and found that several PCATs were significantly increased in PCa tissues compared with paired adjacent normal prostate tissues (ANT, Figure 1A). Further analysis based on a Gene Expression Omnibus (GEO) dataset (GSE21032) revealed that four PCATs (PCAT1/2/6/7) were gradually increased from ANT and primary PCa tissues (P-PCa) to metastatic PCa tissues (M-PCa, Figure 1B). Among these dysregulated PCATs, PCAT1, 6, and 7 overlapped in both datasets, which indicated that they may be more likely to participate in the progression of PCa. The function and molecular mechanism of PCAT1 and 7 have been clarified in PCa in previous studies.2, 31 However, the biological function and clinical significance of PCAT6 in PCa progression, particularly BM, remain unclear. Hence, PCAT6 was selected for further investigation. Then, we evaluated PCAT6 expression levels in our clinical samples. The results from RT-qPCR assays showed that PCAT6 was dramatically upregulated in PCa tissues compared with paired ANT (Figure 1C). The analyses in TCGA dataset also showed a higher expression of PCAT6 in PCa tissues (n = 492) than in normal prostate tissues (n = 52; Figure S1a). Since BM is a critical predictive factor for the prognosis of PCa patients and the leading cause of PCa mortality,24, 34 we further determined whether PCAT6 expression is associated with BM in PCa. PCAT6 expression was detected in 43 cases of PCa without BM (PCa/nBM) and 38 cases of PCa with BM (PCa/BM) by RT-qPCR assay. Our findings demonstrated that the PCAT6 level was markedly increased in PCa/BM compared with PCa/nBM (Figure 1D). Moreover, we collected primary PCa (P-PCa) and matched BM tissues from the same patients, and the results showed a prominent upregulation of PCAT6 in BM compared with P-PCa (Figure 1E). Further results from in situ hybridization (ISH) assay revealed that the increased PCAT6 expression was more prevalent in BM and PCa/BM than in PCa/nBM and ANT (Figure 1F and G). We also found that high PCAT6 expression was positively related to advanced clinicopathological stages and BM status (Table S2). The results from RT-qPCR analysis suggested that PCAT6 level was upregulated in PCa cell lines compared to normal prostate cell line (RWPE-1)(Figure S1b). Kaplan-Meier analyses based on patient information revealed that high PCAT6 expression predicted shorter overall and BM-free survivals (Figure 1H and I). Survival analysis from the TCGA dataset also revealed a positive correlation between high PCAT6 expression and shorter disease-free survival (Figure S1c). The above results indicate that PCAT6 is upregulated in PCa tissues with BM and related to BM and poor prognosis in PCa patients.
3.2 PCAT6 promotes PCa cell migration and invasion in vitro and BM in vivo
To explore the biological function of PCAT6 in PCa, we performed gene set enrichment analysis (GSEA) based on TCGA data, and the results suggested that PCAT6 was related to tumor metastasis (Figure S2a). Thus, we explored the role of PCAT6 in PCa BM. First, PCAT6 expression was knocked down via lentiviral transfection of two shRNAs in PC-3 and C4-2B cells, which express higher PCAT6 levels among PCa cell lines, and PCAT6 was overexpressed using exogenous plasmid in 22RV1 cells with lower PCAT6 levels (Figure S2b). To evaluate the role of PCAT6 in the metastatic behavior of PCa cells, wound healing and transwell migration and invasion assays were performed. Our data indicated that PCAT6-knockdown cells migrated much more slowly, while PCAT6-overexpressing cells migrated much more quickly than did corresponding control cells (Figure 2A and Figure S2c). Similarly, PCAT6 silencing dramatically suppressed, while PCAT6 overexpression promoted PCa cell migration and invasion, as determined by transwell assays (Figure 2B and Figure S2d). In order to exclude the effect of cell proliferation on the results of transwell assays, we used DiD to label PC-3 cells and performed migration assay. DID is a dye that is distributed equally to each cell during cell division. We found that the migrated cells in the PCAT6-knockdown or control group had the similar intensity of DiD staining within 24 h (Figure S2e), which indicated that there was no significant difference in cell proliferation between the two groups within 24 h. These data suggest that PCAT6 is a critical regulator of invasion and migration in PCa cells in vitro.
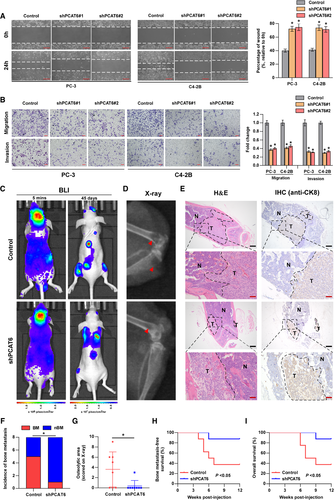
To further investigate the effect of PCAT6 on BM in vivo, luciferase-labeled PCAT6-knockdown or control PC-3 cells were injected into the left ventricle of BALB/c nude mice to establish a BM animal model. BM status was monitored by the IVIS. The successful injection into the left ventricle was verified by the whole-body distribution of bioluminescent signals at 5 min post-injection (Figure 2C). Figure 2C shows a representative image of bioluminescent imaging indicative of BM lesions in mice from the two groups, which were further confirmed by X-ray (Figure 2D), H&E, and Cytokeratin 8 (CK8, one marker of epithelial cell) staining (Figure 2E). Our data showed a significant decrease in terms of the incidence of BM in the PCAT6-knockdown group relative to the control group (Figure 2F). Further X-ray analysis indicated that PCAT6 knockdown markedly inhibited osteolytic lesions of BM (Figure 2G). Survival analysis suggested that high expression of PCAT6 predicted shorter BM-free and overall survival (Figure 2H and I). Additionally, PCAT6 expression was assessed by ISH staining in mice BM tissues. Figure S2f shows decreased PCAT6 expression in the PCAT6-knockdown group. Overall, PCAT6 promotes BM of PCa in vivo.
3.3 PCAT6 enhances PCa cell proliferation in vitro and tumor growth in vivo
The above GSEA also indicated the relationship between PCAT6 and tumor growth (Figure S3a). Then, the effect of PCAT6 knockdown on PCa cell proliferation was investigated using MTT and colony formation assays. The results from MTT and colony formation assays indicated that silencing PCAT6 dramatically inhibited the viability and colony formation ability of PC-3 and C4-2B cells, whereas PCAT6 overexpression had an opposite effect in 22RV1 cells (Figure 3A and Figure S3b and c). Furthermore, we investigated the role of PCAT6 in the cell cycle by flow cytometry and EdU assays. We found that PCAT6 silencing significantly decreased the cell population in S phase, whereas it increased the cell population in G0/G1 phase (Figure 3B and C). Similarly, EdU assays showed that knockdown of PCAT6 prominently reduced the percentage of EdU-positive cells which are in S phase (Figure 3D and E). Additionally, for cell cycle analysis and EdU assay, PCAT6 overexpression had an inverse effect in 22RV1 cells (Figure S3d and e). Collectively, these results indicate that PCAT6 promotes PCa cell proliferation by regulating the transition of G0/G1 to S phase.
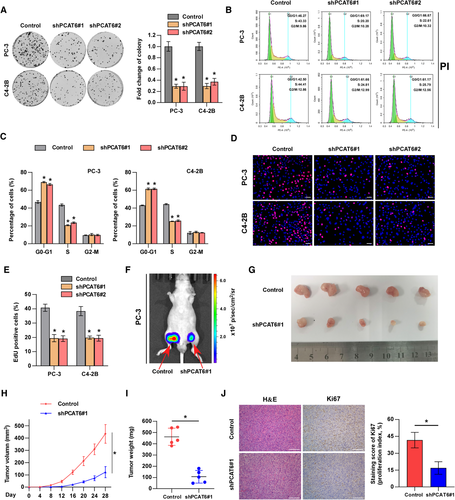
To further assess the effect of PCAT6 on PCa tumor growth in vivo, we subcutaneously injected PCAT6-knockdown or control PC-3 cells into BALB/c nude mice and measured tumor activity. Notably, tumor growth, size, and weight were significantly decreased in the PCAT6-knockdown group compared with the control group (Figure 3F-I). Moreover, lower expression of Ki67 was observed in the PCAT6-knockdown group than in the control group (Figure 3J). Therefore, these findings suggest that PCAT6 promotes tumor growth of PCa cells in vivo.
3.4 PCAT6 interacts with IGF2BP2 to play oncogenic roles in PCa
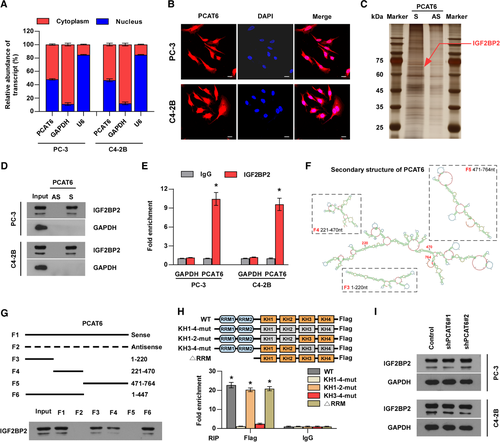
The localization of a lncRNA in the cell is closely related to its molecular mechanism.35 Subcellular fractionation and RNA-FISH assays revealed that PCAT6 was distributed evenly in the nucleus and cytoplasm (Figure 4A and B), suggesting that PCAT6 can exert its function by various possible mechanisms. Recent reports have demonstrated that lncRNAs may play an oncogenic role in human cancer by interacting with some proteins, particularly RBPs.35, 36 Hence, we wondered whether PCAT6 promotes PCa BM by interacting with specific proteins. To identify the PCAT6-binding proteins, we performed RNA pull-down assays using in vitro-transcribed biotinylated PCAT6 and the elution solution was analyzed by mass spectrometry. Meanwhile, to predict the potential proteins interacting with PCAT6, we also analyzed the public databases (StarBase, RPIseq, and catRAPID) and found that seven proteins may interact with PCAT6 (Figure S4a). Notably, only IGF2BP2 (67 kDa) was identified out by both mass spectrometry and public databases and one overtly differential band between 60 and 75 kDa appeared after silver staining (Figure 4C and Figure S4b). Therefore, IGF2BP2 was selected for further investigation. We confirmed the special interaction between PCAT6 and IGF2BP2 using western blotting (Figure 4D). RIP experiments also suggested that PCAT6 was enriched in IGF2BP2 precipitates (Figure 4E), verifying the above results. To investigate the binding site in PCAT6, according to the secondary structure of PCAT6 predicted by RNAfold, we designed three deletion mutants that mostly preserved the RNA hairpin structures (Figure 4F). The results demonstrated that F3 (1-220 nt) and F4 (221-470 nt) of the PCAT6 transcript bound to IGF2BP2, but the binding efficacy was slightly less than full-length PCAT6 (Figure 4G). Therefore, we designed F6 (1-470 nt) and found that F6 bound to IGF2BP2 as efficiently as full-length PCAT6 (Figure 4G), which suggested that F6 (1-470 nt) was required for the interaction between PCAT6 and IGF2BP2. Next, we studied which domain of IGF2BP2 mediates the interaction with PCAT6 and constructed IGF2BP2 mutants with truncation of the two RRM domains, or with mutations of GxxG to GEEG in the KH domains as reported (Figure 4H).37, 38 Further RIP assays revealed that the KH3-4 di-domain of IGF2BP2 specifically bound to PCAT6 (Figure 4H), which indicated that the KH3-4 domain was indispensable for the interaction between PCAT6 and IGF2BP2. Moreover, PCAT6 knockdown showed little effect on IGF2BP2 protein levels in PCa cells (Figure 4I), indicating that the interaction between PCAT6 and IGF2BP2 had no effect on the IGF2BP2 protein itself and IGF2BP2 was not the downstream target of PCAT6.
To further explore the role of IGF2BP2 in PCAT6-induced BM and proliferation, we overexpressed IGF2BP2 in PCAT6-knockdown cells (Figure S4c). Notably, IGF2BP2 overexpression partially reversed PCAT6 knockdown-mediated suppression of proliferation and metastasis in PCa cells in vitro (Figure S4d-f). These data indicate that IGF2BP2 mediates PCAT6-induced BM and proliferation of PCa cells.
3.5 PCAT6/IGF2BP2/IGF1R complex stabilizes IGF1R mRNA
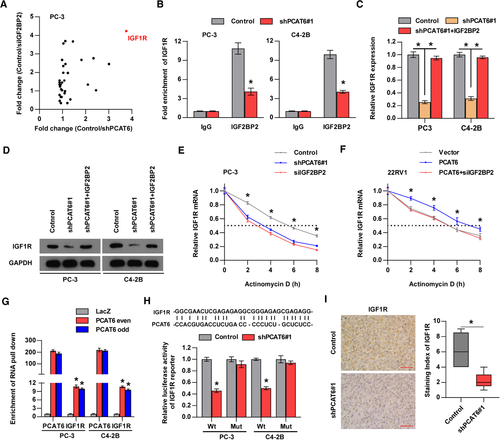
IGF2BP2 has been reported to modulate the stability of RNAs,15-17, 39 so we wondered whether PCAT6 guides IGF2BP2 to stabilize target mRNAs. By analyzing a CLIP-Seq dataset reported in a previous study,40 we found that some mRNAs among the top 100 IGF2BP2-binding mRNAs, such as C-MYC, AKT3, IGF1R, and CCND2, were closely related to tumor progression (Table S3). Therefore, we performed RT-qPCR assays to identify target mRNAs that were regulated by both PCAT6 and IGF2BP2 in these tumor-related mRNAs and found that IGF1R was the most downregulated mRNA both in PCAT6- and IGF2BP2-knockdown PC-3 cells compared with control PC-3 cells (Figure 5A and Figure S5a). Interestingly, previous studies demonstrated that IGF1R regulated cancer cell metastasis to bone and tumor growth.41-43 Therefore, we selected IGF1R for further investigation. To explore whether endogenous IGF2BP2 can bind to IGF1R mRNA in PCa cells, RIP assays were carried out, and the results showed the significant enrichment of IGF1R mRNA in IGF2BP2 protein (Figure 5B). Moreover, PCAT6 knockdown dramatically decreased the interaction of IGF2BP2 with IGF1R (Figure 5B), indicating that the interaction between IGF2BP2 and IGF1R was regulated by PCAT6. Furthermore, the results from RT-qPCR and western blotting analysis showed that IGF2BP2 overexpression eliminated the downregulation of IGF1R expression by PCAT6 knockdown (Figure 5C and D). We then wondered whether the PCAT6/IGF2BP2 complex regulates IGF1R expression by stabilizing IGF1R mRNA. To test this hypothesis, PCa cells were treated with actinomycin D to measure the degradation of IGF1R mRNA. As shown in Figure 5E and Figure S5b, PCAT6 or IGF2BP2 silencing significantly reduced IGF1R mRNA stability, which was consistent with our hypothesis. Moreover, our data indicated that PCAT6 overexpression increased IGF1R mRNA stability, whereas IGF2BP2 knockdown abolished the enhancing effect on IGF1R mRNA stability induced by PCAT6 overexpression (Figure 5F). To further determine whether PCAT6 directly binds to IGF1R mRNA, we performed an RNA pull-down assay. Our data revealed that endogenous IGF1R mRNA coprecipitated with the PCAT6 transcript in PCa cells (Figure 5G), suggesting an interaction between PCAT6 and IGF1R mRNA. In addition, the base-pairing analysis showed a putative binding site between PCAT6 and IGF1R (Figure 5H), and we designed the mutant binding site (Figure S5c). Next, luciferase reporter assays were used to verify the binding site and we found that PCAT6 silencing decreased the luciferase activity of the IGF1R-Wt reporter; whereas the luciferase activity of the IGF1R-Mut reporter remained unchanged with PCAT6 knockdown (Figure 5H). To investigate whether IGF2BP2 affects the binding between PCAT6 and IGF1R mRNA, RNA pulldown assay was performed and the results indicated that IGF2BP2 knockdown had no effect on the interaction between PCAT6 and IGF1R mRNA (Figure S5d). Finally, IHC analysis in mouse subcutaneous tumors demonstrated that IGF1R expression was decreased in the PCAT6-knockdown group compared with the control group, supporting the positive regulation between PCAT6 and IGF1R (Figure 5I). These data suggest that PCAT6 increases IGF1R mRNA stability by forming the PCAT6/IGF2BP2/IGF1R complex, which contributes to IGF1R upregulation.
3.6 PCAT6 promotes BM through IGF1R signaling in PCa
To further investigate the biological function of IGF1R in PCAT6-induced BM and tumor growth, we overexpressed IGF1R in PCAT6-silenced PC-3 and C4-2B cells (Figure S6a). The results from colony formation and EdU assays demonstrated that IGF1R overexpression reversed the inhibitory effect of PCAT6 knockdown on PCa cell proliferation (Figure S6b and c). Moreover, transwell migration and invasion assays indicated that the upregulation of IGF1R abolished the migration and invasion suppression induced by silencing PCAT6 (Figure S6d and e). Overall, IGF1R is critical for the oncogenic role of PCAT6 in PCa in vitro.
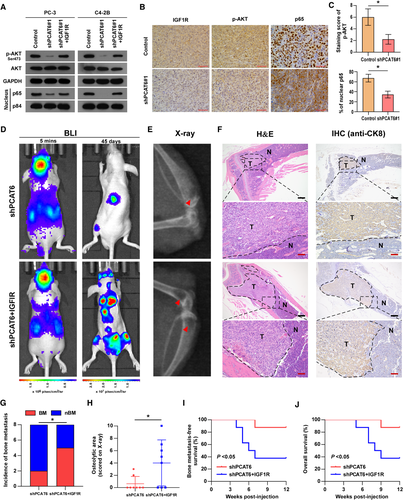
IGF/IGF1R signaling has been reported to be involved in BM of multiple human cancers,41, 43-48 and the PI3K/AKT and NF-κB pathways are two downstream signaling pathways in IGF/IGF1R axis-induced BM in PCa and breast cancer.46 Hence, we performed experiments to determine the role of IGF1R in PCAT6-induced BM in vivo. First, the effect of PCAT6 on PI3K/AKT and NF-κB pathways was investigated. Western blotting revealed that PCAT6 knockdown significantly suppressed the activity of the PI3K/AKT and NF-κB pathways and IGF1R overexpression attenuated the suppression induced by PCAT6 knockdown in PCa cells (Figure 6A), which indicated that IGF1R mediated the effect of PCAT6 on PI3K/AKT and NF-κB pathways. This regulatory relationship was also supported by an IHC assay performed in mouse subcutaneous tumors (Figure 6B and C). Furthermore, as shown in Figure 6D-J, overexpression of IGF1R reversed the suppression of BM by PCAT6 knockdown in vivo, as indicated by the increased incidence and osteolytic lesions, as well as decreased BM-free and overall survival. Moreover, mice BM tissues were assessed by IHC or ISH assays. Figure S6f shows similar PCAT6 and IGF2BP2 expression in two groups and increased IGF1R and p-AKT expression in the group with PCAT6 knockdown and IGF1R overexpression. Taken together, these findings indicate that IGF1R signaling is indispensable for PCAT6-induced BM in PCa.
3.7 m6A modification contributes to the upregulation of PCAT6 in PCa
Recent advancements indicate that the epigenetic mechanisms are frequently involved in the dysregulation of lncRNAs, therefore, we wondered whether epigenetic regulation is responsible for PCAT6 upregulation in PCa. We first treated PCa cells with 5-aza-dC, a DNA methyltransferase inhibitor, and found that PCAT6 expression remained unaltered (Figure S7a), indicating that DNA methylation did not participate in PCAT6 regulation. The effect of histone acetylation on PCAT6 expression was determined by treatment with broad-spectrum HDAC inhibitors (SAHA and NaB) in PC-3 cells (Figure S7b). The results revealed that histone acetylation was not implicated in the regulation of PCAT6 in PCa cells.
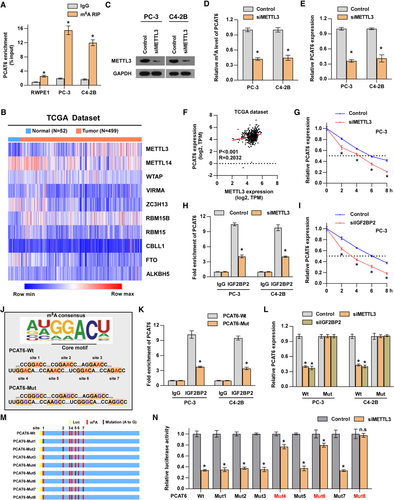
Emerging evidence suggests that m6A is the most frequent RNA modification and modulates RNA fate throughout its life cycle, such as processing, translocation, degradation, and translation.49-52 We then investigated the role of m6A modification in PCAT6 upregulation. The results from an online RNA modification website (RMBase, http://rna.sysu.edu.cn/rmbase/) suggested that there are seven m6A sites in the PCAT6 transcript supported by published m6A- or MeRIP-Seq data (Figure S7c). Moreover, m6A RIP assay showed that m6A level was increased in PC-3 and C4-2B cells compared with normal prostate cells, RWPE-1 (Figure 7A), indicating that m6A may be involved in PCAT6 upregulation. To further identify the factor that mediated m6A modification in PCAT6, the expression pattern of m6A-related genes in PCa was analyzed in the TCGA dataset and the results showed that several genes were dysregulated in PCa (Figure 7B). Then, we verified that METTL3 was significantly increased in our PCa tissues, while other genes showed no significant differences (Figure S7d). METTL3, acting as the key component of the N6-methyltransferase complex, was also reported to be highly expressed in other human cancers,16 which prompted us to investigate its role in regulating m6A modification of PCAT6. We treated PCa cells with siRNA targeting METTL3 (Figure 7C) and found that METTL3 silencing dramatically decreased m6A and expression level of PCAT6 in PCa cells (Figure 7D and E). Intriguingly, there was a positive correlation between METTL3 and PCAT6 levels in PCa tissues from the TCGA dataset, supporting the positive regulatory mechanism of METTL3 on PCAT6 (Figure 7F); concurrently, ALKBH5 (the demethylase of m6A) overexpression significantly reduced PCAT6 expression in PCa cells (Figure S7e). The above findings indicated that m6A modification was involved in the upregulation of PCAT6. To further explore the specific mechanism responsible for the m6A-induced upregulation of PCAT6 in PCa cells, related assays were performed. The nucleus-cytoplasm fractionation analysis revealed that METTL3 knockdown did not affect the localization of PCAT6 in PCa cells (Figure S7f). Next, we assessed the effect of METTL3 knockdown on PCAT6 stability and found a significantly decreased half-life of PCAT6 in PCa cells treated with METTL3 siRNA (Figure 7G), indicating that METTL3 regulated PCAT6 expression by modulating PCAT6 stability. Meanwhile, to investigate whether METTL3 directly regulates the expression of PCAT6 gene, we performed some assays. The results shown in Figure S7a and b indicated that METTL3 cannot regulate the expression of PCAT6 gene via DNA methylation and histone acetylation. The luciferase reporter assay showed that METTL3 knockdown did not change the luciferase activity of PCAT6 promoter (Figure S7g), which suggested that METTL3 did not participate in the transcriptional regulation of PCAT6 gene. These data suggest that METTL3 is not involved in the regulation of PCAT6 gene. Since m6A-induced regulation of PCAT6 requires an m6A reader to recognize methylated PCAT6, we then determined which protein may act as an m6A reader to regulate PCAT6 stability. RIP analysis indicated that PCAT6 was significantly enriched in IGF2BP2 protein instead of other m6A readers (Figure 7H and Figure S7h) and METTL3 knockdown dramatically decreased PCAT6 enrichment in IGF2BP2 protein (Figure 7H), indicating that METTL3-induced m6A modification regulated the recognition and binding of methylated PCAT6 by IGF2BP2. Furthermore, the expression and half-life of PCAT6 were strongly reduced upon IGF2BP2 inhibition in PCa cells (Figure 7I and Figure S7i), which was similar to the results of METTL3 inhibition. These data suggested that IGF2BP2 acted as an m6A reader for PCAT6. In addition, to investigate whether putative m6A sites predicted by RMBase are responsible for the interaction between PCAT6 and IGF2BP2, we mutated all putative m6A sites, as shown in Figure 7J. Subsequent RIP assays showed that the direct binding between PCAT6 and IGF2BP2 was impaired by mutation of the m6A sites (Figure 7K). Moreover, METTL3- or IGF2BP2-mediated regulation of PCAT6 was abolished after mutation of the m6A sites (Figure 7L). To investigate which m6A site is responsible for m6A-mediated PCAT6 stabilization, eight PCAT6 mutants were designed and luciferase reporter assay was performed (Figure 7M). Our results demonstrated that site 4 (‘UUGGACA’) and site 6 (‘UCGGACA’) were involved in regulating PCAT6 stability (Figure 7N). Furthermore, to investigate whether m6A modification affects PCAT6 secondary structure, we used RNAfold website to predict the secondary structure of PCAT6. The prediction results showed that m6A sites 4 and 6 in the double strand may block the double strand RNA interaction22, 23 (Figure S7j), indicating that the sites may exert specific function dependent on different secondary structure. Meanwhile, we found that m6A modification had no effect on the interaction between PCAT6 and IGF1R mRNA (Figure S7k), suggesting that this interaction did not rely on m6A modification. Additionally, our data also showed that METTL3 overexpression increased IGF1R mRNA expression (Figure S7l). Then, we knocked down PCAT6 in METTL3-overexpressing cells and found that PCAT6 knockdown completely reversed IGF1R mRNA upregulation induced by METTL3 overexpression (Figure S7l), which indicated that METTL3 regulated IGF1R expression in a PCAT6-dependent manner. Moreover, previous studies revealed that the direct regulation of METTL3 on target mRNA requires the interaction between METTL3 and target mRNA.53 To investigate whether METTL3 also has direct regulation on downstream target IGF1R, we performed RIP assay. The results showed that IGF1R mRNA was not significantly enriched in METTL3 immunoprecipitate (Figure S7m), which suggested that METTL3 may have no direct regulation on IGF1R. Overall, the upregulation of METTL3 promotes m6A modification in PCAT6 and increases PCAT6 expression in an IGF2BP2-dependent manner.
3.8 Targeting PCAT6 with ASO showed therapeutic potential against PCa BM in vivo
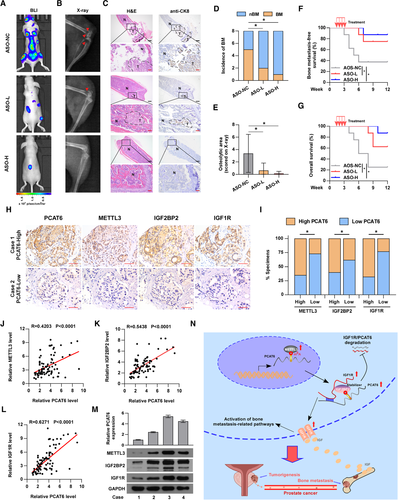
Recently, ASO drugs have been developed for disease control and preliminarily validated for their capability to target mRNAs and ncRNAs in vitro and vivo.54-56 To investigate the therapeutic effect of PCAT6 interference by ASO, an ASO targeting PCAT6 was designed for further investigation. First, we found a dose-dependent inhibition of PCAT6 by ASO in PCa cells in vitro (Figure S8a). To investigate whether ASO targeting PCAT6 affects m6A level of PCAT6, m6A RIP assay was performed and the results indicated that ASO targeting PCAT6 had no effect on m6A level of PCAT6 (Figure S8b). Subsequently, a BM model was used to determine the therapeutic efficacy of the ASO targeting PCAT6 in vivo. After 1 week of left ventricle injection with wild-type PC-3 cells, mice were randomly divided into three groups: ASO-NC (negative control), ASO-L (5 nmol ASO), and ASO-H (10 nmol ASO), and received the corresponding treatment (details shown in the Methods section) through tail vein injection once every 5 days for a total of four injections. As presented in Figure 8A-E, PCAT6 inhibition by ASO differentially suppressed BM in vivo, as supported by the decreased incidence of BM and the reduced osteolytic area. Moreover, ASO targeting PCAT6 significantly prolonged overall and BM-free survivals (Figure 8F and G). These data suggest that targeting PCAT6 with ASO can be used as a potentially effective therapeutic approach against PCa BM.
3.9 Clinical relevance of the m6A/PCAT6/IGF1R axis in PCa
To further investigate the clinical relevance of the m6A/PCAT6/IGF1R axis in PCa, we determined the expression levels of PCAT6, METTL3, IGF2BP2, and IGF1R in our PCa tissues. The ISH assay was conducted to detect PCAT6 expression and the IHC assay was performed to show METTL3, IGF2BP2, and IGF1R expression in our PCa tissues (Figure 8H). The results from IHC and ISH assays demonstrated that PCAT6 expression was positively correlated with METTL3, IGF2BP2, and IGF1R expression (Figure 8I). RT-qPCR analysis also showed a positive correlation between PCAT6 expression and METTL3, IGF2BP2, or IGF1R expression (Figure 8J-L). Interestingly, western blotting confirmed the positive correlation and regulation between PCAT6 and METTL3, IGF2BP2 or IGF1R in our primary PCa cells reported in a previous study (Figure 8M).27 Overall, METTL3-mediated m6A modification contributes to the upregulation of PCAT6 in an IGF2BP2-dependent manner and the PCAT6/IGF2BP2/IGF1R complex further stabilizes IGF1R mRNA to activate downstream pathways, which promotes BM and tumor growth in PCa (Figure 8N).
4 DISCUSSION
BM frequently contributes to poor prognosis and a decline in quality of life in patients with PCa. Currently, the limited treatment options for BM can only reduce the symptoms to provide comfort for patients and do not prolong the patient's overall survival time.2 Therefore, revealing the precise mechanisms underlying BM and developing novel potential therapeutic targets are urgently needed for the prevention and treatment of BM. Emerging evidence has demonstrated that lncRNAs are involved in tumor development.57-62 Nevertheless, the biological role and mechanism of lncRNAs in PCa BM remain largely undiscovered. As far as we know, PCAT6 was first systematically assessed in PCa BM. In the current study, we found that PCAT6 was increased in PCa with BM and predicted poor prognosis. Furthermore, PCAT6 knockdown inhibited BM and tumor growth of PCa cells. Mechanistically, m6A modification of PCAT6 stabilized IGF1R mRNA by forming the PCAT6/IGF2BP2/IGF1R complex, further activating the IGF/IGF1R signaling axis.
m6A is a posttranscriptional modification in mRNA and ncRNA,63-65 including lncRNA,19, 66 and participates in the modulation of RNA fate at various levels.67, 68 Emerging studies indicated that m6A modification of RNAs plays crucial roles in cancer progression.69 Wu et al. found that m6A-induced nuclear accumulation of lncRNA RP11 enhanced colorectal cancer liver metastasis by interacting with hnRNPA2B1 to increase mRNA degradation of SIAH1 and FBXO45.19 The study by Wen et al. reported that lncRNA NEAT1 promoted PCa cells metastasis to bone through m6A modification.23 Similarly, this study also revealed the function of m6A-modified lncRNA in PCa BM. Our data indicated that m6A modification resulted in the upregulation of PCAT6. Bioinformatic analysis based on published m6A- or MeRIP-Seq data and m6A-RIP assays suggested m6A modification in PCAT6. Further findings showed that METTL3 acted as an m6A writer for PCAT6 and that m6A-methylated PCAT6 was recognized by IGF2BP2, a proven m6A reader, which has been reported to regulate RNA stability in an m6A-dependent manner.70 Hu et al. found that IGF2BP2 recognized m6A-modified DANCR and increased the stability of the DANCR transcript, which promoted proliferation and cancer stemness-like properties in pancreatic cancer.17 In colorectal carcinoma, m6A-methylated SOX2 mRNA was recognized by IGF2BP2, which suppressed RNA degradation of SOX2.16 This study showed that IGF2BP2 or METTL3 knockdown significantly decreased the half-life of PCAT6 in an m6A-dependent manner, consistent with previous findings. In addition to the effect of m6A modification on lncRNA fate, m6A modification also regulates the function of lncRNA and RNA-protein interaction.52 LncRNA XIST, regulating gene silencing on the X chromosome, was modified with more than 78 m6A residues.21 The modified XIST was recognized and bound by YTHDC1, and the interaction led to XIST-mediated transcriptional silencing.21 LncRNA NEAT1, methylated with 4 m6A residues, interacted with CYCLINL1 through m6A site and promoted the connection of CYCLINL1 and CDK19.23 In the meantime, NEAT1 selectively bound to the promoter of RUNX2 and recruited CYCLINL1/CDK19 complex on the promoter of RUNX2 in an m6A-dependent manner, further promoting PCa BM.23 Interestingly, one recent investigation found that m6A regulated the interaction between HNRNPC and polyU tracts through unwinding double-strand RNA, which was called RNA-structural switches.22 In our study, decreased m6A level or mutation of m6A sites reduced the interaction between IGF2BP2 and PCAT6. However, whether the RNA-protein interaction is dependent on RNA-structural switches remains unclear. The results predicted by the RNAfold website suggested that m6A modification may affect the secondary structure of PCAT6. Therefore, whether m6A modification affect the secondary structure of PCAT6 and the structure change is indispensable for PCAT6-IGF2BP2 interaction should be investigated by further in-depth RNA structure analysis.
LncRNAs exert biological roles through various mechanisms related to DNA, RNA, and protein.4 The family of prostate cancer-associated transcript has been reported to play crucial roles in human cancer progression.2, 31, 71-76 Emerging evidence has revealed the function of PCAT1, 3, 5, 7, 14, and 19 in PCa.2, 31, 72-74, 77 Through analyzing public databases, we found that PCAT1, 6, and 7 were dysregulated in multiple databases, indicating that they were more likely to regulate BM of PCa. However, our previous study reported that PCAT7 promoted PCa BM via activation of TGF-β pathway.2 Shang et al found that PCAT1 enhanced PCa progression through interacting with FKBP51 to activate AKT and NF-κB pathways.31 Hence, the function of PCAT6 in PCa BM was explored in this study. Nonetheless, further study should focus on the potential role of other members of PCAT family in PCa BM. Previous studies showed that PCAT6 mainly acted as an endogenous competitive RNA by sponging miRNAs to enhance tumor progression.30, 71, 78 PCAT6 participated in cholangiocarcinoma development by endogenously competing with miR-330-5p.78 PCAT6 induced colorectal cancer resistance to 5-fluorouracil-based chemotherapy by sponging miR-204 and activating the HMGA2 pathway.30 Nevertheless, PCAT6 has also been reported to bind to the proteins. Shi et al. found that PCAT6 could directly interact with EZH2 and repress LATS2 transcription in non-small-cell lung cancer.33 In this study, our results indicated that PCAT6 directly interacted with IGF2BP2. Meanwhile, our findings also revealed the direct interaction between the PCAT6 transcript and IGF1R mRNA. Therefore, PCAT6 could regulate IGF1R mRNA stability through the formation of the PCAT6/IGF2BP2/IGF1R complex. Additionally, the silver staining showed that there were also other proteins with 35, 45, and 60 kDa, which may interact with PCAT6 and mediate PCAT6 function. Further investigation should address the role of these proteins in PCAT6 function. Collectively, these results identify a new mechanism by which PCAT6 upregulates the stability of IGF1R mRNA through interacting with IGF2BP2, revealing an important role of lncRNAs in RNA metabolism.
Cancer cell metastasis to bone is a complicated multiple-stage process and increased invasiveness is one crucial initial stage in tumor metastasis. In our study, PCAT6 promoted PCa cell invasion and migration by upregulating IGF1R expression. IGF1R has been revealed to regulate cancer cell invasion and migration in multiple human cancers.42, 43, 79-82 Sekharam et al. reported that IGF1R promoted invasion in colon cancer cells by activating the Akt/Bcl-x(L) pathway.42 Activation of the IGF1R/STAT3 signaling axis contributes to enhanced invasion and migration in ovarian cancer.79 Additionally, the colonization, survival, and proliferation of cancer cells in the bone are also critical for BM.46 IGF/IGF1R signaling is implicated in cancer cell colonization, survival, and proliferation in bone for multiple cancers, including neuroblastoma, PCa, and breast cancer.41-43, 47 The levels of IGF-I and -II in bone were higher than those in other organs of the human body,46 so PCa cells with high expression of IGF1R tended to metastasize to bone and developed metastatic bone tumors. PI3K/AKT and NF-κB signaling are commonly accepted to be two effector pathways that are responsible for IGF/IGF1R signaling-mediated BM in PCa.83 This study revealed that PI3K/AKT and NF-κB signaling were inhibited in PCAT6-knockdown PCa cells and mouse subcutaneous tumors, similar to previous findings. Overall, IGF/IGF1R signaling is critical in PCAT6-induced BM of PCa, which suggests that anti-IGF1R antibody47 or antisense RNA43 may be a potentially effective therapeutic strategy for PCa patients with increased PCAT6 expression.
Recently, targeting ncRNAs has become a promising therapeutic strategy in the control of diseases, including cancers. Small molecules targeting the secondary structure of oncogenic ncRNA can selectively lead to apoptosis of cancer cells,84 and small molecules directly interfering with RNA folding that is related to the disease can act as therapeutic agents to target lncRNA in vivo.85 Additionally, ASO drugs are receiving increased attention due to their ability to target RNAs. Katsushima et al. reported that ASO targeting lncRNA TUG1 accompanied by a drug delivery system suppressed the tumorigenesis of glioma in vivo.55 AZD9150 (ASO targeting STAT3) was demonstrated to be effective for treating patients with lymphoma in a phase 1b trial.56 In this study, we found that PCAT6 inhibition by ASO suppressed BM in PCa, which indicated that developing small molecules targeting PCAT6 may serve as a potential therapeutic strategy against BM in PCa.
5 CONCLUSIONS
In summary, this study reveals that m6A-modified PCAT6 interacts with IGF2BP2 to stabilize IGF1R mRNA, which promotes PCa BM and tumor growth. This study indicates that PCAT6 may serve as a promising prognostic marker and therapeutic target against bone-metastatic PCa.
ACKNOWLEDGMENTS
This study was supported by grants from the National Natural Science Foundation of China (Nos. 81872176, 81773106, 91740118, and 81902735), Natural Science Foundation of Guangdong Province (No. 2018B030311060), Basic and Applied Basic Research Foundation of Guangdong province (No. 2019A1515010342), and the Fundamental Research Funds for the Central Universities (No. 19ykpy56).
CONFLICT OF INTEREST
The authors declare that there is no conflict of interest.
ETHICS APPROVAL AND CONSENT TO PARTICIPATE
The study was approved by the Institutional Review Board of The First Affiliated Hospital of Sun Yat-sen University. All animal experiments were approved by the Institutional Animal Care and Use Committee of Sun Yat-sen University Cancer Center.
AUTHORS' CONTRIBUTIONS
X.P., Y.D., C.L., and D.R. developed ideas and drafted the manuscript. C.L., C.Y., K.L., Y.L., and Z.W. conducted the experiments and contributed to the analysis of data. Q.Y. contributed to the analysis of data. H.D. contributed to the analysis of data and revised the manuscript. All authors contributed to revising the manuscript and approved the final version for publication.
Open Research
DATA AVAILABILITY STATEMENT
The datasets generated and/or analyzed during the current study are available from the corresponding author on reasonable request.


