Extracellular vesicle expansion of PMIS-miR-210 expression inhibits colorectal tumour growth via apoptosis and an XIST/NME1 regulatory mechanism
Abstract
Background
Colorectal cancer (CRC) has a high mortality rate, and therapeutic approaches to treat these cancers are varied and depend on the metabolic state of the tumour. Profiles of CRC tumours have identified several biomarkers, including microRNAs. microRNA-210 (miR-210) levels are directly correlated with CRC survival. miR-210 expression is higher in metastatic colon cancer cells versus non-metastatic and normal colon epithelium. Therefore, efficient methods to inhibit miR-210 expression in CRC may provide new advances in treatments.
Methods
Expression of miRs was determined in several metastatic and non-metastatic cell lines. miR-210 expression was inhibited using PMIS-miR-210 in transduced cells, which were transplanted into xenograft mice. In separate experiments, CRC tumours were allowed to grow in xenograft mice and treated with therapeutic injections of PMIS-miR-210. Molecular and biochemical experiments identified several new pathways targeted by miR-210 inhibition.
Results
miR-210 inhibition can significantly reduce tumour growth of implanted colon cancer cells in xenograft mouse models. The direct administration of PMIS-miR-210 to existing tumours can inhibit tumour growth in both NSG and Foxn1nu/j mouse models and is more efficacious than capecitabine treatments. Tumour cells further transfer the PMIS-miR-210 inhibitor to neighbouring cells by extracellular vesicles to inhibit miR-210 throughout the tumour. miR-210 inhibition activates the cleaved caspase 3 apoptotic pathway to reduce tumour formation. We demonstrate that the long non-coding transcript XIST is regulated by miR-210 correlating with decreased XIST expression in CRC tumours. XIST acts as a competing endogenous RNA for miR-210, which reduces XIST levels and miR-210 inhibition increases XIST transcripts in the nucleus and cytoplasm. The increased expression of NME1 is associated with H3K4me3 and H3K27ac modifications in the NME1 proximal promoter by XIST.
Conclusion
Direct application of the PMIS-miR-210 inhibitor to growing tumours may be an effective colorectal cancer therapeutic.
1 INTRODUCTION
Colorectal cancer (CRC) is the third most prevalent type of cancer worldwide and has one of the highest mortality rates of any cancer, with 1.3 million new cases of CRC diagnosed worldwide every year and 700 000 deaths per year.1 Tumour progression and metastasis of CRC are complex multifactorial processes that are not fully understood. Despite advances in personalized medicine, chemotherapy and immune therapies, CRC patients still have reoccurrences at a significant rate and the mortality rate remains significant.2, 3
microRNAs (miRs) are small non-coding RNA molecules that regulate expression primarily by binding messenger RNA and inhibiting translation, often, but not exclusively at the 3′UTR. miRs have also been shown to bind to the 5′ enhancer/promoters of genes.4-6 miRs have been implicated in many developmental and biological processes and have been shown to be responsible for tumour progression in several tumour types.7-9 Many methods to inhibit miRs have been described, including antisense oligos, antagomirs and LNAs (locked nucleic acids) technologies.10-14 Oligonucleotides can be modified to increase their stability in cells, but must be continually applied to dividing cells. Oligonucleotides such as antagomirs and LNA must be delivered to cells using toxic and expensive delivery systems.
The plasmid-based microRNA inhibitor system (PMIS) is an miR inhibition system that comprises a 122nt miR binding structure designed to interact with RNA-induced silencing complex (RISC) factors to load the mature miR into a stable inhibitor complex with high efficiency, specificity and stability.15, 16 This inhibitor is expressed from a plasmid or construct without chemical modifications that produce continual expression of a specific antisense RNA molecule in cells and transgenic mice.15-20 The PMIS delivers physiological levels of specific miR inhibitors to cells and in transgenic mice with high specificity and no off-target effects or toxicity.15, 16
Because increased miR-210 levels are directly correlated with metastatic colorectal tumours, we hypothesized that using PMIS-miR-210 would effectively decrease tumour growth. miR-210 is expressed in many cell types and regulates multiple biological processes, including the aetiology of several cancer progressions.21-23 High levels of miR-210 have been implicated in lung, prostate, oesophageal and bladder cancer, and predict poor survival in cancer patients.24, 25 miR-210 is regulated by hypoxia and helps regulate the hypoxia response and HIF-1a binds to a hypoxia response element in the miR-210 proximal promoter.26, 27 Because miR-210 can target many processes including angiogenesis, apoptosis, DNA repair, cell cycle progression and mitochondrial function, it is considered an exceptional therapeutic target.26 Furthermore, miR-210 levels correlate with tumour prognosis, and individuals with CRC have a poor long-term prognosis if the initial tumour is miR-210 high versus miR-210 low.28
We profiled PMIS-miR-210 transduced and untreated CRC cells and tumours for gene expression changes and focused on two genes XIST and NME1 that were significantly affected by miR-210 inhibition. XIST is a long non-coding RNA that is involved in sex-specific inactivation of one X chromosome in females. The mis-regulation of XIST has been reported in numerous cancers. XIST may have tumour suppressor functions in cervical, breast, hepatocellular, prostate and osteosarcoma cancers29-34 and may act as a tumour promoter in pancreatic, bladder, colon, thyroid, gastric and glioblastoma cancers.35-41 NME1 is a nucleoside diphosphate kinase, and NME family members share significant homology, including some members with DNA binding domains that regulate transcription and DNA repair. NME1 can regulate gene expression by binding to promoter/enhancer regions of genes that contribute to tumour metastasis suppressor function.42
In this study, we first generated stable colon cancer cell lines expressing PMIS-empty vector (EV) control or PMIS-miR-210 and performed in vitro assays to identify morphology, growth and gene expression changes, and use an explant model to test in vivo tumour growth of these lines. Furthermore, we test the ability of PMIS-miR-210 injections at inhibiting the growth of existing tumours. PMIS-miR-210 transcripts are found in extracellular vesicles (ECVs) and these ECVs allow for the spread of PMIS-miR-210 expression within the tumour. The inhibition of miR-210 in cells changes several key in vitro characteristics and causes a significant reduction of tumour growth in xenograft mice. miR-210 can bind and regulate XIST transcripts and miR-210 inhibition increases XIST transcripts and XIST acts to modulate epigenetic factors. We show that the inhibition of miR-210 caused an increase in H3K4me3 and H3K27ac chromatin deposition at the NME1 promoter associated with an upregulation of NME1. XIST transcripts are stabilized by the loss of miR-210 and appear to induce these transcriptional active marks on the NME1 proximal promoter.
2 MATERIALS AND METHODS
2.1 Study design
2.1.1 Sample size
Predetermined sample size was estimated from statistical analyses and also to demonstrate effectiveness of the experimental procedure. A general analysis was based on pilot studies and performed based on Lehr's formula with one outcome and analysis used was the student's t-test. We added additional samples (another immunodeficient mouse line) to confirm the previous results.
2.1.2 Rules for stopping data collection
Final endpoints for tumour size and shape were determined by the University of Iowa office of animal care and all procedures were approved by the Institutional Animal Care and Use Committee (IACUC). Once tumours reached a predetermined size, animal care informed us to stop the study.
2.1.3 Data inclusion/exclusion criteria
All mouse data are included in the manuscript, no mice died or were excluded from the data. We report all data, nothing was omitted.
2.1.4 Selection of endpoints
The growing tumour size determined the endpoint of the study. Once tumours reached a measurable size, treatment began and all mice responded to the treatment and no mice were excluded from the study. Tumour size was dependent on the amount of cells injected into the flanks of mice and determined with caliper and bioluminescence imaging (BLI) imaging analyses.
2.1.5 Replicates
Each experiment was performed between four and six times. Replicates were determined after a set number of mice were treated. All results were substantiated by each repetition.
2.1.6 Research objectives
Because colorectal cancers and tumour profiles showed that patients with high miR-210 expression had a low survival rate, our hypothesis stated that ‘if we use our specific PMIS-miR-210 inhibitor, it would effectively inhibit tumour growth’. Our hypothesis was validated after initial mouse experiments.
2.1.7 Research subjects
Two types of immunodeficient mice models were used in the study to validate our system. Furthermore, we not only used PMIS-miR-210-transduced colorectal tumour cells before injection into the flanks of the mice and measured tumour formation, we also let the tumours grow and then treated them with direct injection of PMIS-miR-210 plasmid DNA.
2.1.8 Experimental design
Mice were randomly injected with different concentrations of colorectal tumour cells, and treatments were applied in a blinded study before images of the tumours (BLI before treatment) were analyzed. Mice were randomly selected for different treatments without prior knowledge of tumour size or shape.
2.1.9 Randomization
All mice were treated identically and no mice were excluded.
2.1.10 Blinding
Prior to injection of PMIS-miR-210 or controls into the tumours, the mice were randomly selected and no preference was given to a mouse tumour size and shape by BLI imaging prior to treatments.
2.1.11 Statistical analysis
All experiments were independent replicates of four to six.
2.2 Cell culture, transient transfections, luciferase and β-galactosidase assays
The CCD841 (normal colon epithelium), SW480 (primary colon tumour), SW620 (secondary/metastatic tumour from same patient as SW480), Colo320, DLD1 (colon cancer cell lines) and HEK 293 cells were obtained from ATCC and cultured in DMEM supplemented with 10% FBS and penicillin/streptomycin. Briefly, according to ATCC, SW480 cells are from a primary CRC tumour and SW620 is from a CRC tumour that has metastasized to the lymph node, same patient as SW480. Transfected cells were incubated for 48 h and then lysed for reporter activities and protein content by Bradford assay (Bio-Rad) as previously described.43, 44 Western blots were performed as previously described.43, 44 ECVs were isolated from the media of cells cultured for 24 h using the miRCURY cell/urine/CSF kit (Qiagen).
Transwell plates using 3.0 μm pore sizes were used (Nunc, Thermo Fisher). Transwell experiments were performed by plating 2 × 10⁵ recipient SW620 cells into six-well plates. Within the transwell insert, 0.5, 1 or 2 × 10⁵ donor cells were seeded, SW620 PMIS-miR-210. After 72 h, the inserts were removed and RNA was isolated from the recipient cells using the RNA easy miR kit (Qiagen). The EV inhibitor Neticonazole (Selleck chemicals) was used at 10 μm in culture for 48 h. Control exosome preps and RNA were isolated from SW620 and SW620 PMIS-miR-210 cultures with 10 μm neticonazole to demonstrate the effectiveness of the EV inhibitor in these cells. All experiments were repeated three times.
2.3 PMIS lentiviral vector generation, plasmids and cell proliferation assays
The plasmid-based microRNA inhibition system (PMIS system; https://naturemiri.com/) was previously described.15, 16 The PMIS molecule is 122 nucleotides containing an antisense sequence to a specific miR in a stem loop. It has a high affinity for the mature miR and interacts with the RISC complex. The PMIS can distinguish and selectively inhibit miRs with only one nucleotide difference. A second-generation lentiviral vector system was used to transduce SW620 cells to generate stable lines expressing PMIS-miR-210 and PMIS-EV. The packaging vectors were co-transected with psPAX2 and pMDG.2 (Addgene) into HEK 293 FT cells to generate lentiviral molecules. Stable cell lines were generated and maintained in puro selection at 0.5ug/ml. A luciferase positive line was generated using LV570 plasmids to generate luciferase positive SW620 cells (Genetarget, Inc). Transfections were conducted using PEI-mediated DNA introduction into cells, including XIST expression, pXIST, NME expression (Addgene) and miR-210 over expression plasmids.
2.4 Plasmid DNA preparations
All plasmid preps were generated by alkaline lysis followed by CsCl gradient purification, double banded CsCL purified as done previously.44, 45
2.5 RNA and qPCR analysis
Total RNA, including PMIS lines from cells and from tumour tissue, was prepared using the trizol (Thermo Fisher) and miRNeasy Mini Kit when required (Qiagen). Multiple isolations were performed, and separate qPCR assays were run on each sample (N = 3). The amount and integrity of the RNA samples were assessed by measurement at 260 and 280 nm and by agarose gel analyses. Quantitative real-time PCR for mature miR expression was done with Qiagen microRNA assay system (Qiagen, CA, USA), including U6B as a reference gene. Total RNA was reverse transcribed into cDNA using reverse transcriptase and mix of OligoDT and random primers. Real-time PCR was carried out using SYBR Green Supermix, 0.1 μmol/L forward primer, 0.1 μmol/L reverse primer and 0.25 μl cDNA template in a Bio-Rad cycler (Takara, CA, USA). β-tubulin served as a reference gene and ΔΔCt values were used to calculate fold differences. Melting curve analyses were performed to confirm amplification specificity of the PCR products and each probe was initially sequenced. PCR primers are listed in Table S1. miR levels were assessed using the micro scriptRT system (Qiagen) and miR-specific primers and qPCR.
2.6 RNA sequencing
RNA sequencing was performed using SW620 PMIS-EV and SW620 PMIS-miR-210 cell lines, and tumours generated from those cell lines by LC sciences (Houston, TX, USA) and analyzed using TruSeq Stranded RNA-seq software. Using the Illumina paired-end RNA-seq approach, we sequenced the transcriptome, generating a total of millon 2 × 150 bp paired-end reads. Reads obtained from the sequencing machines include raw reads containing adapters or low quality bases, which will affect the following assembly and analysis. Thus, to get high-quality clean reads, reads were further filtered by Cutadapt (https://cutadapt.readthedocs.io/en/stable/, version: cutadapt-1.9). Genes with a two-fold or greater expression change in PMIS-210 versus PMIS-EV were compared among the cells and the tumours and 120 genes showed similar expression changes. Pathway analysis was conducted using functional gene sets, gene ontology (GO) and gene set enrichment analysis (GSEA). Putative targets were verified by qPCR, and the 3′UTRs were cloned for NME1 and FGFRL1 into the pMIR-luciferase reporter and tested for activity with and without inhibition by miR-210. Statistical significance was determined using the Student's t-test.
2.7 Xenograft model
All mouse studies were done under the guidelines of the University of Iowa office of animal care and all procedures were approved by the IACUC committee. Male nude mice (Foxn1nu/j; ages 6–7 weeks, JAX stock #002019) and NSG (NSG ages 6–7 weeks, JAX stock strain #005557) mice were purchased from Jackson labs and were maintained in laminar flow cages under pathogen-free conditions. The selection of dose, amount of cells and schedule of treatments in mice were calculated based on previous experiments, cell growth to tumour formation and treatments were set when tumour growth reached effective size for treatments. Furthermore, the University of Iowa office of animal care put restrictions on allowable tumour sizes, so treatments began before tumours were considered too large for the animals. 5 × 10⁵ SW620 PMIS-EV cells or SW620 PMIS-miR-210 cells were suspended in sterile saline and were administered by subcutaneous injection into either flank area of nude mice. The mice were weighed, and tumour sizes were measured every other day with calipers for calculation of tumour size, length and width. Tumours were harvested after 35–40 days.
Mice were analyzed by BLI at 7–10 days after SW620 cell implantation to show that each flank received tumours and again at 35–40 days after implantation, mice were then sacrificed, and the tumours were collected and weighed. For some experiments, the tumours were dissected into two equal halves, one for RNA and one placed in 4% PFA for tissue analysis. For RNA extraction, tumour pieces were flash-frozen in LN2, tissue was crushed and lysed in trizol, and RNA was extracted using the Qiagen miRNeasy Extraction Kit (Qiagen). Analysis of the expression levels of miR-210 and other control or target genes was performed by qPCR as described earlier.
In separate studies, luciferase-positive SW620 (1 × 10⁶ cells, SW620 LV+) were injected into both flanks of 6–7-week-old Foxn1nu/j or NSG mice and the tumours were allowed to grow for 7–10 days, until clearly visible under BLI conditions to determine localization and size of the injected tumour. Naked plasmid DNA (PMIS-miR-210, PMIS-EV or no DNA/normal saline) was injected directly into and around each tumour. DNA in sterile saline was suspended at 50 or 100 ng/μl and 100 μl was injected. 100 μl (5 or 10 μg) was injected into the solid mass of the tumour at days 7–10 and then again after 5 days. Several mice with tumours implanted were given capecitabine (Sigma) treatment, a known colon cancer drug at a dose of 750 mg/kg by gavage oral administration. Caliper measurements were made at the time of the DNA injection prior to treatments and after treatments. 35–40 days after tumour formation, tumours were imaged by BLI methods and removed and processed as mentioned previously.
2.8 Aspartate transferase and alanine aminotransferase measurements
Serum from mice was measured for aspartate transferase (AST) and alanine aminotransferase (ALT) levels using the manufacturer-recommended conditions (Sigma). One unit of AST is the amount of enzyme that will generate 1.0 mole of glutamate per minute at pH 8.0 at 37°C. One unit of ALT is defined as the amount of enzyme that generates 1.0 μmol of pyruvate per minute at 37°C.
2.9 Bioluminescence imaging
To image tumour cells in vivo, mice were i.p. injected with 100 μl of luciferin stocks (in sterile saline). The animals were anaesthetized with isoflurane (2% in 1 L/min oxygen), and bioluminescence images (BLI) were acquired using the IVIS Lumina system (a Xenogen Product from Caliper Life Sciences, now Perkin-Elmer). Images were acquired every 2 min (10 s exposure/image).
2.10 Haematoxylin and eosin and IHC
Tumours were fixed in 4% PFA, dehydrated and embedded in paraffin. Sections were stained in haematoxylin and eosin (H&E) or treated for antigen retrieval and stained for IF with Ki67 (Abcam), GFP (Invitrogen), Caspase C3 (DSHB, Iowa), NME1 (Thermo Fisher), CD9 and CD31 (DSHB, Iowa) antibodies.
2.11 H3K4me3 and H3K27ac ChIP-qPCR
Chromatin immunoprecipitations (ChIPs) were performed as described here. Formaldehyde-cross-linked cells were lysed and sonicated to shear the DNA. The sonicated DNA–protein complexes were immunoprecipitated (IP) with the following antibodies: control IgG (A01008, GenScript), anti-H3K4me3 (ab8580, Abcam) and anti-H3K27ac (ab4729, Abcam). The immuno-complexes were collected using protein A/G agarose beads. The eluted DNA and 10% of respective input DNA were reverse cross-linked at 65°C overnight and used for the qPCR using SYBR Green qPCR mix and a CFX96 instrument (BioRad). The enrichments were calculated as percentage of input. Folds change over input was displayed after normalizing to UTR region.
2.12 XIST in situ experiments
SW620 or SW620 PMIS-miR-210 cells were seeded on glass cover slips and allowed to grow for 24 h. Cells were fixed and permeabilized under RNAase-free conditions and in situ hybridization was performed using tellaris FISH in situ probes labelled with Q570 (Biosearch Technologies) for 16 h at 55°C, washed, counterstained with DAPi and imaged using the Confocal Zeiss 700.
2.13 Extracellular vesicle isolation and identification
Extracellular vesicles were isolated from the media of cells cultured for 24 h using the miRCURY cell/urine/CSF kit (Qiagen). Detection of exosome-specific proteins by Western blot was performed using CD9 and CD63 antibodies (Developmental Studies Hybridoma Bank, University of Iowa). Transwell experiments were performed using SW620 cells as the recipient cells and SW620 PMIS-miR-210 as the donor cells. Six-well transwell culture vessels were seeded with 2 × 10⁵ recipient cells in the well and 2 × 10⁵, 1 × 10⁵, 0.5 × 10⁵ donor cells in the transwell chamber. After 72 h, cells in the transwell chamber were removed and RNA was isolated from the recipient cells. cDNAs were made and qPCR was performed. Each transwell experiment was repeated three times.
2.14 Statistical analysis
For each condition, a minimum of three experiments was performed and error bars were presented as the ±SEM. An independent two-tailed t-test was used to determine the significance of differences between groups.
2.15 Primers used in ChIP and qPCR experiments
2.15.1 ChIP primers
NME1 UTR: 261 bps
F: GCTCTTGGAGCTGTGAGTTCT
R: CCAAGAGTGGAAGGGATGCG
NME1 TSS: 258 bps
F: TAGTCGCGGGAGTGGGTTA
R: CAAGCACTTACAGAGCGCCA
RBCK1 TSS: 197 bps
RBCK1TSS F: GTAGCATTTCCCAGGAGGCA
RBCK1TSS R: GTAGAGGGAGGGCAGGCTAA
RBCK1 UTR: 170 bps
RBCK1UTR F: TGCCAGATCGTGGTACAGAA
RBCK1UTR R: CAGCCCTCCTCTAAGGCAAA
2.15.2 RT-qPCR primers
RBCK1 fwd5′-GCA GAT GAA CTG CAA GGA GTA TCA-3′
RBCK1 rev5′-TGC AGC ATC ACC TTC AGC AT-3
3 RESULTS
3.1 miR-210 expression increases in metastatic colorectal cancer
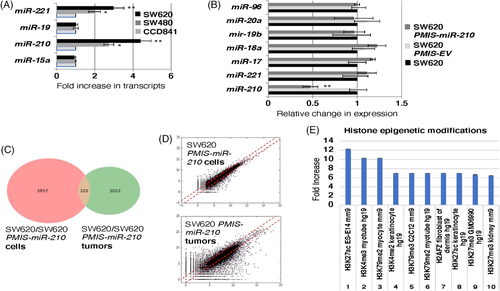
SW480 and SW620 colorectal cancer lines were compared to normal colon epithelium (CCD841) for expression of key molecules and miRs, including miR-210, morphology and growth rates. miR-210 expression increases in metastatic tumour cells (SW620) compared to primary tumour cells (SW480) and normal colon epithelia (CC841) (Figure 1A). In addition, DLD1 and Colo320 colorectal tumour cells were also analyzed and showed similar miR-210 levels (Figure S1). These data correlate to the survival rate of patients with colorectal cancer, as the survival rate of these patients drops significantly with high levels of miR-210 expression.46 We focused on SW620 cells for most of the research in this study because these cells have high miR-210 expression and are associated with more severe colorectal cancer. SW620 cells were transduced with the PMIS-miR-210 inhibitor and a panel of miRs were analyzed for their expression compared to PMIS-EV and non-transduced cells. PMIS-miR-210 inhibited miR-210 in the transduced cells (Figure 1B), accompanied by a slight reduction in growth and mild changes in morphology. However, these changes were not significant and could not be quantitated. DLD1 and Colo320 cells were transduced with PMIS-miR-210 and inhibited miR-210 expression (Figure S1).
3.2 SW620 cells and tumours present with different gene expression profiles
RNA sequencing of SW620 and SW620-PMIS-miR-210 cells in culture were compared to SW620 and SW620-PMIS-miR-210 tumours formed in xenograft mice. The analyses of gene expression revealed only 120 genes were shared between the two groups, highlighting the difference between cells in culture and tumours excised from the mice (Figure 1C,D). We have highlighted histone epigenetic modification pathways affected in both PMIS-miR-210-transduced cells and tumours. Gene ontology analyses identified several pathways regulated by miR-210. Epigenetic modifications were upregulated and these modifications are associated with cancer and microRNAs. We will focus on H3K27ac and H3K4me3, two chromatin modifiers associated with proximal promoters and transcriptional activation in later experiments (Figure 1E).
3.3 PMIS-miR-210 inhibits colorectal tumour formation
Because high miR-210 expression is associated with colorectal tumours, we first investigated if SW620 cells transduced with PMIS-miR-210 would form tumours in Foxn1nu/j mice. Lentiviral constructs expressing PMIS-miR-210 or PMIS-EV were used to transduce SW620 cells and the transduced cells were FACS sorted for PMIS-miR-210 and PMIS-EV expression (GFP is expressed from the constructs), which were used to inject into the flanks of Foxn1nu/j mice. Approximately 5 × 10⁵ cells were placed into each flank and tumours allowed to grow for 4 weeks. Tumours were excised after 4 weeks and measured for growth. Surprisingly, tumours were not formed in five out of eight PMIS-miR-210 SW620 cell transplants and the three tumours that did form were smaller than PMIS-EV controls (Figure 2A).
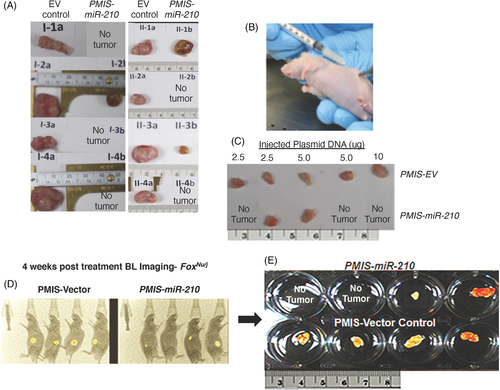
We next studied if injecting PMIS-miR-210 plasmid DNA directly into the tumour would affect tumour growth. The SW620 tumours (5 × 10⁵ cells) were allowed to form and after 7–10 days of growth, several concentrations of PMIS-miR-210 or PMIS-EV ‘naked’ plasmid DNA were injected into the growing tumour. After 35–40 days of DNA injection, three of the five tumours disappeared using different doses of DNA (Figure 2B,C). In the next set of experiments, SW620 luciferase-positive cells (5 × 10⁵ cells) were implanted, and tumours were allowed to form and grow for 7–10 days and then injected with PMIS constructs (10 μg) and imaged 35–40 days later to assess tumour growth. Mice with PMIS-miR-210 injections showed reduced bioluminescence compared to controls and in two of four mice with PMIS-miR-210 injections, tumours were not found (Figure 2D,E).
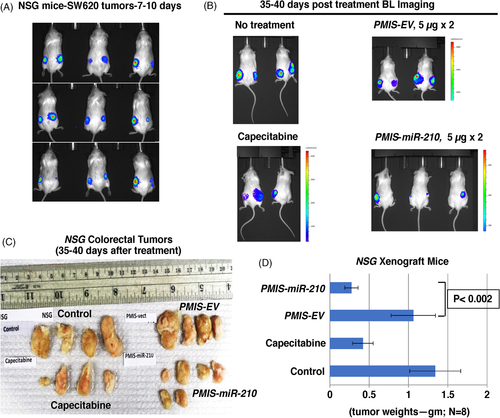
To further confirm these results, NSG mice (immunodeficient, lack T and B cells and NK cells) were transplanted with 1 × 10⁶ SW620 cells (2× more cells than previous experiments) on each flank, and tumours were allowed to grow for 7–10 days. Doubling the number of injected cells resulted in tumours that were almost twice as large as in the previous experiments, and BLI showed the tumours had formed in the mice after 7–10 days (Figure 3A). The mice (randomly selected without bias) were either treated with PMIS-EV or PMIS-miR-210 plasmid DNA with one injection of 5 μg and after 5 days injected again with 5 μg DNA and sacrificed after 35–40 days. These were then compared to a no-treatment group and a group given capecitabine (Xeloda), which is used to treat patients with metastatic colorectal cancer.47 The NSG mice treated with PMIS-miR-210 had reduced bioluminescence compared to controls and capecitabine (Figure 3B). The NSG mice treated with PMIS-miR-210 showed significantly reduced tumour size and growth compared to controls (Figure 3C,D). Capecitabine treatment caused a decrease in tumour size but was less effective than the PMIS-miR-210 treatment (Figure 3C,D). Tumours were not found in other tissues and the tissues surrounding the tumours were not affected by the treatments.
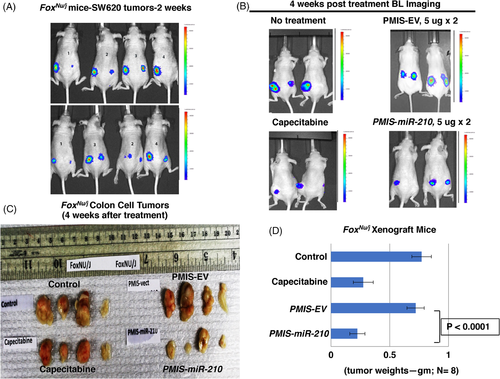
These experiments were repeated using Foxn1nu/j mice (immunodeficient, lack T cells) and the same parameters used for the NSG mice. The growing tumours were visualized in the mice after 7–10 days (Figure 4A). As with NSG mice, these mice were treated under the same protocol. The mice treated with PMIS-miR-210 and capecitabine both showed reduced tumour bioluminescence (Figure 4B). The tumours were removed after 35–40 days, measured, weighed, and analyzed. Foxn1nu/j mice treated with PMIS-miR-210 had significantly reduced tumour size and growth compared to controls (Figure 4C,D). Capecitabine treatment showed a decrease in tumour size but was less effective than the PMIS-miR-210 treatment (Figure 4C,D). These data demonstrate the efficacy of the PMIS-miR-210 treatment for growing colorectal tumours in two different immunocompromised mice models. Interestingly, treatment of smaller tumours (5 × 10⁵ vs. 1 × 10⁶ cells) resulted in several PMIS-miR-210 tumours completely disappearing, demonstrating that treatments of smaller tumours have a better outcome. However, in this report tumours were harvested after only 35–40 days post treatment, and a better response may be achieved after longer treatment times. Tumour growth was measured using a caliper and recorded prior to injection and 1 week after injection (Figure S2). Furthermore, toxicity screening for ALT and AST in the blood and liver of these mice showed no elevated levels of these markers, suggesting that longer treatment times with PMIS-miR-210 would be safe (Figure S3).
3.4 PMIS-miR-210 is widely expressed in the injected colorectal tumours
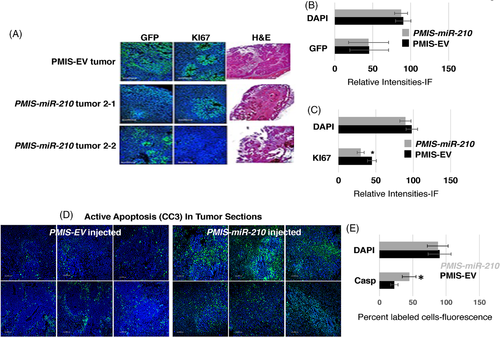
To determine if the tumour cells were expressing the miR-210 inhibitor, we assayed for GFP expression as both PMIS-EV and PMIS-miR-210 expression constructs also express GFP. GFP was expressed throughout the tumours in both the PMIS-EV and PMIS-miR-210 treatment groups (Figure 5A,B). Multiple tumours and sections were analyzed for GFP expression and representative GFP staining is shown in Figure 5A. The expression of Ki67, a marker for proliferating cells, was decreased in the PMIS-miR-210 tumours compared to PMIS-EV tumours (Figure 5A,C). Several tumours were stained with H&E to show cellular and tissue structures. The PMIS-miR-210-treated tumours showed a less dense tissue with decreased vascularization and structure (Figure 5A). These data demonstrate that direct injection of PMIS-miR-210 plasmid DNA into cancer tissue results in widespread PMIS-miR-210 expression. miR-210 expression was inhibited in the tumours by PMIS-miR-210 (2.7-fold decrease compared to EV control).
3.5 Inhibition of miR-210 activates the apoptotic pathway in colorectal tumours
The colorectal tumours in all xenograft mice were either reduced in size or disappeared after PMIS-miR-210 treatment, while cell proliferation was moderately reduced compared to control groups. Therefore, we assayed tumour sections for active apoptosis using cleaved caspase 3 (CC3) expression. In PMIS-EV-injected sections (six serial sections), only a small amount of CC3 was expressed; however, PMIS-miR-210-injected sections contained high levels of CC3 expression, indicating active apoptosis in these tumours (Figure 5D). Apoptosis was quantified by RNA sequencing (Casp3 increased two-fold in PMIS-miR-210 tumours, compared to controls) and qPCR (Casp3 increased 2.7-fold in PMIS-miR-210 tumours, compared to controls). Furthermore, fluorescence intensity was measured in the sections and showed a significant increase in CC3 expression in the PMIS-miR-210 tumours compared to controls (Figure 5E). Clearly, apoptosis can account for the decrease in tumour growth; however, there are other mechanisms and targets of miR-210 that play a role in tumour growth.
3.6 miR-210 inhibits NME1 expression in colorectal tumours
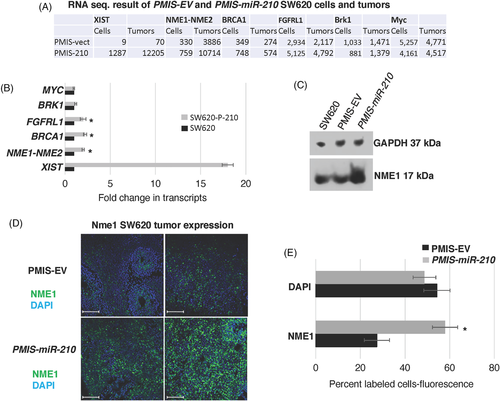
RNA sequencing of SW620 cells and tumours transduced with PMIS-EV or PMIS-miR-210 revealed an increase in NME1 transcripts in the PMIS-miR-210 cells and tumours compared to controls (Figure 6A). These results were validated by qPCR from RNA isolated from the tumours and by an increase in protein expression (Figure 6B,C). NME1 was significantly increased in PMIS-miR-210 tumour sections compared to PMIS-EV controls (Figure 6D,E). NME1 can regulate gene expression by binding to promoter/enhancer regions of genes that contribute to tumour metastasis suppressor function.42 miR-210 appears to repress NME1 expression as a partial mechanism to regulate tumorigenicity. These results were also observed in DLD1 and Colo320 cells (Figure S1). However, miR-210 does not bind to the 3′UTR of NME1, and we determined that the regulation of NME1 occurs through epigenetic modification of the genome.
3.7 miR-210 regulates the amount of XIST transcripts in cells
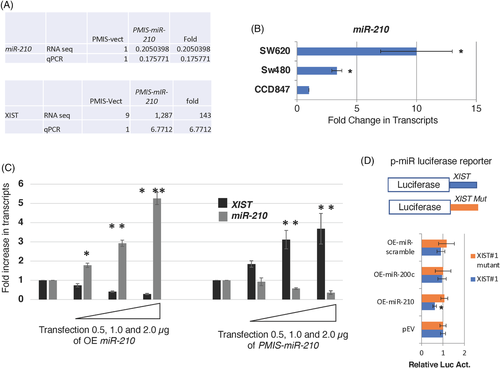
We show a direct correlation of miR-210 expression and the levels of the long non-coding RNA (LncRNA X-inactive specific transcript) XIST transcripts. Both RNA-seq and qPCR of RNA isolated from tumours and transduced SW620 cells demonstrate that PMIS-miR-210 inhibits miR-210 by over 80%, which results in an increase in XIST transcripts (Figure 7A). As mentioned previously, increasing miR-210 transcripts correlates with advanced stages of colorectal cancer and miR-210 is highly expressed in the SW620 metastatic colon cancer cell line compared to the non-metastatic SW480 colon cancer cell line and normal colon epithelium (Figure 7B). To further demonstrate the inverse correlation of miR-210 and XIST, 293 cells were transfected with increasing concentrations of plasmid DNA expressing miR-210 (overexpressing [OE] miR-210), and endogenous XIST was decreased in a dose-dependent response (Figure 7C). When endogenous miR-210 was decreased with increasing amounts of plasmid DNA expressing PMIS-miR-210, endogenous XIST was increased in a dose-dependent response (Figure 7C). Both murine and human XIST contain multiple miR-210 binding elements, indicating that miR-210 binds to XIST to regulate XIST transcript levels (Figure 7C). A dual luciferase reporter construct containing XIST sequences (with miR-210 binding elements) and XIST sequences with the miR-210 binding elements mutated (Mut) downstream of the luciferase gene were used to assay for miR-210 activity regulating XIST. OE of miR-210 inhibited luciferase activity from the Luc-XIST reporter, but not from the Luc-XIST mut (Figure 7D). As controls, OE of miR-200c, EV or miR-scrambled expression construct had no effect on luciferase activity (Figure 7D). A previous report suggested that miR-210 bind to XIST and regulate XIST transcript levels.48 Our results show a direct regulation of XIST by miR-210.
3.8 miR-210 controls the epigenetic regulation of NME1 through XIST
We wanted to check if the NME1 proximal promoter was activated by miR-210 inhibition using two epigenetic histone markers, H3K4me3 and H3K27ac. ChIP-sequencing previously identified H3K27ac and H3K4me3 peaks upstream of the NME1 transcription start site (TSS) (Figure 8A; ENCODE Consortium). We used ChIP-qPCR to determine if these epigenetic markers were increased after miR-210 inhibition in SW620 cells. Both H3K27ac and H3K4me3 were enriched at NME1 promoter elements in PMIS-miR-210 SW620 cells (Figure 8B). As a control, the BRK1 gene was not affected. These epigenetic regulators are associated with active sites of transcription49 and increased transcription elongation and enhancer activity at tumour suppressor genes.50
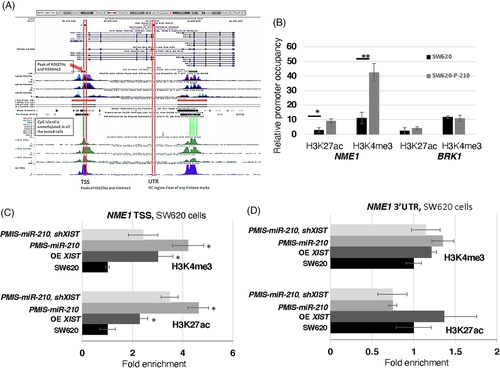
XIST was increased over 150-fold in RNA-seq experiments and over 15-fold in qPCR assays of RNA isolated from PMIS-miR-210 cells and tumours (Figure 8A,B). While XIST RNA is required for X chromosome inactivation (XCI), it can also suppress cancer in vivo.51 Because XIST expression was significantly increased in SW620 cells and tumours expressing PMIS-miR-210, we asked if XIST also contributed to epigenetic regulation of NME1. ChIP-qPCR experiments were performed for both H3K3me3 and H3K27ac in SW620 cells expressing PMIS-miR-210, OE of XIST and PMIS-miR-210 combined with XIST shRNA (to knockdown XIST transcripts). Overexpression of XIST resulted in two to three-fold enrichment of H3K27ac and H3K4me3 at the NME1 proximal promoter, demonstrating a direct effect on histone modifications by XIST (Figure 8C). PMIS-miR-210 further increased the requirement of these epigenetic factors at the NME1 promoter associated with an increase in XIST expression (Figure 8C). To validate the role of XIST, XIST expression was reduced using an shRNA to XIST and in combination with PMIS-miR-210 demonstrated a decrease in the enrichment of these epigenetic factors at the NME1 promoter, compared to PMIS-miR-210 alone or XIST OE (Figure 8C). As controls, we also determined if these factors were enriched at the NME1 3′UTR and found that they were not associated with this part of the gene (Figure 8D). These data suggest that miR-210 inhibition increases XIST expression, which can facilitate H3K4me3 and H3K27ac deposition at the NME1 promoter, activating transcription of NME1. Thus, we propose that miR-210 regulates the degradation of XIST in cells as a mechanism to promote colorectal cancer and reducing NME1 expression.
3.9 PMIS-miR-210 inhibitor is transmitted from transfected tumour cells to other tumour cells by extracellular vesicles
The levels of GFP staining suggested that most tumour cells were expressing PMIS-miR-210. Because of the high level of PMIS-miR-210 expression in tumours, we asked if the transfected tumour cells were packaging the PMIS-miR-210 transcripts into extracellular vesicles (ECVs), which could then be transfecting other cells within the tumours. To determine if SW620 cells actively packaged PMIS-miR-210 into ECVs, ECVs were isolated from SW620 cells transduced with PMIS-miR-210 (integrated PMIS-miR-210 into the chromatin, not plasmid DNA transfection) and visualized by TEM (Figure 9A). ECVs were found secreted by SW620 cells. Isolated ECVs were identified by their expression of CD63 and CD9 (Figure 9B). ECVs isolated from 293 and SW620 cells transduced with PMIS-miR-210 were analyzed for PMIS-miR-210 transcripts, and both transduced cell lines produced high levels of PMIS-miR-210 containing ECVs (Figure 9C). In initial experiments, the isolated ECVs from PMIS-miR-210-transduced 293 and SW620 cells were used to determine if miR-210 levels were affected in SW620 cells after incubation with the ECVs. ECVs from PMIS-miR-210-transduced 293 cells were able to inhibit miR-210 levels in SW620 cells at two different concentrations (Figure S4A). Furthermore, ECVs isolated from PMIS-miR-210-transduced SW620 cells were able to inhibit endogenous miR-210 in untreated SW620 cells (Figure S4A). We next asked if PMIS-miR-210 from ECVs would increase NME1 transcript levels, because we identified NME1 as a potential target of miR-210 in RNA-seq experiments. ECVs from both PMIS-miR-210-transduced 293 and SW620 cells incubated with untreated SW620 cells increased NME1 transcript levels (Figure S4B). As a control, BRK1 transcript levels were not changed, as it is not a target of miR-210 (Figure S4B). Furthermore, PMIS-miR-210 ECVs from these transduced cells increased the levels of FGFRL1 and XIST transcripts (Figure S4C).
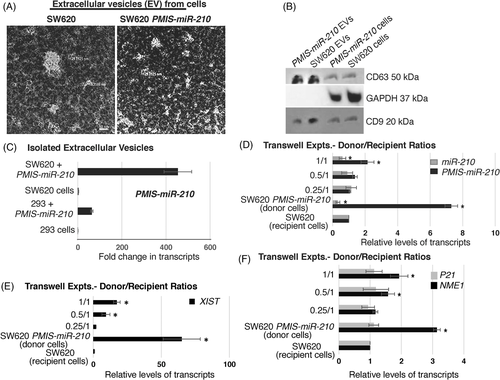
We used transwell experiments to determine if ECVs produced by the SW620 cells transduced with PMIS-miR-210 (donor cells) could transfect and express PMIS-miR-210 in SW620 recipient cells. A ratio of 1/1 (2 × 10⁵ donor cells to 2 × 10⁵ recipient cells) showed that the recipient cells expressed the PMIS-miR-210 transcript after 72 h (Figure 9D). Furthermore, miR-210 expression was decreased in the recipient cells at a 1/1 ratio (Figure 9D). The concentration of donor cells was decreased by half (0.5/1 or 1 × 10⁵ donor cells/2 × 105 recipient cells, and as expected the recipient cells showed less expression of PMIS-miR-210 compared to the 1/1 ratio (Figure 9D). miR-210 expression was decreased but less than the 1/1 ratio. A ratio of 0.25/1 cells did not show a significant effect. As controls, the donor cells express high levels of PMIS-miR-210 and decreased levels of miR-210, while the recipient cells alone did not express PMIS-miR-210 (Figure 9D). Identical experiments were performed and XIST levels were increased in the recipient cells at 1/1 and 0.5/1 ratios (Figure 9E). XIST is highly expressed in the SW620 PMIS-miR-210 transduced cells, but not in the SW620 cells (Figure 9E). In identical experiments, we show that the tumour suppressor NME1 is also increased in the recipient cells at 1/1 and 0.5/1 ratios (Figure 9F). As a control, we show that P21 was not affected as it is not a target of miR-210. NME1 transcripts were increased in the SW620 PMIS-miR-210-transduced donor cells (Figure 9F).
In addition, donor cells were treated with EV inhibitor neticonazole for 48 h and then transwell experiments were performed to demonstrate that PMIS-miR-210 was transferred to recipient cells via ECVs. Experiments were performed as in Figure 9. Recipient cells in the transwell experiments did not express PMIS-miR-210, and miR-210 levels were not affected in the recipient SW620 cells after donor cell treatments (Figure S5A). As a control, the treated SW620 PMIS-miR-210 donor cells retained expression of PMIS-miR-210 and inhibited miR-210 (Figure S5A). We also measured the level of XIST after donor cell treatments in the recipient cells and found XIST levels were not increased; however, XIST levels remained high in the SW620 PMIS-miR-210 donor cells after treatment (Figure S5B). These data suggest that extracellular vesicle transfer of PMIS-miR-210 contributes to increased tumour expression of PMIS-miR-210.
3.10 The cellular location and levels of XIST are controlled by miR-210
It is well known that XIST transcripts are expressed in the nucleus and several reports suggest that it is strictly localized to the nucleus and not found in the cytoplasm.52 In addition, a recent report suggests that U1 snRNP regulates chromatin retention of non-coding RNAs except for XIST.53 Therefore, it was unknown how miRs in the cytoplasm could interact with XIST or if XIST was exported to the cytoplasm. Our data suggest that XIST transcripts bind miR-210 and are rapidly degraded; therefore, we asked if inhibiting miR-210 resulted in XIST transcripts in the cytoplasm and a subsequent increase in nuclear XIST. In SW620 cells containing high levels of miR-210, XIST transcripts were observed confined to the nucleus (Figure 10A). However, SW620 cells expressing PMIS-miR-210 showed an increase in both nuclear and cytoplasmic XIST transcripts (Figure 10A). These data demonstrate for the first time that miR-210 controls the cytoplasmic levels of XIST and that XIST transcripts can be found in the cytoplasm when miR-210 is inhibited by PMIS-miR-210.
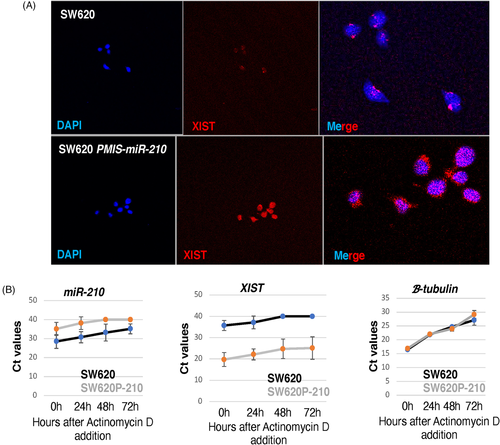
We next asked if inhibiting transcription using actinomycin D would influence the levels of miR-210 and XIST in SW620 cells. After 3 days of actinomycin D treatment, miR-210 levels were decreased in SW620 cells; however, detectable levels of miR-210 remain (Figure 10B). Inhibition of miR-210 by PMIS-miR-210 was efficient and after 2 days of actinomycin D treatment, no detectable levels of miR-210 were observed in the cells (Figure 10B). Conversely, XIST levels were low in SW620 cells and after 2 days of actinomycin D treatment, XIST transcripts were not detected (Figure 10B). However, in cells expressing PMIS-miR-210, the levels of XIST remain high even after 3 days of actinomycin D treatments (Figure 10B). Thus, XIST degradation depends on miR-210, and the regulation of XIST levels is tightly controlled by miR-210 in SW620 cells. Thus, high levels of miR-210 expression in SW620 cells reduce XIST transcripts and inhibit NME1 expression to allow for tumour growth.
4 DISCUSSION
CRC is characterized by the activation of oncogenic genes and inactivation of tumour suppressor genes. Colorectal tumours often metastasize to the liver, which decreases survival and reflects changes in gene and miR expression levels.28, 54-58 The screening of biomarkers for cancers have identified miRs as potential indicators of disease states.28, 55 miR-210 is a known biomarker of cancer, is involved in cancer progression and exhibits oncogenic properties in many cancers.21, 59 miR-210 as a potential therapeutic target is important, as it plays a role in several different biological processes such as proliferation, differentiation, apoptosis, hypoxia and angiogenesis.21, 59
There are reports of miR-210 target genes involved in cancer progression pathways. Other functions of increased miR-210 include increases in genetic instability, altering normal mitochondrial function and promoting angiogenesis and metastasis (reviewed in26). We propose miR-210 inhibition as a therapeutic approach; however, current methods to inhibit miRs in vivo are limited and with variable effectiveness.
4.1 New biotechnology to inhibit miR-210
The PMIS inhibitor is composed of native, unmodified nucleic acid that enables the development of stably expressing cells (lentivirus) and animal models for the study of genome-wide miR family inhibition to identify miR targets and cellular processes.15, 16, 20, 60 The PMIS inhibitor can be used to knockdown miRs during embryonic development to determine their effect on stem cells, cell proliferation and differentiation as well as developmental processes.15-20, 60 The PMIS system allows researchers to finally dissect the role of miRs expressed in clusters and on multiple chromosomes. The PMIS can distinguish between and differentially inhibit miRs with only one nucleotide change in their seed sequence. The unique structure of the PMIS-miR complex is bound by factors of the RISC, making it very stable, efficient, with a high specificity and affinity for specific miRs and is not toxic in animals and cells.15 The PMIS works in transgenic animals (in vivo) as well as xenograft animal models without adverse side effects, and it has great promise as a therapeutic molecule in clinical applications.
4.2 Therapeutic delivery
Different methods of miR inhibitor delivery must address the effectiveness and off-target effects of treatment and include toxicity, harmful side effects and specificity. Most miR inhibitors used in therapeutic applications are antagomirs, LNAs, PNAs (peptide nucleic acids), and anti-miR oligonucleotides.8, 26, 61 Because oligonucleotides must be encapsulated to be stabilized and taken up by the cell, synthetic delivery systems including lipoplexes, polyethyleneimine (PEI)-based systems and poly(lactide-co-glycolide) (PLGA)-derived nanoparticles and adaptations of nanoparticle technology have been used for targeted therapeutic delivery.61-65 Viral vectors including lentiviral vectors expressing miR sponge or antagomir have been used to knockdown miRs in cells and mice.66-70 However, these methods are not efficacious, specific and have off-target effects.
Extracellular vesicles and exosomes as delivery methods for miRs and miR inhibitors have been shown to effectively deliver small anti-sense oligonucleotides, miR mimics and endogenous miRs. miRs can act as mobile genetic signals both systemically and for intercellular communication.71 miRs contained in extracellular vesicles and exosomes can transfer information cell-to-cell within a tissue and from exosomes produced by many cells found in serum and saliva to other types of tissues.72-76 It has been shown that miR transport between mesenchyme and epithelial tissue during submandibular gland development is important for normal morphogenesis.76
4.3 Effective and efficacious PMIS-miR-210 plasmid DNA delivery
We demonstrate using ‘naked’ PMIS plasmid DNA delivery as a safe and effective method to inhibit miRs in cells and tissues. It is well known that direct injection of plasmid DNA into tissues can express transcripts and proteins. Whether for vaccines or therapeutic treatments, plasmid DNA has been successfully injected into muscle, pancreas, brain and liver.77-83 However, direct injection into the blood has low efficiency and the plasmid DNA is rapidly degraded and a disadvantage of direct injection of naked plasmid DNA in some cases is that it can be degraded prior to high levels of gene expression.
We found that using highly purified supercoiled plasmid DNA (CsCL gradient isolation) at relatively low concentrations (5–10 μg) directly injected into the growing tumour produced efficient expression of the PMIS-miR-210 inhibitor RNA transcript. The PMIS RNA is extremely stable in cells and not rapidly degraded.15 Therefore, because the PMIS molecule is stable, the cell packages PMIS-miR-210 into exosomes, which can be transferred to other tumour cells and create tumour-wide expression. This system provides a new approach as a therapeutic reagent because of its unique properties including (a) high specificity for mature miRs, (b) no toxicity, (c) stable RNA molecule, (d) in vivo efficacy, (e) does not require repeated dosing to be effective, and (f) does not require a toxic nanoparticle delivery method. Furthermore, 100% of cells need not be transfected with plasmid DNA to illicit a response. The PMIS-miR-210 transcripts can be transmitted to other tumour cells by exosomes to activate apoptosis and gene expression programmes. The treated mice have normal levels of ALT, AST and bilirubin and normal liver structure, indicating no toxicity due to the administration of PMIS-miR-210.
4.4 miR-210 regulates apoptosis in colorectal tumours
miR-210 expression is associated with cell proliferation and apoptosis. Increased miR-210 expression in glioblastoma multiforme cells induces proliferation and decreases apoptosis by targeting the regulator of differentiation 1 (ROD1).84 miR-210 expression inhibits apoptosis in cardiomyocyte cells by targeting ephrin A3, PTP1b, Casp8ap2, ISCU and Sirt3.21, 85, 86 We found that miR-210 inhibition in SW620 metastatic colorectal tumours staining for Ki67 showed a slight but significant decrease in tumour cell proliferation. Active apoptosis was observed in tumour sections when miR-210 was inhibited and correlates to a decrease in tumour size. Thus, while miR-210 expression and inhibition of apoptosis is good for heart repair, miR-210 inhibition by PMIS-miR-210 works to activate apoptosis in colorectal cancer.
4.5 The role of XIST and miR-210 in colorectal cancer
lncRNA XIST (X-inactive specific transcript) is a master regulator of X inactivation in mammals. The role of XIST in cancer is unclear as reports suggest it is a tumour-suppressor while other reports suggest XIST has tumour promotion effects in several human cancers (for a review52). We became interested in XIST after profiling SW620 cells and tumours using RNA-seq and found that upon inhibition of miR-210, XIST was highly expressed and associated with decreased tumour growth. XIST was the highest expressed transcript when miR-210 was inhibited in both cells and tumours, thus high XIST expression was correlated with decreased colorectal tumour growth.
XIST acts as a sponge for several microRNAs, including miR-126, miR-485, miR-214 and miR-497.86-89 These miRs binding to XIST can either promote cancer87, 89 or have anticancer effects through regulating the miR target genes.86, 88 miR-210 has been shown to bind to XIST as well as the tumour suppressor genes, APC, ACVR1B, CDK10, SERTAD2, E2F3 and MNT in an miR-210 candidate gene screen.48 Furthermore, inhibition of miR-210 induced apoptosis in hypoxic HUVEC cells.48 Interestingly, XIST has been reported to be restricted to the nucleus and is associated with the X chromosome and it is unclear how XIST could act as an miR sponge.52 Several miRs have been found in the nucleus associated with human cancers (see review90). miR-210 could shuttle between the nucleus and cytoplasm to regulate gene expression as suggested in a previous report.48
Our studies found that inhibition of miR-210 resulted in an increase in XIST transcripts in both the cytoplasm and nucleus of SW620 cells expressing PMIS-miR-210. The inhibition of miR-210 stabilizes XIST transcripts. We have shown that XIST transcripts are expressed at low levels in these cells and localized to the nucleus in SW620 cells. We propose that miR-210 binds to XIST to rapidly inactivate and degrade XIST transcripts in the cytoplasm and possibly in the nucleus. Therefore, XIST transcripts may not be observed in the cytoplasm due to miRs binding and targeting XIST for degradation. Thus, miR-210 would reduce XIST expression and inhibit XIST from acting as a tumour suppressor. We provide evidence for the regulation of NME1, a tumour suppressor, through miR-210/XIST-mediated epigenetic mechanism.
4.6 XIST epigenetic regulation of NME1 expression
Bioinformatic analyses of RNA-seq data from PMIS-miR-210 SW620 cells and tumours revealed several new genes were upregulated, including the tumour suppressor NME1. NME1 was identified as a gene upregulated in both PMIS-miR-210 cells and tumours. NME1 is a metastasis suppressor protein with the ability to suppress the metastatic phenotype of cancer cells without affecting primary tumour growth.42, 91 NME1 was increased in both SW620 cells and tumours when miR-210 was inhibited and confirmed by qPCR and Western blot analyses. In PMIS-miR-210-injected tumours, NME1 was widely expressed in tumour sections. However, NME1 does not contain a binding site for miR-210 and is not directly regulated by miR-210 (data not shown). Genomic analyses of the NME1 gene found peaks for H3K27ac and H3K4me3 near the proximal promoter of NME1. ChIP-seq experiments found increased levels of H3K27ac and H3K4me3 deposition at the NME1 proximal promoter in PMIS-miR-210 SW620 cells compared to controls, indicating active enhancers/promoters.49 XIST is best known for the kinetics of X-chromosome inactivation during differentiating female embryonic stem cells (review92). XIST is thought to initiate silenced chromatin by inhibiting H3K4me3 and H3K9ac transcriptionally active markers and interacting with H3K27me3 to repress chromatin.93 However, after embryonic development XIST may be repurposed or reprogrammed especially in cancer to act as a tumour suppressor.52 We show that both inhibition of miR-210 and overexpression of XIST activates both H3K27ac and H3K4me3 active chromatin markers at the NME1 proximal promoter. Therefore, the inhibition of miR-210 increases XIST transcripts, which can interact with the NME1 locus to open the chromatin and increase NME1 expression.
4.7 PMIS-miR-210 is an efficient anti-cancer therapeutic reagent
miR-210 is aberrantly expressed in multiple cancers and a previous study identified several miR-210 directly and indirectly regulated cellular processes associated with hypoxia and cancer.48 In 293 cells, miR-210 has been shown to regulate the genes modulating the cell cycle, differentiation, development, membrane trafficking, migration/adhesion and DNA binding.48 A model for the proposed function of miR-210 in colorectal cancer is shown in Figure 11. We used the PMIS-miR-210 system to make stable cell lines and to inhibit tumour growth and identified the NME1 tumour suppressor regulated by an miR-210/XIST pathway.
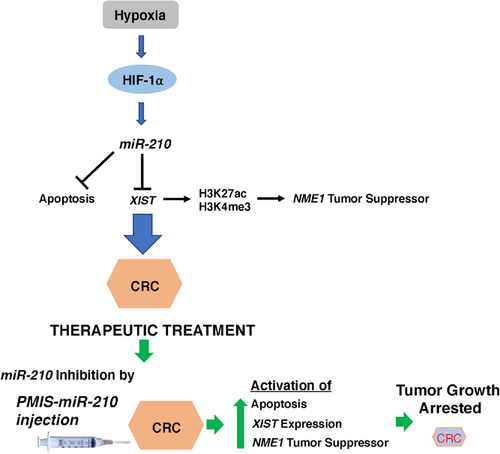
To advance the potential for treatment of cancer, we directly injected naked PMIS-miR-210 plasmid DNA into the tumour. We used this treatment as the FDA has approved the use of plasmid DNA previously for the treatment of diseases. However, the use of PLGA and PEI nanoparticles are not approved for gene therapy and in our experiments promote cell toxicity. We demonstrate efficient uptake of the plasmid DNA by the tumour cells and further expression of the PMIS molecule in tumour cells by extracellular vesicle transfer. These results are highly significant, and we have shown the efficacy of our treatments compared to capecitabine treatments. We are currently working for approval of the use of PMIS plasmid DNA in the treatment of several diseases and tissue regeneration. This technology will greatly advance our use of RNA therapeutics.
5 CONCLUSIONS
The PMIS system to effectively inhibit aberrantly expressed miRs in cancer and other diseases offers an alternative therapeutic approach. The PMIS is specific with no off-target effects, stable and non-toxic to cells. It is easy to administer to tumours, efficacious and safe. Because of engineered PMIS stability, it can be packaged by cells into extracellular vesicles and transferred to other cells within the tumour to effectively inhibit miRs through the tumour. These are all properties lacking in current oligonucleotide therapies. The PMIS has great promise for gene therapy and can target any overexpressed miR in multiple cancers.
ACKNOWLEDGEMENTS
We thank the University of Iowa Imaging core, the Microscopy core for TEM and SEM images, and all the members of the Amendt, Hong, Cao and Qi laboratories for comments and ideas. We thank the University of Iowa Holden Cancer Center for advise on experiments.
CONFLICT OF INTEREST
Brad A. Amendt is the CSO of NaturemiRI, LLC. The remaining authors declare no conflict of interest.
Open Research
DATA AVAILABILITY STATEMENT
All data are available in the main text and RNA-seq data are available upon request. All PMIS constructs are available for research purposes.


