IL-15-induced CD38+HLA-DR+CD8+ T cells correlate with liver injury via NKG2D in chronic hepatitis B cirrhosis
Abstract
Objectives
CD8+ T cells play a critical role in the immune dysfunction associated with liver cirrhosis. CD38+HLA-DR+CD8+ T cells, or bystander-activated CD8+ T cells, are involved in tissue injury but their specific contribution to liver cirrhosis remains unclear. This study sought to identify the mechanism for CD38+HLA-DR+CD8+ T cell-mediated pathogenesis during liver cirrhosis.
Methods
The immunophenotype, antigen specificity, cytokine secretion and cytotoxicity-related indicators of CD38+HLA-DR+CD8+ T cells were determined using flow cytometry. The functional properties of these cells were assessed using transcriptome analysis. CD38+HLA-DR+CD8+ T-cell killing was detected using cytotoxicity and antibody-blocking assays.
Results
The proportion of CD38+HLA-DR+CD8+ T cells was significantly elevated in liver cirrhosis patients and correlated with tissue damage. Transcriptome analysis revealed that these cells had innate-like functional characteristics. This CD8+ T-cell population primarily consisted of effector memory T cells and produced a high level of cytotoxicity-related cytokines, granzyme B and perforin. IL-15 promoted CD38+HLA-DR+CD8+ T-cell activation and proliferation, inducing significant TCR-independent cytotoxicity mediated through NKG2D.
Conclusions
CD38+HLA-DR+CD8+ T cells correlated with cirrhosis-related liver injury and contributed to liver damage by signalling through NKG2D in a TCR-independent manner.
Introduction
The 2017 Global Burden of Disease report approximated that 1.32 million people die each year from liver cirrhosis and other chronic liver diseases.1 China has a high prevalence of liver cirrhosis with most cases caused by chronic viral hepatitis B. Sustained inflammatory responses are involved in driving the progression of cirrhosis.
CD8+ T cells play a critical role in liver cirrhosis-related pathogenesis. They are the primary effector cells of the adaptive immune response, essential for host immunity, pathogen clearance and self-tolerance.2 CD8+ T cells also exhibit innate-like, antigen-independent responsiveness, called bystander activation,3 and are pivotal in regulating hepatitis A, C, D and E virus infections and non-alcoholic steatohepatitis.4-7 Bystander-activated CD8+ T cells become activated by inflammatory cytokines and act independently of specific antigen recognition. Instead, they exhibit effector function in an innate-like manner, bypassing the need for TCR-dependent activation. Thus, CD8+ T cells are important during the early stages of infection or inflammation, before clonal expansion.8 These cells secrete effector molecules such as IFN-γ and granzyme B and express CD38, a cell surface protein involved in cyclic ADP ribose hydrolysis, signal transduction, cellular adhesion and calcium signalling. The co-expression of CD38 and HLA-DR on CD8+ T cells is a classic sign of cellular activation in response to viral infections.9, 10 CD38+HLA-DR+CD8+ T cells are the bystander-activated CD8+ T cells responsible for hepatitis-induced liver damage.4 Their murine homologues, CD38+MHC II+CD8+ T cells, also exhibit bystander activity.10
One of the major characteristics of bystander-activated CD8+ T cells is their ability to become activated in the absence of TCR signalling.11-16 The role of this T-cell population in the immune response has remained unclear. Some studies indicate they play an immune protective role against particular infections such as influenza A virus and herpes simplex virus 28, 17 and can improve the anti-tumor immune response.18 Bystander-activated CD8+ T cells are also associated with immunopathology and tissue damage in response to some conditions, including acute hepatitis A and Leishmania major,4, 19 and contribute to the progression of virus-induced neurological diseases. Inflammatory cytokines are the primary drivers of bystander-activated CD8+ T-cell proliferation. However, their function during chronic inflammatory conditions such as liver cirrhosis remains unclear.
This study investigated the activation status and function of CD8+ T cells during hepatitis B-related liver cirrhosis and the mechanism used to mediate host tissue damage. A total of 50 patients with hepatitis B cirrhosis (LC), 76 patients with chronic hepatitis B (CHB) without liver cirrhosis and 85 healthy volunteers were enrolled and peripheral blood and tissue samples were collected and analysed. CD38+HLA-DR+CD8+ T cells became activated and proliferated during LC and correlated with the degree of liver damage. RNA sequencing and experimental findings indicated that these cells had innate immune-like activity. IL-15 was shown to induce CD38+HLA-DR+CD8+ T-cell activation. Notably, these cells exhibited innate immune-like cytolytic activity and signalled through NKG2D in a TCR-independent manner. These findings suggest that IL-15-induced CD38+HLA-DR+CD8+ T cells trigger TCR-independent innate immune cytotoxicity by signalling through NKG2D during liver cirrhosis.
Results
CD8+ T cells associated with hepatitis B cirrhosis exhibit an altered phenotype
A total of 50 patients with hepatitis B cirrhosis, 76 with chronic hepatitis B without liver cirrhosis and 56 healthy subjects were enrolled in this study. To investigate changes in the CD8+ T-cell phenotype of patients with LC, markers for CD8+ T-cell subsets (CD45RA and CCR7), activation (CD38 and HLA-DR), immunosuppression (PD-1 and Tigit), cytotoxicity (perforin and granzyme B) and apoptosis were analysed in the HC, CHB and LC groups using flow cytometry. Representative FACS plots are shown in Supplementary figure 1. The proportion of CD8+ T cells was substantially lower in the LC group than in the HC group (Figure 1a).
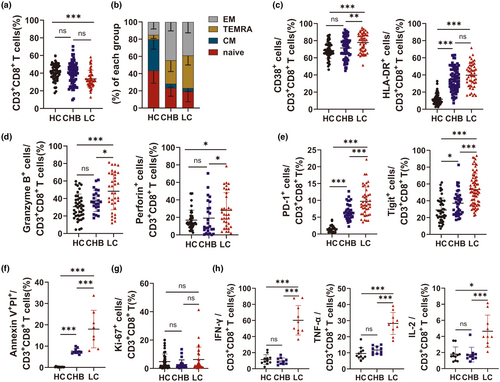
Based on the expression of CD45RA and CCR7, CD8+ T cells were divided into effector memory cells (EM; CD45RA−CCR7−), terminally differentiated effector memory cells (TEMRA; CD45R+CCR7−), central memory cells (CM; CD45RA−CCR7+) and naive cells (CD45RA+CCR7+). While CD8+ T cells in the LC and CHB groups were predominantly EM and TEMRA, the HC group was primarily composed of naïve CD8+ T cells (Figure 1b). CD8+ T cells in the LC group also had higher levels of CD38, HLA-DR, PD-1, Tigit, markers of apoptosis (surface staining) and granzyme B and perforin (intracellular staining), than those in the HC and CHB groups (Figure 1c–f). While not statistically significant, the expression of Ki-67, a marker of proliferation, was higher in CD8+ T cells from the LC patients than those from the HC and CHB patients (LC vs. CHB vs. HC: 6.28% vs. 2.73% vs. 4.82%) (Figure 1g). PMA-induced cytokine secretion from peripheral blood mononuclear cells (PBMCs) was assessed using intracellular staining. IFN-γ, TNF-α and IL-2 secretion were significantly higher in the LC group than in the HC and CHB groups. These findings collectively suggested that the LC group had a different CD8+ T-cell phenotype than the HC and CHB groups.
CD38+HLA-DR+CD8+ T cells correlate with hepatitis B cirrhosis-associated liver injury
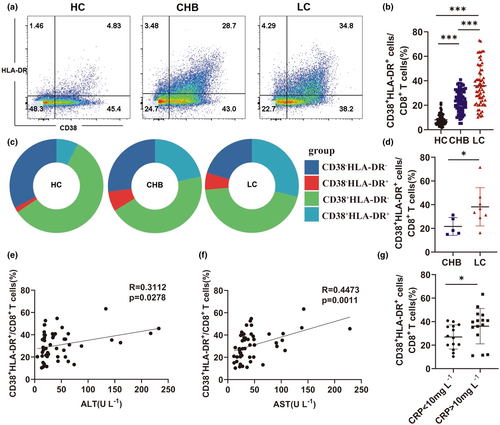
Since changes in the phenotype of CD8+ T cells correlated with their activation status in the LC group, flow cytometry was used to evaluate the levels of CD38+HLA-DR+CD8+ bystander-activated T cells,12-16 in the peripheral blood of patients from the LC, HC and CHB cohorts. The gating strategy of CD38+HLA-DR+CD8+ T cells is shown Supplementary figure 2. The proportion of CD38+HLA-DR+CD8+ T cells was significantly higher in the LC group than in the CHB and HC groups (HC vs. CHB vs. LC: 7.23% vs. 23.35% vs. 34.8%) (Figure 2a–c). Similarly, CD38+HLA-DR+CD8+ T-cell levels were significantly higher in the liver tissue of patients in the LC group than in the CHB group (Figure 2d). The relationship between CD38+HLA-DR+CD8+ T cells and liver injury was also investigated. There was a significant correlation between the proportion of CD38+HLA-DR+CD8+ T cells and the levels of serum ALT and AST (Figure 2e and f). An association between the percentage of CD38+HLA-DR+CD8+ T cells and inflammation was also assessed by evaluating C-reactive protein (CRP) levels. While a higher CD38+HLA-DR+CD8+ T-cell percentage correlated with abnormal CRP levels in the LC group (Figure 2g), there was no relationship between the proportion of CD38+HLA-DR+CD8+ T cells and ALP and gamma-glutamyl transferase (γ-GT) levels (Supplementary figure 3a, b). Meanwhile, the proportion of CD38+HLA-DR+CD8+ T cells correlated significantly with TBIL and albumin levels (Supplementary figure 3c, d). Consistent with prior studies, there was no correlation between HBV DNA and the proportion of CD38+HLA-DR+CD8+ T cells in patients with CHB and LC (Supplementary figure 3e, f).20 These findings demonstrated a relationship between the percentage of CD38+HLA-DR+CD8+ T cells and liver injury in patients with LC.
The CD38+HLA-DR+CD8+ T-cell population is composed of both HBV- and other virus-specific subsets
To determine whether the increase in CD38+HLA-DR+CD8+ T cells in patients with chronic hepatitis B-related cirrhosis was antigen-specific, HLA-A2-restricted pentamer staining was performed using flow cytometry. The proportion of HBV-specific cells in peripheral blood CD38+HLA-DR+CD8+ T cells from CHB and LC patients with CMV and EBV infections was evaluated (Figure 3a). FLPSDFFPSV(HBV) HLA-A*0201 Pentamer was used to assess the HBcAg18-27 epitope-specific.
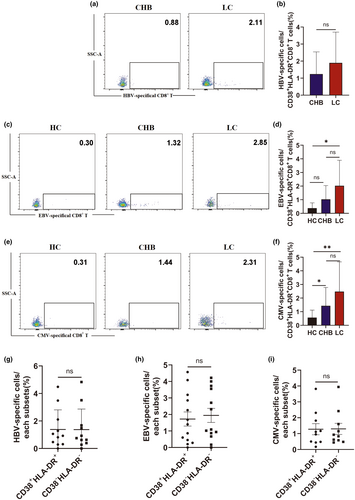
CD38+HLA-DR+CD8+ T-cell population and the gating strategy for these population is shown in Supplementary figure 4. While not statistically significant, the LC group had a higher proportion of HBcAg18-27 epitope-specific T cells than the CHB group (CHB vs. LC: 1.2% vs. 1.89%) (Figure 3b). The activation status of non-HBV virus-specific CD38+HLA-DR+CD8+ T cells, including EBV BMFL1 epitope or CMV pp65 epitope-specific T cells, was also assessed by flow cytometry (Figure 3c and e). CD38+HLA-DR+CD8+ T cells from the LC group included more EBV BMFL1 epitope-specific T cells (HC vs. CHB vs. LC: 0.38% vs. 1.03% vs. 2.03%) and CMV pp65 epitope-specific T cells (HC vs. CHB vs. LC: 0.57% vs.1.44% vs. 2.48%) than the HC and CHB groups; however, the increase compared to the CHB group was not statistically significant (Figure 3d and f). In addition, there was no significant difference between the HBV and other virus specificities of pentamer+CD38+HLA-DR+CD8+ and pentamer+CD38−HLA-DR−CD8+ T cells indicating that the increase in CD38+HLA-DR+CD8+ T cells in LC patients may not have a strong impact on the virus-specific CD8+ T-cell pool (Figure 3g–i). These findings suggest that both HBV- and other virus-specific CD8+ T cells develop an activated phenotype during LC.
Transcriptional analysis of CD38+HLA-DR+CD8+ and CD38−HLA-DR−CD8+ T cells in LC patients
A comparative analysis of transcriptome alterations was conducted to compare the functions of CD38+HLA-DR+CD8+ and CD38−HLA-DR−CD8+ T cells. These cells were sorted from the PBMC of LC patients and RNA seq analysis was performed using Annoroad Gene Technology (Beijing, China). The specific steps are described in the Methods. The transcriptional analysis identified 451 significantly differentially expressed genes (DEGs) between the paired CD38+HLA-DR+CD8+ and their corresponding CD38−HLA-DR−CD8+ T cells, of which 177 were upregulated and 274 were downregulated (Figure 4a). Further analysis revealed that CD38+HLA-DR+CD8+ T cells had a higher expression of activation markers (CD38, HLA-DR, CD74, CD156, FLNA, ITGAM, LEF1), exhaustion markers (TIM3), proliferation markers (MKI67) and effector molecules (PRF1, TGFB1, CD107a) than CD38−HLA-DR−CD8+ T cells. Notably, the transcriptional regulators, RUN3, TBX21 and EOMES, which regulate perforin and granzyme B secretion, were upregulated in CD38+HLA-DR+CD8+ T cells. Natural killer (NK) cell cytotoxicity genes, such as PRF1 and ITGAL, were also upregulated in CD38+HLA-DR+CD8+ T cells, which may provide them with innate immune function (Figure 4b upper panel). Cytokines and cytokine-related receptor genes, including TGFB1, TNFRSF1B and FASLG, were upregulated in CD38+HLA-DR+CD8+ T cells (Figure 4b middle panel). The higher expression of chemokines and related receptors such as CCR5 and CCL5 suggests that there may be enhanced migration of CD38+HLA-DR+CD8+ T cells to inflamed tissues (Figure 4b lower panel).
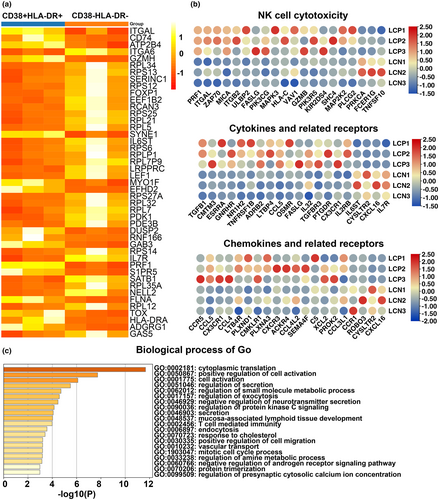
GO analysis identifies biological processes, cellular components and molecular functions. The current study only performed an enrichment analysis of the biological processes of CD38+HLA-DR+CD8+ and CD38−HLA-DR−CD8+ T cells. The CD38+HLA-DR+CD8+ T-cell population was primarily enriched in ‘positive regulation of cell activation’, ‘cell activation’, ‘regulation of secretion’, ‘secretion’, ‘regulation of exocytosis’ and ‘T cell-mediated immunity’ (Figure 4c). Given that the CD38+HLA-DR+CD8+ T-cell population exhibited a greater increase in activity and effector molecule expression than the CD38−HLA-DR−CD8+ T-cell population, subsequent experiments focused on assessing the effector function of CD38+HLA-DR+CD8+ T cells.
CD38+HLA-DR+CD8+ T-cell function in LC patients
CD38+HLA-DR+CD8+ T-cell function was assessed using flow cytometry. The complete gating strategy is shown in Supplementary figure 5. While most CD38+HLA-DR+CD8+ T cells were EM and TEMRA cells in the LC patients, a larger proportion were naïve in the HC group (Figure 5a and b). In addition, CD38+HLA-DR+CD8+ T cells in the LC patients expressed higher levels of Ki-67 and were more likely to undergo apoptosis than those in the HC group (Figure 5c and d). The expression of immunosuppressive markers, including PD-1 and Tigit, was also higher in CD38+HLA-DR+CD8+ T cells from the LC group than from the HC and CHB groups (Figure 5e).
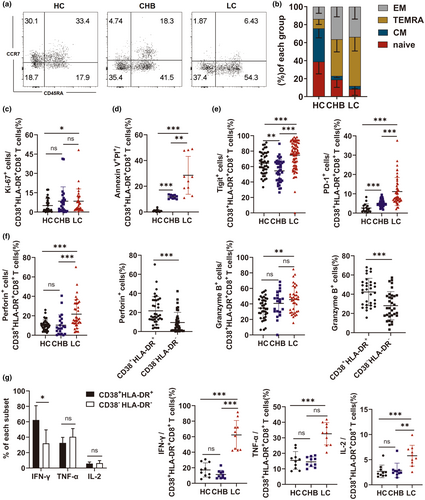
To further elucidate the functional attributes of CD38+HLA-DR+CD8+ T cell, the expression of cytotoxic molecules, including perforin, granzyme B, IFN-γ, IL-2 and TNF-α, was assessed by intracellular staining. CD38+HLA-DR+CD8+ T cells in the LC group had a significantly higher proportion of granzyme-B+ and perforin+ staining than those in the HC group. Within the LC group, the proportion of CD38+HLA-DR+CD8+ T cells expressing granzyme B and perforin was higher than the percentage of CD38−HLA-DR−CD8+ T cells (Figure 5f).
Following PMA stimulation of PBMCs, IFN-γ, TNF-α and IL-2 secretion was significantly higher in the LC group than in the HC group (Figure 5g). In addition, the CD38+HLA-DR+CD8+ T-cell population produced higher levels of IFN-γ than the CD38−HLA-DR−CD8+ T-cell population (Figure 5g). These findings indicate that most LC-associated CD38+HLA-DR+CD8+ T cells in this study were EM and TEMRA and secreted higher levels of cytotoxic-related cytokines.
IL-15 induces NKG2D expression on CD38+HLA-DR+CD8+ T cells
Cytokines in the inflammatory environment likely drive the antigen-independent activation of CD38+HLA-DR+CD8+ T cells during LC. To assess this, healthy human CD8+ T cells were treated in vitro with or without IL-2, IL-15, IL-18, or LPS for 1, 2 and 3 days and the proportion of CD38+HLA-DR+CD8+ T cells was determined. Increased CD38+HLA-DR+CD8+ T-cell levels correlated with longer periods of IL-15 stimulation (Figure 6a and b), suggesting that IL-15 is the primary cytokine driving CD8+ T-cell activation. However, IL-15 and IL-18 were not detected in plasma from LC patients, possibly because these individuals were no longer in the acute phase of inflammation. IL-2 also increased CD8+ T-cell activation, likely by stimulating T-cell proliferation. There were no differences in serum IL-2 levels in patients from the three cohorts.
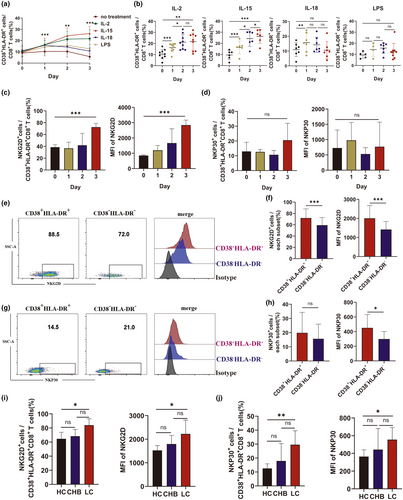
The RNAseq and phenotypic expression findings indicated that CD38+HLA-DR+CD8+ T cells exhibit innate immune-like functions. To further assess this, expression of the natural cytotoxicity receptors, NKG2D and NKp30, was determined in IL-15-stimulated CD38+HLA-DR+CD8+ T cells from HC patients. IL-15 increased the mean fluorescence intensity (MFI) and frequency of NKG2D but had no impact on NKp30 expression (Figure 6c and d). NKG2D and NKp30 expression were also assessed on CD38+HLA-DR+CD8+ and CD38−HLA-DR−CD8+ T cells from LC patients (Figure 6e and g). While there was no significant difference in the frequency of NKp30+ cells between the two groups, the proportion of NKG2D+ cells and the MFI of both NKG2D and NKp30 were higher on CD38+HLA-DR+CD8+ T cells than on CD38−HLA-DR−CD8+ T cells (Figure 6f and h). LC patients also expressed higher levels of NKG2D and NKp30 (Figure 6i and j). These findings suggest that IL-15 can induce NKG2D-dependent bystander activation of CD8+ T cells during LC.
NKG2D expression contributes to the TCR-independent cytotoxic function of bystander-activated CD8+ T cells
CD38+HLA-DR+CD8+ T cells from LC patients had an innate immune cell phenotype and overexpressed NKG2D, which mediates natural killer cell cytotoxicity. To determine whether IL-15-induced CD38+HLA-DR+CD8+ T cells from HC patients could trigger TCR-independent cytolytic activity, A CD8+ T cell-mediated cytotoxicity assay using K562 cells, a cell line lacking MHC-I expression, was conducted (Figure 7a). The complete gating strategy used to assess cytolytic activity is shown in Supplementary figure 6. The K562 cells were effectively lysed by IL-15-activated CD8+ T cells, suggesting that the CD38+HLA-DR+CD8+ T cells exhibited NK cell-like TC-independent killing activity (Figure 7b).
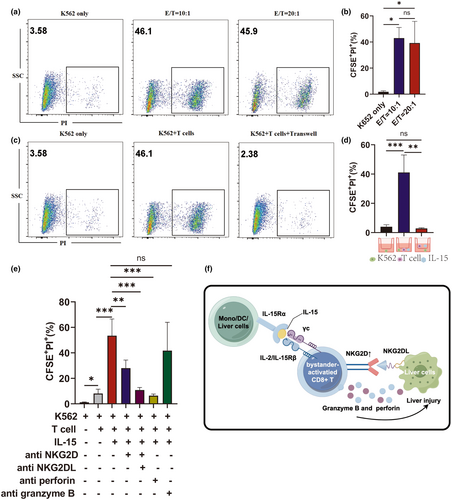
A 0.4-μm transwell plate, which allows cytokines to pass through while preventing the passage of cells, was used to determine whether CD38+HLA-DR+CD8+ T-cell cytotoxicity required direct cell-to-cell contact or soluble factors. Physical separation of the T cells and target cells abolished the cytotoxicity, indicating that CD38+HLA-DR+CD8+ T-cell killing activity depends on direct cell-to-cell contact (Figure 7c and d).
To identify the receptor responsible for the innate killing activity of IL-15-induced CD8+ T cells, the impact of different receptor-specific antibodies on the CD8+ T cell-mediated cytolysis of K562 cells was assessed. Anti-NKG2D, NKG2DL (ULBP-1; ULBP-3; ULBP-2/5/6; MICA/B) and anti-perforin antibodies all abrogated CD8+ T cell-mediated killing (Figure 7e). These findings indicate that IL-15-induced CD8+ T cells have natural cytotoxic effects that are likely mediated through NKG2D signalling.
Discussion
Adaptive immunity has been thought to depend on activated CD8+ T cell-mediated killing of target cells through TCR recognition of antigens presented by cell surface MHC-I molecules. The current study presents an alternative mechanism for CD8+ T-cell cytotoxicity independent of specific antigens and MHC-I expression. This is mediated by CD38+HLA-DR+CD8+ bystander-activated T cells, a T-cell subset involved in both the human and animal immune responses to infection.21 The role of these cells during infection, however, has remained controversial.22, 23 The current study investigated the function of CD38+HLA-DR+CD8+ T cells in patients with chronic HBV-related cirrhosis.24 The findings revealed that CD38+HLA-DR+CD8+ T cells, predominantly with an effector memory phenotype, were strongly associated with liver injury in LC patients. Notably, this cell population included CMV/EBV-specific CD8+ T cells characterised by the TCR-independent expression of cytotoxic molecules, NKG2D expression and perforin and granzyme production. IL-15 was shown to induce the activation and proliferation of these cells. Blocking experiments found that the cytotoxic activity of these bystander-activated CD8+ T cells was dependent on NKG2D and independent of TCR.
Cytokine-activated bystander T cells were first identified by Sprent et al. in 1996.13 Controversy about how these cells function is related to differences in the type of viral infection, the tissue-specific response, patient age and disease stage.4, 7, 8 Cytokine-mediated CD8+ T-cell activation appears to have both a positive and negative impact on the immune response. During the early stage of infection, these cells can effectively clear pathogens by secreting IFN-γ. However, they can also contribute to tissue damage through direct cytolysis of infected and uninfected target cells. CD38+HLA-DR+CD8+ bystander-activated T cells are also present in influenza-infected mice.10 The current study identified a significant correlation between the proliferation of CD38+HLA-DR+CD8+ T cells and the extent of LC-specific liver damage, suggesting that this cell type plays an immunopathological role in this condition.
IL-15 produced during acute viral infection may induce the upregulation of NKG2D expression and drive virus-specific CD8+ T-cell activation.25-27 IL-15-induced CD8+ T cells over-express NK receptors and exhibit TCR-independent cytotoxicity.26, 28 During HAV infection, non-HAV-specific bystander-activated CD8+ T cells with NKG2D-induced TCR-independent cytotoxic activity are associated with acute liver injury.4 The current study used RNA sequencing and in vitro experiments to show that bystander-activated CD8+ T cells could exhibit innate immune activity. Further experiments revealed that NKG2D expression was upregulated on bystander-activated CD8+ T cells from LC patients. A study of HEV type 3 (HEV-3) infection in older patients found that bystander-activated EM CD8+ T cells are IL-15 and IL-18 dependent and play a key role in HEV-3 pathogenesis.7 These results together suggest that bystander-activated CD8+ T cells may be involved in disease pathogenesis among patients with chronic HBV-related cirrhosis. However, compared to granzyme B and perforin, NKG2D had a limited inhibitory effect on these cells, indicating that CD8+ T cell-mediated cytotoxicity involves other mechanisms. A population of CD8+ T cells induced by IL-2 and IL-12 was recently identified in chronic hepatitis B patients that exhibited non-specific cytotoxicity via Fas/FasL signalling.29 FasL expression was also increased in this CD8+ T-cell population.24 Further studies are required to identify the role of Fas/FasL signalling in this innate immune process.
The in vitro experiments conducted here confirmed that IL-15 could activate CD38+HLA-DR+CD8+ T cells; however, IL-15 was not detected in the serum of LC patients. This may be because these patients were not in the acute phase of the disease. It is also possible that the localised production of IL-15 could not be detected on a systemic level. A similar phenomenon was demonstrated during HDV infection.30 While monocytes, dendritic cells, Kupffer cells and liver cells can all produce IL-15, further studies are needed to confirm the source during LC (Figure 7f).4, 31, 32
In summary, this study highlights the role that antigen-independent bystander-activated CD8+ T-cell subsets play during LC. After IL-15 stimulation, these CD38+HLA-DR+CD8+ T cells proliferate and signal through NKG2D to kill target cells and secrete perforin and granzyme. This process is TCR signalling-independent and ultimately results in liver injury. The findings highlight the importance of bystander-activated CD8+ T cells in the immunopathology of chronic infections. Future studies are needed to investigate whether these cells could serve as a target for liver cirrhosis treatment.
Methods
Patient recruitment and sample collection
A total of 50 LC patients and 76 chronic hepatitis B (CHB) patients were recruited from the Department of Cirrhosis Treatment Center at the Second Hospital of Nanjing, and 56 healthy volunteers were included as the healthy control group (HC). Diagnosis of LC was confirmed using histopathological diagnosis, clinical features and imaging. Clinical data were collected after participant inclusion (Table 1). Peripheral blood samples were obtained from the patients in each group. Liver tissue samples were taken from the CHB and LC groups by liver puncture. This study was approved by the Medical Ethical Committee at the Second Hospital of Nanjing, and all participants provided written informed consent in accordance with the Declaration of Helsinki (1964).
| CHB patients (n = 76) | LC patients (n = 50) | P | |
|---|---|---|---|
| Age (years) | 47.07 (41–54) | 50.93 (43.25–57.5) | > 0.05 |
| Sex (Male/total) | 45/76 | 33/50 | > 0.05 |
| HBV DNA (log10 IU mL−1) | 4.13 (3–5) | 4.5 (3–5.75) | > 0.05 |
| TBIL (μmol L−1) | 15.76 (7.8–18.33) | 70.29 (13.4–52.23) | < 0.0001 |
| ALB (g L−1) | 46.23 (39.65–49.48) | 35.51 (31.13–39.43) | < 0.0001 |
| ALT (U L−1) | 58.03 (19.7–61.3) | 46.45 (18–55.28) | > 0.05 |
| AST (U L−1) | 36.89 (17.2–38.1) | 47.24 (23.98–48.28) | 0.0023 |
| γ-GT (U L−1) | 46.12 (14.25–49.5) | 72.43 (18.25–73.75) | 0.0799 |
| ALP (U L−1) | 46.44 (58–98) | 111.18 (69–126) | 0.0045 |
| Leucocytes count(×109 L−1) | 6.46 (4.88–7.49) | 4.27 (3.27–5.16) | < 0.0001 |
| Lymphocytes (%) | 31.07 (25.3–36.5) | 26.21 (18.20–31.55) | 0.0107 |
| Monocytes (%) | 7.06 (5.1–7.6) | 9.34 (6.65–11.58) | 0.0002 |
| Neutrophils (%) | 58.92 (53.9–65.4) | 61.22 (55.35–70.13) | > 0.05 |
| Basophils (%) | 0.33 (0.2–0.4) | 0.52 (0.325–0.575) | 0.0002 |
- ALB, albumin; ALP, alkaline phosphatase; ALT, alanine aminotransferase; AST, aspartate aminotransferase; n, number of subject; TBIL, total bilirubin; γ-GT, γ-glutamyl transpeptidase.
- a Data are presented as median values (1st–3rd quartiles).
ALT and AST detection
Serum AST and ALT levels were determined using the enzymatic rate method according to International Federation of Clinical Chemistry recommendations (BS-820M, Mindray System-Mindray Diagnostics).33
Peripheral blood mononuclear and liver cell extraction
Whole blood was collected from each patient and the plasma was separated. PBMCs were isolated by Ficoll density gradient centrifugation (TBD, Tianjin, China) according to the manufacturer's instructions. Liver tissue was sliced into approximately 1-mm3 pieces, passed through 40-μm filters (BD Biosciences, New York, USA) and centrifuged at 400 g for 10 min to isolate hepatic mononuclear cells (HMNCs). The cells were washed twice with PBS (pH = 7.4) (Invitrogen, San Diego, USA) and resuspended in PBS supplemented with 1% foetal bovine serum (FBS) (Gibco, New York, USA).
Flow cytometry
Frozen PBMCs or HMNCs were thawed and stained with fluorochrome-conjugated antibodies at 4°C for 30 min. The cells were washed twice with 2 mL PBS (pH = 7.4) (Invitrogen) and centrifuged at 400 g for 5 min. Cell surface staining was conducted using the following antibodies: LIVE/DEAD Fixable Aqua Dead Cell Stain Kit (Invitrogen, CA, USA), anti-CD3 (PerCP-Cy5), anti-CD8 (PE-Cy7/FITC/APC-Cy7), anti-CD45 (FITC), anti-CD38 (APC), HLA-DR (eFluor450), anti-CD45RA (PE), anti-CCR7 (APC-Cy7), Ki67 (PE), anti-perforin (FITC), anti-granzyme B (PE), Tigit (PE), PD-1 (APC-Cy7), IFN-γ (PE), TNF-α (Qdot-655), IL-2 (PE-Cy7), anti-NKG2D (PE-Cy7) and anti-NKp30 (BV711). All antibodies were purchased from Thermo (CA, USA), BioLegend (San Diego, USA), Invitrogen, or BD Pharminge (San Diego, USA). The stained cells were evaluated using a FACS Aria III flow cytometer or a FACS Canto II cytometer (BD Bioscience), and data analysis was conducted using Flow Jo V10 software (Flow Jo LLC).
Before adding the IFN-γ (PE), TNF-α (Qdot-655) and IL-2 (PE-Cy7) antibodies to detect PBMC-specific intracellular cytokine production, the cells were incubated with 0.8 μL 250 × PMA (Multi Sciences, HangZhou, China) and 1 μL Golgi (BD Biosciences) in a 5% CO2 incubator at 37°C for 4 h. The cells were collected, washed twice with 1 mL PBS, and surface stained with LIVE/DEAD Fixable Aqua Dead Cell Stain Kit (Invitrogen), anti-CD3 (PerCP-Cy5.5), anti-CD8 (FITC), anti-CD38 (APC) and HLA-DR (eFluor450) at 4°C for 30 min. The cells were washed with 1 mL PBS, incubated with 250 μL fixed penetrant (BD Biosciences) at 4°C for 20 min and washed twice with 1 mL 1 × Perm/Wash Buffer (BD Biosciences). Intracellular labelling was then performed with anti-perforin (FITC) and anti-granzyme B (PE) using the same methods described above without PMA stimulation. The cells were then surface stained with anti-CD3 (PerCP-Cy5), anti-CD8 (PE-Cy7), anti-CD38 (APC) and HLA-DR (eFluor450) antibodies. The stained cells were evaluated using a FACS Aria III flow cytometer or a FACS Canto II cytometer (BD Bioscience), and data analysis was conducted using Flow Jo V10 software (Flow Jo LLC).
Virus-specific CD8+ T-cells from EBV/CMV IgG-positive patients were analysed using HLA-A*0201 restricted T-cell epitopes. HLA-A2-positive populations were screened with PE-labelled HLA-A2 (Thermo). HLA-A2-positive PBMCs were submitted to Nanjing Dahu Biotechnology for further analysis using PCR-SBT. The PBMCs from HLA-A*0201-positive patients were used for subsequent experiments. The cells were stained with antibodies against GLCTLVAML (EBV BMFL1259) HLA-A*0201 Pentamer, NLVPMVATV (CMV pp65495) HLA-A*0201 Pentamer and FLPSDFFPSV (HBVcAg18-27) HLA-A*0201 Pentamer at room temperature for 30 min, and then stained with specific antibodies against CD3, CD8, CD38 and HLA-DR at 4°C for 30 min. The pentamer antibodies were obtained from Proimmune. Flow cytometry was used to evaluate the virus-specific cells.
In vivo and in vitro cytokine production
Serum samples were collected from each patient and cytokine levels were determined using a human IL-15, IL-2, IL-18 ELISA Kit (Multi Sciences) according to the manufacturer's instructions. CD8+ T cells were separated from PBMCs using a CD8 microbead kit according to the manufacturer's instructions (Miltenyi Biote, Bergesch Gladbach, Germany). The cells were plated in 96-well plates at 5 × 10⁵ cells per 200 μL per well and stimulated with 10 ng mL−1 IL-2, 20 ng mL−1 IL-15 or 200 ng mL−1 IL-18. The plates were incubated in a 5% CO2 incubator at 37°C and the cells were collected on days 1, 2 and 3 after stimulation. LIVE/DEAD cell stain kit, anti-CD3 (PerCP-Cy5), anti-CD8 (APC-CY7), anti-CD38 (APC), HLA-DR (eFluor450), anti-NKG2D (PE-Cy7) and anti-NKP30 (BV711) antibodies were mixed with the cells and incubated at 4°C for 30 min. A total of 1 mL flow buffer was added to the cells and each sample was spun at 1000 g and washed twice for 5 min. All cells were evaluated using a FACS Aria III flow cytometer or a FACS Canto II cytometer (BD Bioscience). The data were analysed using Flow Jo V10 software (Flow Jo LLC).
RNA sequencing and bioinformatics
CD38+HLA-DR+CD8+ and CD38−HLA-DR−CD8+ T cells from the peripheral blood of LC patients were sorted using the Live+CD3+ cell gate on the FACS Aria III cell sorting system (BD Bioscience). Given the number of immune cells, the smart-seq2 method was used for RNA sequencing.34 RNA sequencing was performed by Annoroad Gene Technology (Beijing, China). In brief, the sorted cells were preserved in a solution containing cell lysate and RNase inhibitors. The amplified 1–2 kb cDNA fragments were obtained using the smart-seq2 method and purified using Beckman Ampure XP magnetic beads (CA, USA). The concentration and integrity of the amplified products were determined using a Qubit®3.0 Fluorometer (Life Technologies, CA, USA) and an Agilent 2100 High Sensitivity DNA Assay Kit (Agilent Technologies, CA, USA) respectively. Total cDNA (40 ng) was used to construct the library. The cDNA samples were sonicated using the Bioruptor Sonication System (Diagenode, Belgium) into approximately 350 bp fragments and subjected to end repair, 3′ end A-tailing and adapter ligation. The samples were purified after each step using Beckman Ampure XP magnetic beads (CA, USA). The adapter-ligated products were PCR amplified with unique index tags incorporated into each sample to facilitate differentiation. The amplified products were recovered using the Pippin HT automatic high-throughput fragment recovery system (Sage Science, CA, USA), purified using Beckman Ampure XP magnetic beads and eluted in EB buffer to generate the final library. The Agilent 2100/LabChip GX Touch (CA, USA) and Real-Time PCR system were used for quality inspection. The library was required to have a concentration of > 10 nmol L−1 for use in subsequent experiments and qualifying libraries were PE150 sequenced on an Illumina HiSeq platform (Illumina, CA, USA).
Raw reads were obtained after sequencing and the low-quality sequences and adaptors were removed to obtain clean reads. All subsequent analyses were based on the clean data. The data were mapped onto the reference genome sequence (Homo_sapiens.GRCh38.100.chr) using Bowtie v1.0.1 and the mapped reads of each sample were assembled using HISAT2 v2.1.0. StringTie 1.3.2d. Reference genes and genome annotation files were downloaded from the ENSEMBL website (http://www.ensembl.org/index.html). HTSeq was used to count the number of reads mapping to each gene and estimate the level of each gene. Fragments Per Kilobase Millon Mapped Reads (FPKM) represented the expression level of each gene. Read counts mapped to each gene were quantified and the expression levels of each gene were estimated using HTSeq (http://www-huber.embl.de/users/anders/HTSeq/doc/overview.html). DESeq2 software was used to identify differentially expressed genes (DEGs) with |fold changes (FC)| ≥ 1.5 and a corrected P-value (FDR) < 0.05. TBtools were used to map the heatmap.35 Analysis for Gene Ontology (GO) results were obtained using the ‘clusterProfiler’ package in R.
Cytotoxicity testing
CD8+ T cells isolated from the PBMCs of LC patients were used as effector cells for cytotoxicity testing. The target cells (K562) were centrifuged at 800 g for 5 min and pre-stained with 5(and 6)-carboxyfluorescein diacetate succinimidyl ester (CFSE). The cells were then resuspended in 1 mL PBS, mixed with 1 μL CellTrace CFSE stock solution in DMSO (Invitrogen), and incubated at room temperature for 20 min under light protection. Five times the volume of culture medium was added and the mixture was centrifuged at 800 g for 5 min. Finally, the cells were co-cultured with effector CD8+ T cells at a 10:1 effector target ratio.
To determine whether direct cell contact was required for effector cell function, a 24-well transwell chamber with 0.4 μm pore membranes was used. A total of 5 × 10⁴ CFSE-labelled K562 cells were added to the plates under the chamber, and 5 × 10⁵ IL-15 (PeproTech, Rocky Hill, USA)-stimulated healthy human CD8+ T cells were plated in the chamber. A control group without a transwell was also established and the two groups of cells were mixed and plated under the chamber. After 6 h, all cells were collected, labelled with PI at room temperature for 10 min and analysed by flow cytometry. CFSE+PI+ cells were defined to be dead cells.
Antibody blocking test
Isolated healthy human CD8+ T cells were incubated with 20 ng mL−1 IL-15 for 2 days. NKG2D monoclonal antibody (10 μg mL−1, 60 min) (Invitrogen), NKG2DL (ULBP-1, 300 ng mL−1, 60 min; ULBP-3, 2 μg mL−1, 60 min; ULBP-2/5/6, 1 μg mL−1, 60 min; MICA/B, 0.4 μg mL−1, 60 min) (bio-techne, Minnesota, USA), granzyme B inhibitor (Z-AAD-CMK) (44 μg mL-1, 120 min) (Sigma-Aldrich, Saint Louis, USA) or concanamycin A (87 μg mL-1, 120 min) (MCE, New Jersey, USA) was added and the cells were incubated at 37°C. These CD8+ T cells were used as effector cells for cytotoxicity testing.
Statistical analysis
Statistical analysis was performed using GraphPad Prism 9.0 software. The Mann–Whitney U-test or one-way ANOVA was used to compare different groups. Results were expressed as the mean ± standard deviation (SD). The Spearman correlation test was used for correlation analysis. A P-value < 0.05 was considered to be statistically significant.
Acknowledgments
This study was funded by the 333 Project of Jiangsu Province (Wei Ye), the Scientific research project of Jiangsu Provincial Health Commission (M2021074) (Wei Ye), the Medical Science and Technology Development Foundation, Nanjing Department of Health (grant numbers: YKK21119) (Jing Fan), the Talent Support Program of the Second Hospital of Nanjing (RCMS23001) (Jing Fan), Nanjing Infectious Disease Clinical Medical Center, Innovation center for infectious disease of Jiangsu Province (No. CXZX202232) (Wei Ye).
Author contributions
Jing Fan: Investigation; methodology; writing – review and editing. Min Xu: Methodology. Ke Liu: Resources. Wanping Yan: Formal analysis; resources. Huanyu Wu: Data curation; investigation. Hongliang Dong: Conceptualization; data curation; formal analysis. Yongfeng Yang: Writing – review and editing. Wei Ye: Conceptualization; funding acquisition.
Conflict of interest
The authors declare no conflict of interest.
Open Research
Data availability statement
The data that support the findings of this study are available from the corresponding author upon reasonable request.


