An Ex Situ Salinity Restoration Assessment Using Legume, Saltbush, and Grass in Australian Soil
Abstract
Shoot and root water content, shoot/root biomass ratio, and plant height were measured in Melilotus siculus (Fabaceae), Tecticornia pergranulata (Amaranthaceae: Chenopodiodeae), and Thinopyrum ponticum (Poaceae) to determine their growth performance in a glasshouse – pot trial using salinity levels of 0.0, 2.5, and 5.0 dS m−1. The following indices, total-ion accumulation (TIA), bioaccumulation factor (BF), translocation factor (TF), and bioconcentration factor (BCF) of Na+ and Cl− were also measured enabling the evaluation of the remediation capacity of these plants. With increasing salinity in soil, total Na+ and Cl− accumulation increased in the tested plants in the following order: T. pergranulata > M. siculus > T. ponticum. T. pergranulata had the maximal phytoextraction capacity of Na+ and Cl−. The BF and BCF values of Na+ and Cl− were >1 in the plants tested in different salinity treatments. The TF value of Cl− was >1 for these tested plants, whereas the TF value of Na+ was >1 in T. pergranulata and M. siculus and it <1 in T. ponticum. T. pergranulata and M. siculus performed the best, accumulating more of Na+ and Cl−, and therefore they appear to be the candidates-of-choice for phytoremediation of saline sites in central western New South Wales, Australia.
Abbreviations
-
- ANOVA
-
- analysis of variance
-
- BCF
-
- bioconcentration factor
-
- BF
-
- bioaccumulation factor
-
- DM
-
- dry mass
-
- EC
-
- electrical conductivity
-
- ECe
-
- electrical conductivity saturated paste extract
-
- FM
-
- fresh mass
-
- ICP-AES
-
- inductively coupled plasma atomic-emission spectroscopy
-
- RH
-
- relative humidity
-
- TF
-
- translocation factor
-
- TIA
-
- total-ion accumulation
-
- WC
-
- water content
1 Introduction
Soil salinity is a key threat to sustainable development of agriculture. Arable land, over time, turns saline due to either natural causes or mismanaged human activities such as ill-conceived water and land management practices. Nearly 7% of the world's arable land is affected by salinity 1. In Australia, ∼8% of the total land area is salinized (www.environment.gov.au/land/pressures/salinity/index.html) affecting agricultural production. One defining characteristic of salinized soil is the incidence of soluble salts in soil, beyond a threshold limit. Salinity reduces soil–water movement and bioavailable water 2 resulting in stressed plants and impaired performance. When severe, yields are affected because the productive land turns unproductive. Mitigation of salinity can reasonably restore the affected land suitable for cultivation. Several physical, chemical, and biological practices are recommended to remediate saline soil and to restore sustainability of affected landscapes 3. Among the methods used in remedying saline landscapes, phytoremediation, i.e., growing salt-tolerating plants in saline soils has proven to be a viable and eco-friendly remediation tactic 4. Phytoremediation is fulfilling when the plants are removed along with the sequestered salt, thus improving the chemical and biological quality of the soil. Through monitoring of changes in soil characteristics and plant growth during phytoremediation trials the effects of remediation become apparent.
Salt remediation using salt-tolerating and salt-accumulating plants builds on the principle that these plants survive and perform well in high-soil salinity levels 5. Melilotus siculus (Fabaceae), Tecticornia pergranulata (Amaranthaceae: Chenopodioideae), and Thinopyrum ponticum (Poaceae) are recognized salt-tolerating plants 6-8 and these generally show better growth performance than others belonging to same families. These are, therefore, seen as candidates of promise for phytoremediating saline soils. M. siculus has greater higher salinity-tolerance ability than the other known salt-tolerating legumes such as Trifolium michelanium (Fabaceae) and Medicago polymorpha (Fabaceae) 6. Enhanced root aeration and porosity enable M. siculus to tolerate both salinity and waterlogging 9, which is, incidentally, also useful as a forage species. T. pergranulata has high-tolerance capacity for both salinity and waterlogging 7. Different species of Tecticornia have been shown to sequester Na+ and Cl− in cell vacuoles, while the cytoplasm remains osmotically balanced with K+ and other compatible organic solutes 10. It is also useful as fodder material 11 and used in the revegetation of salt-affected agricultural lands in Australia 12. T. ponticum is one of the stronger salt-tolerating species among pasture grasses 13, 14. T. ponticum is also widely raised in saline land for soil conservation and salinity remediation 13. However, their phytoremediation of salinity has not been evaluated. In a previous field study it could be shown that T. ponticum is a promising salt accumulator 15 and in a simulated study T. pergranulata and M. siculus showed equally promising results 16.
Therefore, the purpose of this study was to evaluate the restoration capacity of M. siculus, T. pergranulata, and T. ponticum in saline soils. More specifically, we explored whether the chosen plants could be used in salt-remediation efforts. To verify their capability, we measured their: (i) growth performance applying various parameters and (ii) the levels of storage of salt-ions (e.g., Na+ and Cl−) in their shoot and root systems and their ion-translocation capacity against the phytoextraction indicators, such as total-ion accumulation (TIA), bioaccumulation (BF), translocation (TF), and bioconcentration (BCF) factors.
2 Materials and methods
2.1 The plant materials
Seeds of M. siculus were obtained from the South-Australian Research and Development Institute (Adelaide, South Australia). Certified seeds of T. pergranulata and T. ponticum were procured from established commercial outlets 16. The seeds of M. siculus, T. pergranulata, and T. ponticum were raised in garden soil in seed trays (21 × 18 × 0.2 cm3). The seeds of M. siculus were scarified by rubbing them gently in between pairs of emery-sheet pieces before sowing them in seed trays. The seed trays were moistened every day with 100 mL water. The seedlings of the three species, thus raised, were transplanted in pots filled with garden soil (details in Section 2.2), when plumules were 9 ± 2 cm long (M. siculus: 35 days, T. ponticum: 28 days, T. pergranulata: 110 days). The experiment was carried out in the glasshouse of Charles Sturt University (Orange, NSW) maintained at 23 ± 2°C, 60 ± 5% relative humidity (RH), under natural, ambient light conditions.
2.2 Treatments and experimental setup
Air-dried garden soil, a silty clay loam (sand: 15.8%, silt: 47.24%, clay: 36.96%, 17), ∼8 kg, sieved through a 4 mm mesh, and placed in polythene pots (30 cm Ø; 25 cm tall) set in the glasshouse. The soil was sieved through 2 mm mesh and the sieved material was used for physical and chemical analyses. The salinity level (electrical conductivity, EC1:5) was 230 μS cm−1 (water-suspension method, soil/water, 1:5 18). The pH was 5.9 (Digital pH Meter, Cyberscan 510pH, Eutech Instrument, Singapore). Field capacity was measured gravimetrically as 40.15%, following the method by Kelly and Rengasamy 19. Soil minerals including N (5010 mg kg−1), P (967 mg kg−1), K (2179 mg kg−1), Ca (3910 mg kg−1), Mg (839 mg kg−1), and Na (105 mg kg−1) were measured using inductively coupled plasma atomic-emission spectroscopy (ICP-AES, 710 ES, Varian 710 ES, California, USA) 15.
After 30 days of acclimation and establishment, from 13 individuals of each plant species, ten individuals of nearly similar dimensions of each species (T. ponticum: 20 cm; M. siculus: 10 cm inoculated with Sinorhizobium medicae (strain SRDI 554) after seed germination in seed trays; T. pergranulata: 12 cm) were used in assays. NaCl solutions (control: 0.02 dS m−1 (considered 0.0 dS m−1), 2.5 and 5.0 dS m−1) were constituted following Aref et al. 20. To minimize osmotic shock, especially to those seedlings intended to grow in 2.5 and 5.0 dS m−1 salt solutions, the seedlings were acclimatized by treating them with 1.0 dS m−1 solution for 48 h, followed by 2.0 dS m−1 solution on the day 3. Similarly, gradual acclimation of salt concentration was followed for the third category of seedlings intended for treatment with 5.0 dS m−1. Soil moisture was maintained at 80% of field capacity (345 mL H2O/kg soil) with distilled water in the trial pots throughout the experiment by weighing each pot every alternate day (Sartorius, Model # QA35EDE-S, Sartorius, Göttingen, Germany, accuracy: 0.5 g). After setting the soil-salinity treatment, this trial ran for 45 days.
2.3 Na+ and Cl− measurements of soil and plant samples
After 45 days, entire plants were harvested. Soil samples were collected from each pot and oven dried at 105°C, until they achieved a constant mass, and pulverized in a hand-held mortar. The pulverized samples were sieved using a 500 µm mesh (Endecotts, Laboratory Test Sieve, London, ISO 3310, 1:2000). For Na+ determination, subsamples (0.5 g) were digested in 10 mL HNO3 at 121°C until a colorless liquid resulted. After cooling, the solution was adjusted to 50 mL adding deionized water, rendering the sample ready for analysis in the ICP-AES. For Cl− determination, soil/water suspension, 1:5, was prepared and 10 mL aliquot was centrifuged at 3500 rpm (438g) for 3 min (Avanti Centrifuge, Model J-E, CAT NO 369001, Beckman Coulter, California, USA), and the supernatant was analyzed using an automated segmented flow analyzer (ALPKEM-OI Analytical, Washington, USA) following the method by Rayment and Higginson 18.
The harvested plants were hand-washed in slow running water to remove clay particles and other particulate soil contaminants. The washed plants were oven dried at 70°C, until they reached a constant mass, and ground in a motorized grinder (0.5 mm mesh screen, Glen Creston, Stanmore, Middlesex, UK). For determination of Na+, subsamples (0.25 g) were digested in 5 mL HNO3 at 70°C for 18 h. After cooling for 10 h in a fume hood, each subsample was adjusted to 25 mL by adding adequate volume of deionized water for analysis by ICP-AES. For Cl− determination, sub-samples (0.25 g) of plant samples were extracted with 25 mL of de-ionized water and 10 mL aliquot was centrifuged at 3500 rpm (438g) for 3 min, and the supernatant was analyzed using an automated segmented flow analyzer, following Liu 21.
2.4 Calculated parameters
 (1)
(1)Plant height (vertical distance from the ground line to the tip of the top leaf) was measured fortnightly for 45 days. After harvesting on day 45, dry mass of shoots and roots were measured after oven drying at 70°C until a constant mass was reached.
 (2)
(2) (3)
(3) (4)
(4) (5)
(5)2.5 Design and statistical analysis
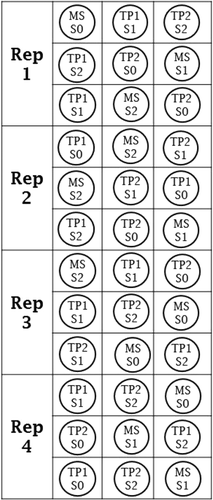
The experimental design was a randomized complete block design with four replicates (Fig. 1). Data were analyzed subjected to two-way analysis of variance (ANOVA) using GenStat® software. Plant height has been analyzed by repeated measures, incorporating in four times measurement. The line and bar graphs were generated in MS Excel 2013.
3 Results
3.1 WC
The WC in shoots was significantly different among the species (F2,16 = 59.41, p < 0.001): The mean WC was 80.60, 88.58, and 75.72 in the shoots of M. siculus, T. pergranulata and T. ponticum, respectively (Fig. 2a). Salinity stress and species interaction had significant effect on the root WC in the tested plants (F2,16 = 3.86, p < 0.05) (Fig. 2b). Root WC levels in the tested species were different depending on salinity levels.
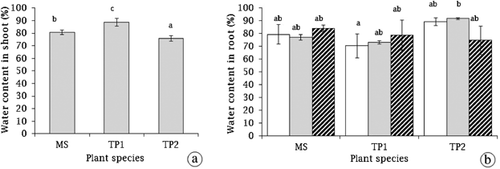
 ) 0 dS m−1, (
 ) 2.5 dS m−1, and (
 ) 5.0 dS m−1. Different letters indicate significant difference between species at Bonferroni at 5% level.
3.2 Shoot/root dry mass ratio
The shoot/root dry mass ratio was significantly different among species (F2,16 = 89.64, p < 0.001), although in T. ponticum no significant variation occurred during the three salinity treatments. Salinity stress had a significant effect on shoot/root dry-mass ratio (F2,16 = 10.46, p < 0.001) (Fig. 3). T. ponticum had a significantly lower shoot/root biomass ratio than M. siculus and T. pergranulata. The mean shoot/root dry mass ratio was 4.924, 4.486, and 1.036 in M. siculus, T. pergranulata, and T. ponticum, respectively. However, salinity and species interactions had no significant effect on shoot/root dry mass ratio (F2,16 = 2.68, p = 0.069) of the tested plants.
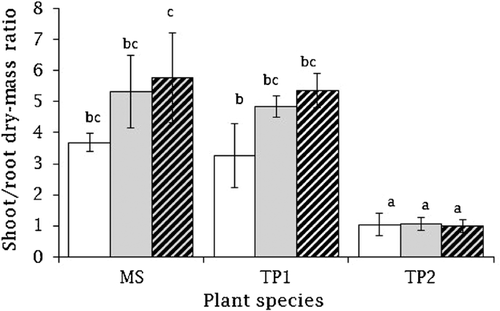
 ) 0 dS m−1, (
 ) 2.5 dS m−1, and (
 ) 5.0 dS m−1. Different letters indicate significant difference among the species at Bonferroni at 5% level.
3.3 Plant height
Plant height was significantly different among the species (F2,18 = 18.0, p < 0.001), salinity and species interactions (F4,18 = 18.0, p < 0.05), and with time (F3,54 = 54.0, p < 0.001) (Fig. 4). The greatest plant height occurred in M. siculus at 0.0 dS m−1 (control), in T. pergranulata at 5.0 dS m−1, and in T. ponticum at 2.5 dS m−1 treatments in 45 days (Fig. 4). A negative correlation occurred between ion concentration (e.g., Na+ (R2 = 0.143) and Cl− (R2 = 0.421)) in shoots and plant height of M. siculus. A positive correlation occurred between ion concentration (e.g., Na+ (R2 = 0.391) and Cl− (R2 = 0.257)) in shoots and plant height of T. pergranulata. No correlation occurred between ion concentration (e.g., Na+ (R2 = 0.000) and Cl− (R2 = 0.005)) in shoots and plant height of T. ponticum (Fig. 5).

 0.0 dS m−1,
  2.5 dS m−1, and
  5.0 dS m−1].
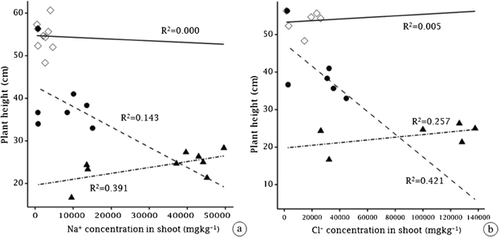
 M. siculus, (▴)
  T. pergranulata, (◊)
  T. ponticum].
3.4 TIA
Total Na+ accumulation in the tested plants was significantly different among species (F1,8 = 64.30, p < 0.01) and the effect of salinity (F1,8 = 12.37, p < 0.05) (Fig. 6a). Total Cl− accumulation in the tested plants was significantly different among species (F1,8 = 10.50, p < 0.05) and the effect of salinity (F1,8 = 70.05, p < 0.001) (Fig. 6b). Total Na+ and Cl− accumulation in the tested plants was in the following order: T. pergranulata > M. siculus > T. ponticum (Fig. 6a and b).
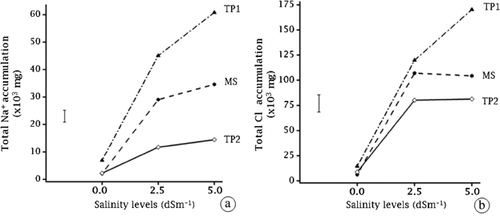
 Melilotus siculus (MS),
  Tecticornia pergranulata (TP1),
  Thinopyrum ponticum (TP2),
  standard error of difference].
3.5 BF, TF, and BCF
The BF values of Na+ in the tested plants were significantly different in species and salinity interaction (Tab. 1). In M. siculus and T. ponticum, the BF values of Na+ did not differ when tested at 0.0, 2.5, and 5.0 dS m−1 salinity treatments. However, the BF values of Na+ in T. pergranulata at control level were significantly greater than those of M. siculus and T. ponticum at control, 2.5 and 5.0 dS m−1 treatments (F1,8 = 4.53, p < 0.05). The BF values of Cl− in the tested plants were significantly different between species and salinity interaction (Tab. 1). On the contrary the BF values of Cl− in M. siculus and T. ponticum did not differ significantly at control, 2.5 and 5.0 dS m−1 treatments. The greatest BF value of Na+ (441.1 ± 19.3) and Cl− (1830.9 ± 356.9) occurred in T. pergranulata in control treatment, whereas the lowest of BF values of Na+ (9.4 ± 2.5) and Cl− (34.0 ± 17.7) occurred in T. ponticum at 5.0 dS m−1 treatment. The BF values of Na+ and Cl− were >1 in the tested plants. The BF values occurred in the following order: T. pergranulata > M. siculus > T. ponticum (Tab. 1).
| BF Na+ | BF Cl− | |||||
|---|---|---|---|---|---|---|
| MS | TP1 | TP2 | MS | TP1 | TP2 | |
| Salinity (dS m–1) | Mean ± SD | Mean ± SD | Mean ± SD | Mean ± SD | Mean ± SD | Mean ± SD |
| 0.0 | 22.1 ± 1.9a | 441.1 ± 19.3b | 18.4 ± 14.7a | 486.1 ± 373.2a | 1830.9 ± 356.9b | 214.3 ± 184.0a |
| 2.5 | 47.8 ± 1.0a | 223.5 ± 150.2ab | 17.2 ± 9.6a | 117.6 ± 30.6a | 429.1 ± 362.6a | 147.3 ± 20.3a |
| 5.0 | 4.3 ± 0.4a | 157.4 ± 73.5ab | 9.4 ± 2.5a | 45.0 ± 33.4a | 300.4 ± 95.9a | 34.0 ± 17.7a |
- n = 40 (n = 10 for each replication).
- SD, standard deviation.
- Different letters indicate significant difference between species at Bonferroni at 5% level.
The TF values of Na+ in the tested plants were significantly different between species and salinity interaction (Tab. 2). The TF values of Na+ in T. pergranulata at control treatment were significantly greater than the TF values of T. pergranulata at 2.5 and 5.0 dS m−1 treatments, M. siculus at control treatment, and T. ponticum at all of the three salinity treatments (F1,8 = 24.36, p < 0.01). The TF values of Cl− in the tested plants were significantly different between species and salinity interaction (Tab. 2). In M. siculus at 2.5 dS m−1 treatment the TF values of Cl− were significantly different from TF values of T. ponticum at three salinity treatments and the TF values of M. siculus at control and 5.0 dS m−1 treatments. The TF values of Cl− in T. pergranulata at control treatment was significantly different from those of T. ponticum at three salinity treatments (F1,8 = 15.57, p < 0.01). The highest TF value of Na+ (18.1 ± 2.1) occurred in T. pergranulata at control treatment and the highest that value of Cl− (24.6 ± 3.3) occurred in M. siculus at 2.5 dS m−1 treatments. On the contrary, the lowest TF value of Na+ (0.8 ± 0.3) and Cl− (1.7 ± 0.5) occurred in T. ponticum at 5.0 dS m−1 treatment. The TF value of Cl− was >1 in the tested plants. The TF value of Na+ was >1 in T. pergranulata and M. siculus, whereas it was <1 in T. ponticum. The TF values for Na+ occurred in the following order: T. pergranulata > M. siculus > T. ponticum and those of Cl− were as follows: M. siculus > T. pergranulata > T. ponticum.
| TF Na+ | TF Cl− | |||||
|---|---|---|---|---|---|---|
| MS | TP1 | TP2 | MS | TP1 | TP2 | |
| Salinity (dS m–1) | Mean ± SD | Mean ± SD | Mean ± SD | Mean ± SD | Mean ± SD | Mean ± SD |
| 0.0 | 1.8 ± 0.3a | 18.1 ± 2.1c | 1.0 ± 0.5a | 3.0 ± 0.4a | 20.2 ± 1.9bc | 1.7 ± 0.7a |
| 2.5 | 11.9 ± 3.5bc | 7.7 ± 2.5ab | 0.8 ± 0.1a | 24.6 ± 3.3c | 2.8 ± 4.4abc | 1.8 ± 0.0a |
| 5.0 | 7.1 ± 1.5bc | 6.8 ± 0.2ab | 0.8 ± 0.3a | 9.2 ± 5.1ab | 11.9 ± 1.0abc | 1.7 ± 0.5a |
- n = 40 (n = 10 for each replication).
- SD, standard deviation.
- Different letters indicate significant difference between species at Bonferroni at 5% level.
The BCF values of Na+ (F1,8 = 0.32, p = 0.860) and Cl− (F1,8 = 0.68, p = 0.623) were not significantly different due to salinity and species interaction. The highest BCF value of Na+ (34.0 ± 30.4) and Cl− (175.0 ± 106.1) occurred in T. pergranulata in 2.5 dS m−1 and control treatment, respectively. On the contrary, the lowest BCF value of Na+ (4.2 ± 1.5) and Cl− (4.6 ± 1.1) occurred in M. siculus at 2.5 and 5.0 dS m−1 treatments, respectively. The BCF value of Na+ and Cl− occurred >1 in the three tested plants (Tab. 3). The BCF values for Na+ was in the following order: T. pergranulata > T. ponticum > M. siculus and those of Cl− were as follows: T. pergranulata > M. siculus > T. ponticum.
| BCF Na+ | BCF Cl− | |||||
|---|---|---|---|---|---|---|
| MS | TP1 | TP2 | MS | TP1 | TP2 | |
| Salinity (dS m–1) | Mean ± SD | Mean ± SD | Mean ± SD | Mean ± SD | Mean ± SD | Mean ± SD |
| 0.0 | 12.5 ± 2.8ns | 24.5 ± 1.8ns | 17.6 ± 6.9ns | 133.3 ± 94.3ns | 175.0 ± 106.1ns | 112.0 ± 61.6ns |
| 2.5 | 4.2 ± 1.5ns | 34.0 ± 20.4ns | 22.1 ± 8.7ns | 4.7 ± 0.6ns | 41.0 ± 42.6ns | 82.8 ± 10.2ns |
| 5.0 | 4.5 ± 1.1ns | 23.3 ± 11.4ns | 11.4 ± 0.8ns | 4.6 ± 1.1ns | 25.7 ± 10.3ns | 19.2 ± 5.0ns |
- n = 40 (n = 10 for each replication).
- SD, standard deviation; ns, non significant.
4 Discussion
4.1 Growth performance of M. siculus, T. pergranulata, and T. ponticum in saline soils
Growth performance of M. siculus, T. pergranulata, and T. ponticum was evaluated measuring shoot and root WC, shoot/root biomass ratio, and plant height. Salinity-induced stress affects the hydraulic functions in plants leading to reduced water levels in leaves 25. The species tested in this study showed significant variation in water-content levels in shoots in the following order: T. pergranulata > M. siculus > T. ponticum. T. pergranulata − a succulent halophyte − showed the greatest WC, indicating that it is less vulnerable to osmotic changes and consequently ionic stresses caused by greater salt-ion accumulation. T. ponticum − a non-succulent salinity-tolerating grass − on the contrary, stores the least quantity of water in shoots among the tested plants. Another non-succulent salinity-tolerating grass, Urochondra setulosa (Poaceae) has been shown to maintain low-water levels in shoot tissues at 0–1000 mM (NaCl) salinity 26. The decline in WC in Poaceae with rise in salinity is driven by osmotic adjustment, because species of Poaceae generally store relatively low quantities of salt in shoot tissues with rising salinity 26.
In the present study, root WC was the greatest in T. ponticum and the lowest in T. pergranulata. Water as the medium mobilizes salts into cells from the external environment. T. pergranulata accumulates high quantities of salt in shoots, and also includes high volumes of water in shoots, whereas, T. ponticum accumulates more salt, especially Na+, in roots and includes greater volume of water in roots. Succulent halophytes, such as the saltbushes, regulate accumulation and sequestration of inorganic salts by adjusting osmotic potential of tissues in relation to external salinity. In Atriplex, for example, both K+ and Na+ enable osmotic adjustment in leaf tissue against low external-water potential. The osmotic adjustment arises by either low-soil moisture or high-soil salinity 27. K+ accumulates in response to low-soil moisture, whereas Na+ accumulates under high-salt conditions 27. Shoot tissues of saltbushes sequester salt in cell vacuoles via intracellular compartmentation of ions. Species of the erstwhile Chenopodiaceae bear higher levels glycine–betaine in shoot-cell cytoplasm, which acts as an osmoprotectant moderating and mitigating the damaging effects of rising salinity in vacuoles 27. Levels of glycine–betaine vary in plant organs: For example, in Beta vulgaris (Amaranthaceae: Chenopodiodeae) under drought stress, levels of glycine–betaine were greater in shoots and tap roots only, and the lateral roots lacked them 28. The greater level of water accumulation, consequently that of salt, in the shoots of T. pergranulata could be explained because of higher levels of the stress-neutralizing osmolyte glycine–betaine in shoots rather than roots.
In the trialled plants, shoot biomass always remained greater than that of roots. With increasing salinity (0.0–5.0 dS m−1), the shoot/root biomass ratio increased in T. pergranulata and M. siculus but not in T. ponticum. In T. pergranulata, shoot/root biomass ratio increased from 3.26:1 at 0.0 dS m−1 to 5.36:1 at 5.0 dS m−1. With increasing salinity (0–2% NaCl), the shoot/root biomass ratio increased in Atriplex patula (Amaranthaceae: Chenopodiodeae) from 4:1 (0.0% NaCl) to 27.1:1 (2.0% NaCl) 29. The shoot/root biomass ratio of M. siculus increased from 3.68:1 (0.0 dS m−1) to 5.77:1 (5.0 dS m−1), although Teakle et al. 30 reported a relatively stable (∼0.4) shoot/root ratio in M. siculus in stagnant water salinity (0–55 dS m−1 (electrical conductivity saturated paste extract, ECe) treatments, because under waterlogged condition M. siculus produces a highly porous cork tissues on roots 30. On the other hand, with rising salinity levels, the shoot/root biomass ratio of T. ponticum did not change significantly, which matches with the results found using Zea mays (Poaceae) at 0–10 dS m−1 (ECe) salinity 31.
In the present study, plant height increased in tested plants in 1–45 days. After 44 days of salinity treatment, maximum plant height occurred in M. siculus at 0.0 dS m−1 treatment, in T. pergranulata at 5.0 dS m−1 treatment, and in T. ponticum at 2.5 dS m−1 treatment. The correlation between plant height (on day 45) and ion concentration (e.g., Na+ and Cl−) in shoots was negative in M. siculus but positive in T. pergranulata. No correlation in T. ponticum however occurred. M. siculus is salt-tolerating, however, growth rate, especially measured in terms of height, decreased with increasing accumulation of Na+ and Cl− in shoot tissues 30. Storage of Na+ and Cl− in shoots beyond the threshold limit disrupts photosynthesis and other related metabolic processes 32 hampering plant growth eventually. Among the tested plants, the height of T. ponticum was not significantly affected in the treatments.
4.2 Assay of Na+ and Cl− storage in M. siculus, T. pergranulata, and T. ponticum against the nominated phytoextraction indicators
Salt-tolerating non-halophytes and halophytes that can store moderate to high levels of salts (e.g., Na+, Cl−) are the candidates-of-choice for reclamation of salinity-afflicted land 33. In the present study, total quantity of Na+ and Cl− stored in the tested plants was directly proportional to rising salinity levels (0–5 dS m−1) in soil. However, TIA occurred in the following order: T. pergranulata > M. siculus > T. ponticum. This result is consistent with our earlier study made at 0–6 dS m−1 salinity level, evaluating the physiology, and salt-ion accumulation capacity of plants raised ex situ 16.
Under salinity, different species of Tecticornia, can maintain the osmotic potential of cell sap more negatively than the external solution 10 because they accumulate salt in cell vacuoles thus generating a low-water potential 34. Whereas salt-tolerating glycophytes maintain low-osmotic potential in cells by lowering cell-WC by accumulating relatively low quantities of salt in cell vacuoles under saline conditions 26, 34. Between M. siculus and T. ponticum, the two glycophytes used in this study, M. siculus accumulated the maximal Na+ and Cl−, and T. ponticum maintained a relatively low concentration of Na+ and Cl− against a range of saline conditions. Dicotyledonous salt-tolerating plants generally accumulate more Na+ and Cl− in shoot tissues than monocotyledonous salt-tolerating plants, especially grasses. Because of low cell-vacuolar volume and leaf-WC, grasses do not absorb as much salt per unit of growth as dicotyledons do 35.
The efficiency of a plant as a remediator is high when the BF value remains >1 36. In the present study, BF values of trialled plants were >1. However with increasing salinity levels, the values decreased. In T. pergranulata, the BF value decreased from 441.1 ± 19.3 (at control) to 157.4 ± 73.5 (5.0 dS m−1) for Na+ and from 1830.9 ± 356.9 (control) to 300.4 ± 95.9 (5.0 dS m−1) for Cl−. Similar trends occurred in T. ponticum and M. siculus as well (Tab. 1). However, BF value in M. siculus for Na+ increased from 0.0 to 2.5 dS m−1 treatment, but decreased at 5.0 dS m−1. Similar Na+ accumulation trends have been reported in M. siculus in simulated settings 30, where Na+ accumulation raised up to 15 dS m−1 (ECe) and then declined until reaching 55 dS m−1 (ECe) salinity. With increasing salinity, in the present study, salt accumulation increased in T. pergranulata, M. siculus, and T. ponticum (Fig. 6), although the BF values decreased at high-salinity levels. Such a behavior of an enhanced capacity to sequester salts up to a point, a possible “threshold” point, and then declining with higher concentrations of salt appears to be a general pattern, since similar trends in performance values have also been known in Salicornia ramosissima (Amaranthaceae: Chenopodiodeae 37) and Azolla caroliniana (Azollaceae 38) under salinity treatments. Salt-tolerating plants adapt to salinity and perform by regulating salt uptake via the plasma membrane at a level that would least impair the cell and tissue capacity for vacuolar compartmentation 39. Under high-salinity condition, the physiology of vacuoles in plants is variously affected by differential osmotic pressures 39. The capacity to absorb salts in salt-tolerating plants decreases with rising salinity levels. Consequently, salt-accumulation capacity decreases with rising levels of salinity.
High root to shoot translocation rate (TF > 1) is another key strength of plants used in the phytoextraction of salts 40. In the present trial, TF values of Na+ were >1 in M. siculus and T. pergranulata, whereas the TF value of Na+ in T. ponticum was <1. These reinforce that M. siculus and T. pergranulata are suitable candidates for Na+ extraction. Since M. siculus and in T. pergranulata are salt-tolerating dicotyledons, they have a greater capacity than salt-tolerating monocotyledons to store Na+. Salt-tolerating monocotyledons, especially the salt-tolerating grasses, store Na+ for osmotic adjustment as shown in Leptochloa fusca (Poaceae 41) and in various species of Triglochin (Poaceae 42). Salt-tolerating Poaceae accumulate higher levels of Na+ in roots than in shoots (e.g., Sporobolous ioclados, Poaceae 43). The TF values of Cl− were >1 in M. siculus, T. pergranulata, and T. ponticum indicating that these plants efficiently extract Cl− ions. The TF values of Cl− remain greater than those of Na+ in the three tested plants. Cl− is an ion of higher mobility in plants 44, whereas Na+ moves slowly.
In the present study, BCF values of Na+ and Cl− were >1 in M. siculus, T. pergranulata, and T. ponticum in different salinity treatments. When the salts cannot move from roots to shoots, they get stored in the root system, resulting, in effect, in phytostabilization 45. Consequently TF values decrease and BCF values increase in plants. A plant with a BCF >1 and TF <1 is a reliable agent for use in phytostabilization efforts 24. T. ponticum is a suitable for stabilization for Na+. Plants with both BCF and TF >1 are usable in phytoextraction 24. Our results indicate that T. pergranulata and M. siculus are highly potent plants for phytoextraction of Na+ and Cl−, whereas T. ponticum could be used in extracting Cl−.
5 Concluding remarks
The plants used in this study could be used as candidates-of-choice in phytoremediation efforts of salinity-afflicted landscapes, due to their innate strengths: (i) ability to tolerate a wide gradient of salinity; (ii) ability to accumulate salt ions in component tissues; and (iii) their use of the aboveground biomass as animal feed. This study demonstrates that T. pergranulata accumulated the greatest and T. ponticum accumulated the least of Na+ and Cl− with increasing salinity (0–5 dS m−1). Factoring accumulation capacity measured as TIA, BF, TF, and BCF, the present study demonstrates that T. pergranulata and M. siculus accumulate greater levels of Na+ and Cl− in shoots than in roots, whereas T. ponticum accumulated greater Na+ in roots than in shoots. Our findings point to that among the tested plants, T. pergranulata, a saltbush, has the greatest potential for use as an environmentally friendly agent to phytoremediate in salinity contaminated land, followed by M. siculus.
Acknowledgment
We thank David Wade (Environmental & Analytical Laboratories, Charles Sturt University, Wagga Wagga, NSW) for providing ICP-AES facility for chemical analyses of plant and soil samples.
The authors have declared no conflicts of interest.


