Microbial Community Structures in Petroleum Contaminated Soils at an Oil Field, Hebei, China
Abstract
Petroleum hydrocarbons consisting of complicated mixtures of non-aqueous and hydrophobic components have raised a widespread environmental problem and influenced the subsurface microbial ecology. Three subsurface soil samples were collected at an oil field (Hebei, China) to investigate the microbial diversity patterns and their responds to different petroleum hydrocarbon contaminations by using 16S rRNA gene cloning analysis combined with multivariate statistical analysis. The results showed that bacterial clone libraries fell into 16 phylogenetic divisions and 184 operational taxonomic units. Gammaproteobacteria ubiquitously dominated in all samples, while the relative abundance was lowest in the sample with the highest total petroleum hydrocarbon concentration. Known petroleum degrading bacterial genera Alcanivorax, Stenotrophomonas, Pseudomonas, Pseudoxanthomonas, Sphingomonas, and Acidobacterium were abundantly observed, whereas their relative abundances differed greatly under a selection pressure by the complex hydrocarbons. For example, Alcanivorax spp. were the most abundant genera in polycyclic aromatic hydrocarbons and chlorinated hydrocarbons contaminated soils, while both Alcanivorax spp. and Stenotrophomonas spp. dominated in benzene, toluene, ethylbenzene, and xylenes contaminated soils. Additionally, a large fraction of bacterial clones were expectedly affiliated to some uncultured bacteria originated from several similar polluted ecosystems, and bacteria without certain petroleum degrading capacities. These observations indicated that microbial diversity, abundance and community were highly influenced by the concentrations of petroleum constituents in the contaminated soil ecosystems. Understanding the underlying factors that control the abundance of these heterotrophic microorganisms may be advantageous in the bioremediation of petroleum contaminated environments.
Abbreviations
-
- BTEX
-
- benzene, toluene, ethylbenzene, and xylene
-
- CCA
-
- canonical correspondence analysis
-
- CHC
-
- chlorinated hydrocarbon
-
- OTU
-
- operational taxonomic unit
-
- PAH
-
- polycyclic aromatic hydrocarbon
-
- PCB
-
- polychlorinated biphenyl
-
- PCR
-
- polymerase chain reaction
-
- SVOC
-
- semi-VOC
-
- TOC
-
- total organic carbon
-
- TPH
-
- total petroleum hydrocarbon
-
- UPGMA
-
- unweighted pair group method with arithmetic mean
-
- VOC
-
- volatile organic component
1 Introduction
Petroleum contamination, a widespread environmental problem in soils, sediments, and groundwater, which is mostly caused by anthropogenic activities, leakage of underground storage tanks and accidental spills during extraction, transportation, maintenance, and storage, occurs quite often and has been causing ecological impacts 1, 2. Petroleum hydrocarbons that consist of complicated mixtures of non-aqueous and hydrophobic components such as n-alkanes, aromatics, resins and asphaltenes are now raising a huge public concern, and threatening the soil ecosystems due to their toxicity, mutagenicity and carcinogenicity 3, 4.
Bioremediation of petroleum and derivatives in contaminated soils has been claimed to be the novel, environmental and cost-effective alternative compared to physicochemical treatment 5, 6. The efficiency of remediation highly depends on the degradation ability of the microorganisms 6, 7, the environmental conditions and the chemical structure of the petroleum hydrocarbons 8. Soil is considered to be the most microbially diverse environment on earth and 1 g of soil can contain up to 109 microbial cells, representing more than 10 000 genomes 9, 10. Oil-contaminated soil contains microbes that are capable of utilizing hydrocarbons as carbon source under both aerobic and anaerobic conditions 6. Traditional cultivation methods have been used to isolate bacteria involved in the degradation of petroleum hydrocarbons, but only the minority of petroleum degrading microorganisms in soil can be cultivated and a large number of microbes in oil-contaminated ecosystems remain unknown 11-14.
Several studies have focused on the analysis of microbial communities in the petroleum hydrocarbons or organic compounds contaminated soils, water, and sediments using DNA based technologies 1, 2, 14-16. At an oil-contaminated lagoon in France, sediment bacterial community structures were obviously associated with the gradient of oil contamination 1. A selection pressure was forced on these bacterial communities by the complex pollution constitutes, and oil degrading bacteria did not increase as oil contaminants increased. Conversely, in a study of microbial communities at an oil-contaminated site in China, more known hydrocarbon-degrading bacteria (e.g., Alcanivorax spp., Marinobacter spp., and Halomonas spp.) occurred in the contaminated soil as compared to the pristine soil 15. Although the culture-independent molecular studies provide a better understanding of microbial community composition than pure culture ones 16, how the structure varies under complex petroleum contamination gradients is still not fully unveiled, particularly in the subsurface soil ecosystems.
The bacterial diversities and communities of soil samples with different petroleum contaminants located at an oil field in Hebei, China, were investigated. After phylogenetic analysis of 16S rRNA gene sequences, taxonomic groups (e.g., phylum, family, and genus) of each sample exerted a huge difference. Multivariate statistical analysis between microbial communities and petroleum contaminated soil properties was conducted. These results may provide insights into the distribution of microbial communities with potential degrading capacities under complex petroleum hydrocarbon contamination.
2 Materials and methods
2.1 Sampling and physicochemical analysis
Soil samples were collected from locations adjacent to two crude oil pumping wells which were still working at an oil field in Hebei, China, in October, 2012. Oil extraction started in 1970s at this oil field, and it used to be one of the most productive oil fields in China. There was no vegetative cover on the sampling area. Oil contamination could be easily observed at the studied site, which exerted longtime influence to the local residents. Three soil samples (labeled WS_2, WS_4, and WS_6) were taken 0–40 cm below the surface (∼200 g in total) using a sterile scoop, sealed in sterile plastic bags, refrigerated with ice and brought to the lab. The spatial distance of these samples were <20 m. The samples for molecular analysis were stored in ultra-low temperature freezer (approximately −80°C) before DNA extraction. Microbial abundance was determined by acridine orange direct count (AODC) on black Nuclepore filters (0.2 µm) using an Olympus BHA epifluorescence microscope 17. pH, water content, NO3−–N, NO2−–N, NH4+–N, S, and total phosphorus (phosphorus in all organic and inorganic forms, total phosphorus) were measured according to the recommended standard method 18. Total petroleum hydrocarbon (TPH) was measured by following the method proposed by Tang et al. 19. Total organic carbon (TOC) was analyzed using TOC auto analyzer (TOC-V CPN, SHIMADZU). Volatile organic components (VOCs), semi-volatile organic components (SVOCs), and polychlorinated biphenyls (PCBs) in the collected soil samples were tested by GC/MS (Agilent 5973/6890). VOCs and SVOCs tests were conducted according to US EPA METHOD 524.2 and METHOD 8270C, respectively. PCBs were measured using US EPA METHOD 8082A. Above all, 55 VOCs, 89 SVOCs, and 24 PCBs were tested for all soil samples.
2.2 DNA extraction
Nucleic acids from the soil samples were extracted using Powersoil® DNA isolation kit (MP BIO, USA), according to producer's instructions. Extracted DNA was re-suspended in sterile, nuclease-free water (Promega, USA) and stored at −80°C for further analysis.
2.3 Polymerase chain reaction (PCR), cloning, and sequencing
The full-length 16S rRNA gene was sequenced via regular PCR, cloning and sequencing. The 16S rRNA gene was amplified from the extracted genomic DNA with the pair of primers 27F (5′-AGA GTT TGA TCM TGG CTC AG-3′, MC, or A) and 1492R (5′-TAC GGY TAC CTT GTT ACG ACT T-3′, YC, or T). PCR was performed with Applied Biosystem Gene Amp PCR system 9700. PCR products were purified using the EZ-10 spin column DNA Gel Extraction kit (BBI, Canada), quantified by Nanodrop (Nanodrop, USA), and ligated into the pGEM-T easy vector (Promega, USA). The resulting plasmids were transformed into Escherichia coli DH5α following the producer's instructions. Clones were randomly selected from the generated clone library. Instead of directly sequencing the clones, another round of PCR was carried out to verify the existence of the 16S rRNA gene in the plasmid of host cell (E. coli). Template DNA was provided by contact of a small pipette tip with a colony of cloned host cell. Primers for the PCR were the vector-specific T7 (5′-TAA TAC GAC TCA CTA TAG GGC-3′) and SP6 (5′-ATT TAG GTG ACA CTA TAG AAT ACT C-3′). The results of the in situ PCR can indicate the percentages of the chosen clones had inserted fragments of the correct size. Unique clones were sequenced by Shanghai Sangon, China.
2.4 Phylogenetic and statistical analysis
 (1)
(1)To determine the extent to which the separated samples share the common bacterial species, the species co-occurrence pattern was investigated among samples by Venn diagram using Mothur Program 20. Canonical correspondence analysis (CCA) was used to demonstrate the relation of contaminated soil properties versus each sample, and soil properties versus relative abundance of bacterial phyla. Unweighted pair group method with arithmetic mean (UPGMA) dendrograms using Bray–Curtis distance and Euclidean distance matrices were built within PAST software 3.07, to investigate if closer geochemical properties exerted closer bacterial community compositions.
2.5 Nucleotide sequence accession numbers
Sequences reported in this paper have been submitted to GenBank with accession numbers KC521625–KC522029.
3 Results
3.1 Geochemical and microbial characterization
Geochemical analysis of the samples (Table 1) revealed that TPH and TOC varied from 473.5 to 9538.34 mg/kg dry weight (dw) and 1.52 to 3.33%, and NO3−–N, NO2−–N, and NH4+–N remained low, indicating that the soils in the studied site were heavily contaminated by petroleum hydrocarbons and lacked inorganic nitrogen. pH ranged from 8.86 to 9.62. Lithological properties of soil samples were saline-alkali silty clay. The value of microbial abundance increased from 1.95 × 10⁹/g in WS_2 to 10.16 × 10⁹/g in WS_6. Through analysis of GC-MS, 9 of the 55 VOCs were detected in each soil sample, and of the 89 SVOCs 18, 14, 21 SVOCs were detected in WS_2, WS_4, and WS_6, respectively. Chlorinated hydrocarbons (CHCs), benzene, toluene, ethylbenzene, and xylenes (BTEX) and polycyclic aromatic hydrocarbons (PAHs) were apparently detected. Other SVOCs including several by-products of petroleum hydrocarbons like amines, resins, and nitroaromatic compounds, etc., were also found, with highest total concentration occurring in WS_6 and lowest total concentration occurring in WS_2. Thus, we could clearly distinguish the different petroleum and organic contaminations among soils.
| Parameter | WS_2 | WS_4 | WS_6 | Parameter | WS_2 | WS_4 | WS_6 |
|---|---|---|---|---|---|---|---|
| pH | 9.08 ± 0.12 | 8.86 ± 0.32 | 9.62 ± 0.41 | Trichloroethene (µg/kg) | 2.47 | 2.64 | 2.45 |
| Water content (%) | 14.09 ± 3.22 | 16.41 ± 1.21 | 12.52 ± 1.43 | Ethylbenzene (µg/kg) | 0.79 | 0.94 | 0.94 |
| S (mg/kg) | 34.5 ± 0.2 | 30.7 ± 0.8 | 27.9 ± 1.3 | m- + p-Xylene (µg/kg) | 1.58 | 1.98 | 1.68 |
| NO3−–N (mg/kg) | 0.21 ± 0.01 | 1.22 ± 0.05 | 0.74 ± 0.10 | o-Xylene (µg/kg) | 0.91 | 1.05 | 1.04 |
| NO2−–N (mg/kg) | ND | ND | ND | 2-Chlorotoluene (µg/kg) | ND | ND | 0.64 |
| NH4+–N (mg/kg) | ND | ND | ND | 1,3-Dichlorobenzene (µg/kg) | 35.5 | 17.8 | ND |
| TPH (mg/kg) | 473.50 ± 34.32 | 3878.75 ± 75.32 | 9538.34 ± 114.23 | 1,4-Dichlorobenzene (µg/kg) | 32.9 | ND | ND |
| TOC (%) | 1.52 ± 0.02 | 2.43 ± 0.05 | 3.33 ± 0.06 | 1,2-Dichlorobenzene (µg/kg) | 37.5 | ND | ND |
| TP (mg/kg) | 836.43 ± 11.23 | 762.79 ± 9.12 | 668.99 ± 28.32 | Naphthalene (µg/kg) | 44.5 | 56.4 | 33.6 |
| Microbial abundance (109/g) | 1.95 ± 0.15 | 6.2 ± 0.59 | 10.16 ± 1.02 | Fluorene (µg/kg) | 58.6 | ND | 162.1 |
| Benzene (µg/kg) | 0.62 | 0.65 | ND | Phenanthrene (µg/kg) | 237.1 | ND | 86.6 |
| Toluene (µg/kg) | 3.50 | 4.74 | 4.52 | Anthracene (µg/kg) | 293 | ND | ND |
| Methylene chloride (µg/kg) | 58.7 | 71.9 | 64.3 | Pyrene (µg/kg) | 104.2 | ND | 27.5 |
| Chloroform (µg/kg) | 13.1 | 14.2 | 12.0 | Benzo[a]anthracene (µg/kg) | ND | 11.9 | ND |
| 1,2-Dichloroethane (µg/kg) | 6.89 | 8.87 | 9.53 | Chrysene (µg/kg) | ND | ND | 14.3 |
- ND, not detected; TP, total phosphorus.
- Values represent mean ± standard deviation.
3.2 Analysis of the bacterial 16S rRNA gene clone libraries
After the removal of several chimeric sequences, 130, 129, and 135 valid sequences (1450 bp in length) were used to construct bacterial clone libraries for WS_2, WS_4, and WS_6, respectively. Diversity rarefaction curves of the libraries slightly reached a stable trend (data not shown). The coverage rates of the clone libraries were all >60%. The number of OTUs ranged from 66 to 74. WS_6 was more diverse than the other two samples, because of the highest Shannon index (4.04) and lowest Simpson index (0.024). All of the dominant indexes of the three clone libraries were low, and for WS_6 was lower than for the other two samples, implying the evenness index of bacterial groups in WS_6 was the highest and it would be comparatively difficult to find a dominant species (Table 2).
| Clone library | Total clones | Number of OTUs | Coverage | Shannon (H) | Simpson | Chao-1 | Dominance |
|---|---|---|---|---|---|---|---|
| WS_2 | 130 | 66 | 0.63 | 3.66 | 0.053 | 191.3 | 0.13 |
| WS_4 | 129 | 66 | 0.60 | 3.60 | 0.054 | 198.6 | 0.14 |
| WS_6 | 135 | 74 | 0.66 | 4.04 | 0.024 | 131.5 | 0.06 |
3.3 Phylogenetic analysis of bacterial sequences
The 16S rRNA gene sequences of all three bacterial libraries fell into 16 phylogenetic divisions (Fig. 1): Gammaproteobacteria, Alphaproteobacteria, Betaprotebacteria, Deltaproteobacteria, Bacteroidetes, Acidobacteria, Actinobateria, Deinococcus-Thermus, Verrucomicrobia, Planctomycetes, TM7, OD1, Nitrospira, Armatimonades, Gemmatimonadetes and Chloroflexi, and WS_2, WS_4, WS_6 fell into 14, 12, and 9 bacterial divisions, respectively. Gammaproteobacteria, Alphaproteobacteria, Bacteroidetes, and Verrucomicrobia were ubiquitous in all three samples. Betaprotebacteria, Acidobacteria, and Actinobateria also took up huge proportions in some libraries.
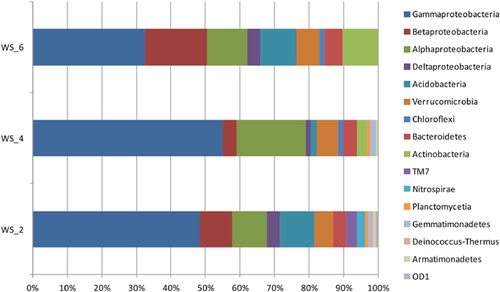
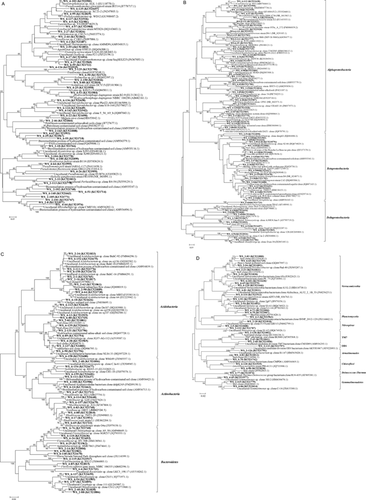
Gammaproteobacteria was the most abundant group in all three bacterial 16S rRNA gene libraries, which accounted for 48.5, 55.0, and 32.6%, respectively (Fig. 1). Most of the sequences in Gammaproteobacteria were affiliated to the clones that were isolated from similar contaminated ecosystems, and they were affiliated to Alcanivoracaceae, Xanthomonadaceae, and Pseudomonadaceae-like organisms, whereas remarkable difference could be observed among samples (Fig. 2A). Alphaproteobacteria was the second dominant group in WS_2 (10.0%) and WS_4 (20.2%), and the third predominant group in WS-6 (11.9%) (Fig. 1). Clones in Alphaproteobacteria were mainly affiliated to Rhodospirillaceae, Caulobacteraceae, Sphingomonadaceae, and Erythrobacteraceae, and their abundances in each sample were also dramatically different. Betaproteobacteria was the second abundant group in WS_6 (17.8%) and the fourth predominant group in WS_2 (9.2%), while only 3.9% of WS_4 were from this subphylum (Fig. 1). Clones clustered to Rhodocyclaceae and Comamonadaceae were the main components of Betaproteobacteria (Fig. 2B). The OTUs from Deltaproteobacteria were not abundantly observed (3.8, 1.6, and 3.7% for WS_2, WS_4, and WS_6, respectively). Clones related to the family Nannocystineae composed the biggest family group in this subphylum. Acidobacteria was one of the most significant bacterial groups in WS_2 and WS_6, representing 10.0 and 10.4%, respectively, whereas barely occurring in WS_4 (1.6%) (Fig. 1). Actinobacteria (10.4%) and Bacteroidetes (5.2%) were two of the main components in WS_6. However, both of them were taking minor proportions in WS_2 (0.0 and 3.8%) and WS_4 (3.1 and 3.9%) (Fig. 1). Verrucomicrobia was ubiquitous in all three libraries, representing 5.4, 6.2, and 6.7% for WS_2, WS_4, and WS_6, respectively (Fig. 1). Isolation sources of clones from other minor phyla were mostly similar to hydrocarbon contaminated sites (Fig. 2D).
3.4 Statistical analysis
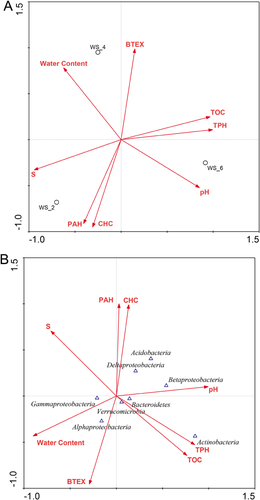
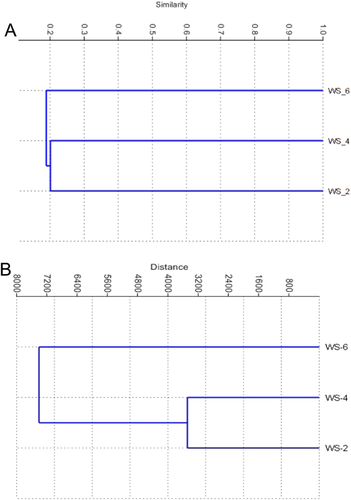
The soil samples had different physicochemical characteristics (Table 1). WS_2 was mainly contaminated by CHCs and PAHs (Fig. 3A). WS_4 was primarily polluted by BTEX. TPH and TOC were highest in WS_6. For each dominant bacterial group (phylum-level), the main controlling factors were different. For instance, Betaproteobacteria was better controlled by pH than other parameters, while Actinobateria was controlled by TPH and TOC (Fig. 3B). UPGMA cluster analysis was conducted to compare the community structures by calculating Bray–Curtis distance. It was found that WS_2 was closer to WS_4 than WS_6 which contained the most TPH and TOC (Fig. 4A). Similar results could be obtained through comparison of their physicochemical characteristics by calculating Euclidean distance (Fig. 4B). Total shared richness (OTUs) of all samples was 4, and were 5, 10, and 11 between WS_2 and WS_4, WS_2 and WS_6, and WS_4 and WS_6, respectively.
4 Discussion
In this study, microbial communities in soils and their relationships with the petroleum contaminants at an oil field in Hebei, China, were investigated. The potential indicators for soil bioremediation, particularly in oil spills and similar crises were explored. The microbial diversity indexes (Shannon (H)) of WS_2 (3.66), WS_4 (3.60) and WS_6 (4.0) of studied samples were close to those of the oil hydrocarbon contaminated soils at Thuringia, Germany (3.782 to 3.925) 21, but aged petroleum contaminated soil showed lower index (1.45) 22. Although the spatial distance between each sampled locations was close (<20 m), their physicochemical characteristics were comparably different (Table 1). Microbial diversity was correlated with pH in many soil types 23. pH generally reached its peak in soils near neutral, and was negatively correlated with diversity index when pH>8 24, 25. However, highest diversity occurred in the sample with highest pH (9.62) in the present study. Biodiversity was reported to be negatively affected by petroleum contamination in many environments 26, 27, whereas these results showed a completely opposite trend. Shannon index and microbial abundance reached highest as TPH increased. The abundance of petroleum hydrocarbons can enhance the diversity of heterotrophic microorganisms which use petroleum hydrocarbon as carbon source.
A great number of 16S rRNA gene sequences of the clone libraries exhibited high similarity (>95%) to some unexplored microorganisms originating from several similar polluted ecosystems, including groundwater contaminated by trichloroethene and cis-dichloroethylene, soils and aquifer contaminated by hydrocarbons, and soils contaminated by heavy oil, petroleum, gasoline, and creosote (Fig. 2). This phenomenon is commonly observed in many petroleum contaminated ecosystems 1, 13, 14, 16. These microbes could adapt to various petroleum and organic contaminated ecosystems, and had the potential capacity of degrading such contaminants. In addition to unexplored potential degraders, well-studied petroleum degrading bacteria diversely occurred in all samples, but exerted different distributions. In a study of oil polluted site, microbial communities were well driven by the hydrocarbon contamination level 1. Interestingly, heavier hydrocarbon contamination did not induce an increase of oil-degrading bacteria. The distributions of microbial community structures could mainly result from the environmental heterogeneity (Fig. 3), which was confirmed by the UPGMA cluster analysis (Fig. 4). Microbial communities in two samples with closer geochemical characteristics clustered together.
Proteobacteria, which was commonly associated with hydrocarbon degradation, was always abundantly observed in petroleum contaminated soil and sediment environments 15, 26, 28, 29. Gammaproteobacteria was commonly reported to be the predominant group in hydrocarbon-contaminated soils 13, 21. In the present study, Gammaproteobacteria constituted the largest group in all soil samples, but was less dominant in the sample with highest TPH (9538.34 mg/kg) (Fig. 1), which is consistent to Liu et al. 15. Two of the most abundant sequence types in WS_2 library, representing 16.9 and 10.8%, formed subdivisions with Alcanivorax species and the clones from family Alcanivoracaceae isolated from hydrocarbon contaminated soil. In WS_4, whose TPH was between WS_2 and WS_6, the dominant groups were Alcanivorax and Stenotrophomonas. However, both of them were rarely found in WS_6. Alcanivorax, a marine hydrocarbonoclastic bacterium, could become the predominant microbe in oil-contaminated open oceans, coastal waters 30, or some halophilic environments 31. The growth of Alcanivorax could be promoted by the addition of nitrogen and phosphorus fertilizers 32, 33. Several field studies have demonstrated the immense importance of Alcanivorax in oil-spill bioremediation 30, 32, 33. Alcanivorax borkumensis is able to degrade alkanes up to C32, branched aliphatic hydrocarbons, isoprenoid hydrocarbons such as phytane, as well as alkylarenes and alkylcycloalkanes, and can grow on oligotrophic environments 34. These findings highlight the critical role of Alcanivorax playing in natural remediation of oil-polluted marine systems. In a hydrocarbon contaminated soil, Alcanivorax was also abundantly observed, along with Marinobacter and Halomonas 15. Because WS_2 was mainly contaminated by PAHs and CHCs, the abundance of Alcanivorax could serve as a potential degrader for such contaminants. Nonetheless, as the relative abundance of Alcanivorax decreased as TPH increased, its abundance might be restricted by high concentrations of petroleum hydrocarbons. Stenotrophomonas was only found in WS_4 which had the highest BTEX concentration (9.36 µg/kg). Stenotrophomonas spp. were also able to degrade hydrocarbons like PAHs 35, 36. Besides, Pseudoxanthomonas, which was capable of degrading petroleum hydrocarbon compounds like BTEX and PAHs 37, 38, did not exist in the lowest petroleum contaminated sample (TPH = 473.5 mg/kg). OTUs formed clusters to well-studied hydrocarbon degrading bacteria Pseudomonas spp. 21, 29 and Hydrocarboniphaga daqingensis 40 were widespread in all three samples, and their highest abundance occurred in WS_2. Species from Pseudomonas spp. that was able to degrade alkanes, PAHs, polychlorinated biphenyls and other oil hydrocarbons had already been widely applied for the bioremediation of oil-contaminated sites 21, 39.
Alphaproteobacteria was supposed to be correlated with BTEX concentration in soil samples (Fig. 3B). Few researches have reported the degradation ability of Alphaproteobacteria, the major bacteria found in our samples including Dongia. Nevertheless, Sphingomonas from Sphingomonadaceae, which was observed in all libraries, has been reported to be a degrader of organic contamination 41, 42. The most dominant clone from Betaprotebacteria was isolated from gasoline contaminated ecosystem. This subphylum constituted more parts in WS_6 than in the other ones with lower TPH (representing 6.7, 2.3, and 1.6% for WS_6, WS_2, and WS_4, respectively). In addition to Proteobacteria, bacteria from other phyla also constituted huge components of the soil samples. Acidobacterium spp. occurring in WS_2 and WS_6 were able to utilize several organic matters as carbon sources such as methyl-tert-butyl ether 43. Kasai et al. reported that the amount of clones related to Bacteroidetes in petroleum contaminated soil (TPH = 12 000 mg/kg) was higher than that in the uncontaminated soil 44, which was confirmed in our result. The Bacteroidetes and Actinobacteria were two of the most significant groups in the sample with highest TPH, but rarely found in less contaminated samples. The distributions of these two phyla were mainly affected by TPH and TOC (Fig. 3B). Some bacteria genera found in these two phyla (e.g., Arthrobacter, Rhodococcus, Flavobacterium, Cytophaga) had been reported to be able to degrade petroleum hydrocarbons 45-48.
5 Concluding remarks
Microbial diversities, abundances and community structures differed with the gradients of petroleum contamination. Gammaproteobacteria ubiquitously dominated in all samples, while the relative abundance was lowest in the highest TPH contaminated sample. The most dominant OTU in this sample was affiliated to an uncultured bacteria isolated from similar contaminated ecosystem, demonstrating that several significant petroleum degrading microbes were still unknown. Alcanivorax was predominant in the PAHs and CHCs-contaminated soil but TPH was the lowest. Both Alcanivorax and Stenotrophomonas were predominant in highest BTEX-contaminated soil. The potential biodegraders of petroleum contaminated subsurface soils were expected to be found within genera Alcanivorax, Stenotrophomonas, Pseudomonas, Pseudoxanthomonas, Sphingomonas, Hydrocarboniphaga, Acidobacterium, etc. There is a potential relationship between petroleum constituents (e.g., TPH, CHC, BTEX, and PAH) and specific bacterial taxa. Although more biological replicates and sufficient samples will be required, the respond of bacterial community profiles to the complex petroleum contaminants was performed in the present study. Future work should emphasize on exploring the degrading capacities of these heterotrophic bacteria for the bioremediation of petroleum contamination.
Acknowledgments
This research was supported by grants from Fundamental Research Funds for the Central Universities (2652013136) and the China Scholarship Council.
The authors have declared no conflict of interest.


