Abstract
To investigate the mechanical processes of Li-ion battery recycling in more detail, models for the different unit processes are to be developed. Here, model approaches for the cutting mill and the zig-zag-sifter are presented. These models are to be used in dynamic flow sheet simulations, with which the individual unit processes as well as the combination to a small process chain were simulated. Thereby, the dynamic interactions between the process steps were investigated, which can be used later for optimization and regulation of the processes. The particle sizes after the cutting mill process as well as the mass flow between the processes influence the separation behavior of the sifter. These changes in the separation function due to an increasing mass flow out of the mill are shown.
1 Introduction
The field of battery recycling is becoming increasingly important especially due to the rising of battery electric vehicles and, thus, increasing need of raw materials. Especially Li-ion batteries, which are based on valuable materials like nickel, cobalt, and lithium, are increasingly used 1-3. To counteract the increased demand of valuable primary materials and the environmental impacts of mining and further ore processing, different recycling options are used for Li-ion battery recycling 2-7. However, although there is a lot of research going on, the database of different recycling options is quite small. To evaluate the potential recycling process chains more effectively, it is necessary to get a better understanding of the processes.
One way of recycling Li-ion batteries is the mechanical treatment of spent batteries as prerequisite step for hydro- or also pyro-metallurgical processes. Therefore, the batteries are treated with different comminution and separation processes to split up the battery in its individual materials. An exemplary mechanical process chain, based on the so-called LithoRec process 2, 4, 5, is shown in Fig. 1. The first process step is the shredding of the discharged battery cells in an inert gas atmosphere. Then, the crushed batteries are dried in a mixer. By this, the acting shear stress detaches electrode coatings from the cut electrode foils and, thus, produces the so-called black mass, which is the dispersed mixture of anode and cathode coatings. Afterwards, a first zig-zag-sifter removes the heavy casing from the rest of the battery components. Results of Diekmann et al. 5 show that a second comminution step for the electrode pieces using a cutting mill increases the yield of black mass which can be gained in the following screening step. The second zig-zag-sifter is used to separate the remaining current collector foils from the separator foil.

Based on this process chain, simulation models for the unit processes were developed. These models can be used to investigate the processes and also to show the interactions within the process chain through dynamic flow sheet simulations. With a modular approach where the individual unit processes are connected with material and energy streams, it is possible to simulate complex processes like the battery recycling in a lucid way. For solids processes, the individual unit processes have to deal with multidimensional distributed parameters which make them more complex. To deal with this, the use of transformation matrices und multidimensional population balances has been proven 8, 9. Thereby, the effects of different process and material parameters on the results of a single process or process chain can be investigated efficiently.
Among others, the presented process chain underlies fluctuations in the material stream due to some batch process units like the electrolyte evaporation. With the dynamic simulation, the effects of such fluctuations in the material flow on the other unit processes can be investigated. Therefore, model approaches for a cutting mill and a zig-zag-sifter have been developed and are presented in the following. These models are implemented in the flow sheet simulation software Dyssol 9, 10. This is used to carry out simulations for the individual processes as well as for the interconnection of these two process steps.
One of the presented cutting mill model approaches is based on a so-called comminution matrix 11, 12. This matrix describes the ratio in which a certain particle size class is crushed into the respective smaller size classes. It can be used to calculate the resulting particle size distribution (PSD) for a considered comminution time by applying the matrix to the PSD present for each time step. This approach is based on Markov chains which was investigated by Berthiaux 11. By generating experimental data for small time steps, the breakage and selection function can be calculated. This was investigated for different mill types 11-13.
2 Experimental
The cutting mill SM 2000 from Retsch was used for the experimental investigation. The mill was operated in batch mode. A defined mass of feed material is fed to the running mill. The process is stopped once all material has left the mill through the bottom screen. The process does not reach a steady state. Afterwards, the product is analyzed.
The first experiments were carried out with three cylindrical battery cells with a mass of about 200 g as feed material. Thereby, different grid sizes of the bottom screen were used. After processing, the PSD of the crushed material was analyzed using analytical sieving of the entire product. The sorting of the different battery materials within these screen classes was done by hand according to optical appearance.
For the other experiments, copper foils with a size of 100 × 40 mm were used as feed material. The bottom of the mill was closed. By this, the comminution behavior inside the mill can be investigated without the influence of the bottom screen or filling degree. The engine of the mill was stopped after 1 s. Due to the continued rotation of the rotor, the material was further crushed for approx. 9 s. The resulting PSDs were determined by analytical sieving of the entire product. Subsequently, the different sieving size fractions are used as feed material for the same process. To compare the developed model with experimental data, experiments were carried out with different bottom screen sizes using the copper feed material. In addition, time measurements of the process duration were taken during some experiments to approximate the throughput and residence time.
The zig-zag-sifter type ZN-15-80x120 from JÖST was used for the sifting experiments. The classifier channel has a cross-sectional area of 0.0096 m2. For the sifting process, the feed particles were added via a dosing chute. Thereby, copper-, aluminum-, and separator-foil particles were used as feed material. The foils were crushed separately in a cutting mill beforehand. After the subsequent analytical sieving, the sifter experiments were carried out for each material. Thereby, the different particle size fractions according to the screen size classes were used. The throughput was determined by the time measurements of the feed mass flow. After the sifting process, the separation into the light and heavy fraction was determined by weighing.
3 Model Development
3.1 Cutting Mill
Cutting mills are often used for the second comminution step in the battery recycling process chain or, in case of small cells, are also able to break up and comminute entire cells as usually fulfilled by a shredder. Therefore, two different model approaches are developed due to the different requirements when modeling entire battery cells or individual electrode pieces as mill feed. To keep the cutting mill model (using entire cells) simple, the particle sizes of the different materials inside the battery are not considered. Thus, the model should just depend on the battery cell.
3.1.1 Cutting Mill Model for Battery Cells
The cutting mill model for fragmentation of entire battery cells is based on experimental data achieved for cylindrical cells. The experiments were carried out with different grid sizes of the bottom screen inside the mill. For the model development, the main components of the battery like the anode (coated copper foils), cathode (coated aluminum foils), and separator as well as the casing material of the battery were considered. The black mass was not investigated at this stage due to the concentration on the larger particles. The mass distributions of the particle sizes of the different materials were used to calculate the cumulative PSDs. Comparing the different screen sizes, the product sizes resulting from the cutting process are coarser for the larger grid sizes. The larger the grid sizes, the faster the particles leave the mill through the screen. The shorter residence time leads to larger particle sizes and broader distributions.
 (1)
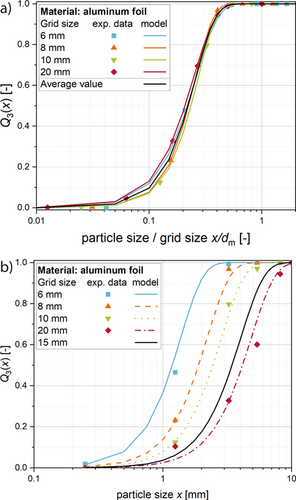
(1)where dm is the grid size and x the particle size. The results are exemplarily shown for the coated aluminum foils (from the cathode) in Fig. 2 for a normalized particle size. The normalized graphs have a similar course for each grid size, so average values for k and λ can be calculated for each material (Fig. 2a, black line). The result is an equation to calculate the cumulative PSD depending on the particle size and the grid size inside the mill. By that, the number of individual equations is significantly reduced to the number of battery materials. For each material inside the battery mix, the PSD can be calculated according to these results for the Al foils. However, the main advantage is the creation of a predictive formula which calculates the PSD for every grid size, without the need of further experiments. In Fig. 2b, this is shown for a grid size of 15 mm. However, this equation is only proved valid for the experimentally investigated range of grid sizes yet.
3.1.2 Cutting Mill Model for the Secondary Comminution of Battery Materials
This model can be used for individual recyclates achieved from a preceding shredder and separation process, e.g., electrode foils alone. In this case, the model is based on the breakage behavior of the feed particles, e.g., foil pieces, fed to the mill. No further materials like harder casing materials have to be considered which are protecting the materials inside the battery cells from fragmentation. The model describes the changes in the PSD depending on the feed material sizes and the comminution time.
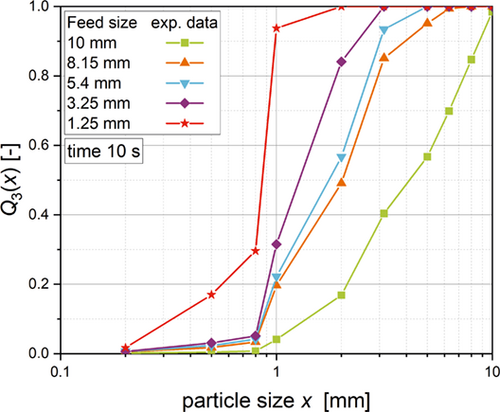
The experimental data of crushed copper foil particles are shown in Fig. 3. Through these resulting particle size distributions, the ratio in which the different feed particle sizes are crushed into the smaller particle sizes can be determined. These values can be used to create a comminution matrix. In this case the comminution matrix describes the changes in the PSD for a time step of 10 s according to the experimental data generation.
 (2)
(2) (3)
(3) (4)
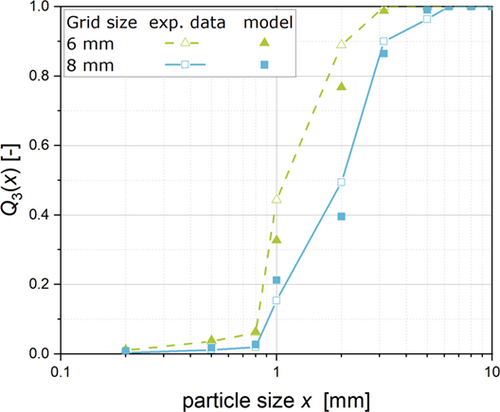
(4)The mass of particles my,i in size class y at time point i is calculated with the mass at the previous time step in the size classes above mx,i–1, the probability to leave the mill within 10 s P10 and the matrix value Cxy. The resulting PSD for screen sizes of 6 and 8 mm are shown in Fig. 4. At this stage, the model has the limitation of the 10 s time step. This leads to the case that only processes with residence times above 10 s can be calculated. Consequently, screen sizes of more than 8 mm cannot be described due to residence times below 10 s determined experimentally.
3.2 Zig-Zag-Sifter
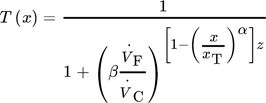
 (5)
(5) and
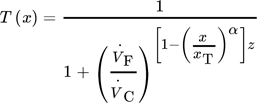
and  , the cut size xT, exponent α, which can be set as 0.5 18, and the number of separation stages z. For the ratio of the volume flow rates, the following approximation can be made 18:
 (6)
(6)with the particle mass load of the air μs,g and the densities of the particles ρs and air ρg. The particle mass load is calculated by the ratio of feed mass flow to air flow.
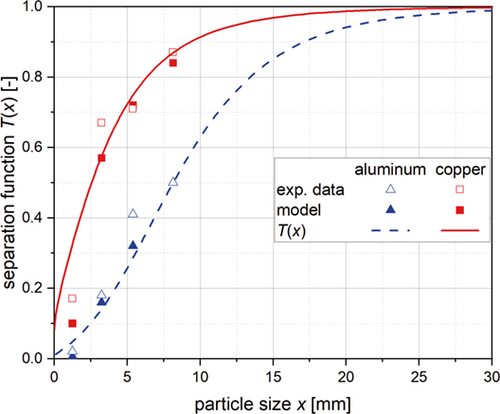
This model does not consider the influence of the particle shape. In case of battery recycling, this is an important aspect. The battery materials have different shapes after shredding and secondary comminution, especially when looking at the current collector foils 20. They have a rather flake shape. This leads to a different buoyancy behavior which has to be considered in the model. Due to this broad range of particle shapes, the experimental data show broader separation functions than calculated with this model.
Therefore, a calibration parameter β is added to this model to consider the complex particle shape and adapt it to the experimental data. The results are shown in Fig. 5. An approximate value of 0.067 m3s−1 was used for the air flow rate and the material-specific parameters in Tab. 1. Approximations had to be made for the density of the particles. The particles are not compact particles but compacted and compressed pieces of foil with corresponding air inclusions inside the particles. Therefore, the weight of a certain amount of particles with the same particle size class was determined and an average density for the particles was calculated (compared to a spherical particle). The feeding rate to the sifter varies for the different experimental data points. For the calculation of the separation function and a first implementation of this model to the flow sheet simulation software, a mean value for the feeding rate is used. This mean value shows a good approximation of most data points.
|
Parameter |
Shape parameter β [–] |
Density ρ [kg m−3] |
Cut size xT [mm] |
Mass load μ [kg kg−1] |
|---|---|---|---|---|
|
Aluminum |
4 × 10⁻⁵ |
900 |
8.15 |
0.011 |
|
Copper |
4 × 10⁻⁵ |
1500 |
2.56 |
0.031 |
 (7)
(7)As such separation functions can directly be used in the dynamic flow sheet simulation, they are determined for each material. Based on this, for a certain material, the mass flow of the heavy and light fraction can be calculated based on the input feed size of the materials.
4 Simulation Results
The models presented are implemented in the dynamic flow sheet simulation software Dyssol 9, 10. Based on the experimental data from batch experiments, continuous processes can be simulated with the use of the presented models. Therefore, the results for single processes of the mill and the sifter can be achieved as well as the interaction between the processes. At this status of work, the simulations focus on the resulting particle sizes and mass flows in and between the processes. Due to the non-time-dependent experimental data, the mass flows out of the process have been approximated linearly. With further experiments, the time dependency will also be integrated into the model.
4.1 Simulation Results for the Cutting Mill
The cutting mill model was implemented with linear approximations of the throughput. These were derived from experimental data of the residence time of model materials in the mill depending on the bottom screen size. The results in Fig. 6a show the time course of the holdup mass inside the mill. The mill is fed with 200 g s−1 of the considered cylindrical battery cells for 2 s at the beginning and again after 10 s. The mass inside the mill is rising due to the feed material. At the time point when the material supply stops, the holdup mass is getting lower until the next battery cells are added to the process. With the smallest screen considered, the mill needs the longest time to empty. Compared to the holdup mass, the mass flow in Fig. 6b shows the highest flow rate for the screen size of 10 mm. The mass flow for the screen size of 6 mm is approximately half of this value.

The particle sizes for the different materials were calculated using Eq. 1. Due to the independence of the feed particle sizes of the certain materials, the PSDs are calculated only based on the fed cylindrical cells. Thus, the PSD of the feed does not change during the process. The mass flow adjusts directly with these PSDs (Fig. 6c). The time dependence of the PSD is to be specified in further investigations.
4.2 Simulation Results for the Zig-Zag-Sifter
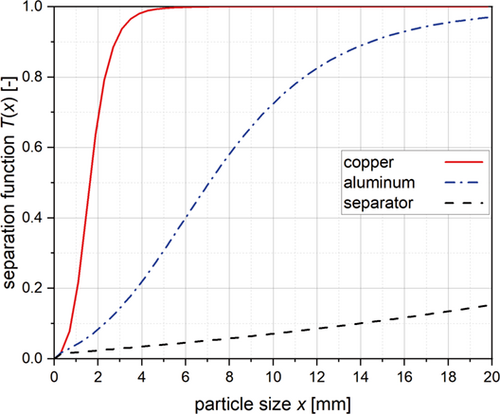
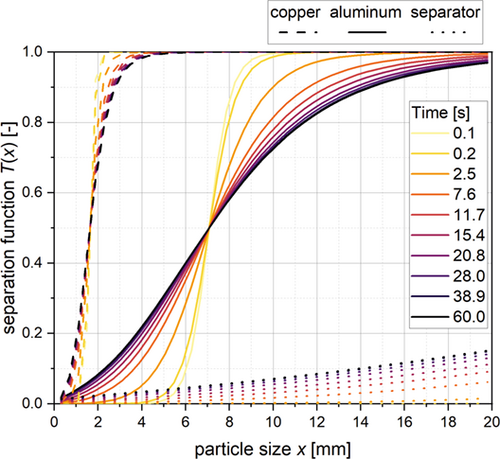
The zig-zag-sifter is simulated for the three different battery materials Cu, Al, and separator foils. The separation function is calculated for an air flow of 0.04 m3s−1. The particles are fed to the sifter in a continuous mode (0.5 g s−1) with consistent mass fractions of the three materials. The cut size of the Cu and Al foils was investigated experientially and approximated for different volume flows. For the separator foils, the cut size could not be determined with the settings examined so far as they end up almost completely in the light fraction due to the low density. Therefore, assumptions have been made that the separation function can only be calculated for low air flows. For the simulation, the assumption has been made that only a small amount will end in the heavy fraction, so the separation function does not reach the value of 1 at the considered particle size range.
The resulting separation function can be seen in Fig. 7. The separation function of the Cu foils has the steepest slope due to the higher particle densities. With these separation functions and the feed particle sizes the mass output of the material in the heavy and light fraction is calculated in the simulation (Tab. 2). Due to the steep separation function of the Cu foils, the highest amount of the Cu ends up in the heavy fraction. The aluminum foils end up in the light fraction with a higher amount under the considered process parameters.
|
Mass output [%] |
Copper |
Aluminum |
Separator |
|---|---|---|---|
|
Heavy |
98.8 |
42.9 |
4.9 |
|
Light |
1.2 |
57.1 |
95.1 |
The shown values are based on various assumptions which had to be made to create this model approach for this difficult material system. The results based on the data in Fig. 5. The data were extrapolated for the simulation. These values are not validated. The extrapolation above particle sizes of 10 mm determined experientially must be considered critical in this case, since a possible change in buoyancy behavior of larger particles is not taken into account. In further investigations, this knowledge gap is to be closed and the model should be able to reproduce the material behavior inside the sifter more accurate to depict the important influences in case of battery recycling.
4.3 Simulation Results of Interconnected Processes
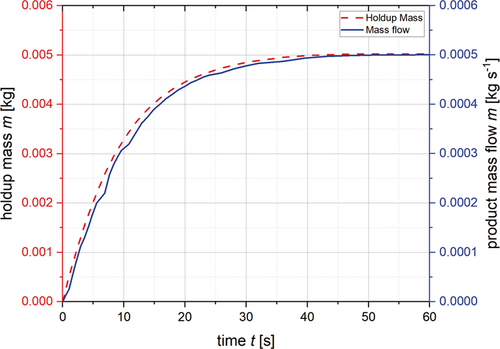
Through the interconnection of these two processes, the dynamic behavior and the influence of a preceding process on a subsequent process can be demonstrated. The shown simulation results are based on a shortened process chain, only considering the first and last process step. The intermediate processes would additionally influence the result but are neglected for this example to show the interaction of these processes in a simplified way. In this case, the mill as first stage is operated with entire cylindrical cells in a continuous mode with an inlet material mass flow of 0.5 g s−1. The grid size of the mill is 10 mm. Among the set process parameters, the holdup mass inside the mill achieves a steady state after 60 s (Fig. 8). The mass flow out of the mill depends on the holdup material composition and the grid size and is adjusted according to the calculated holdup. The mass flow out of the mill is used as input mass flow for the zig-zag-sifter. Therefore, the holdup mass of the sifter is changing until the cutting mill mass flow reaches a steady state.
Due to the changes in the input flow of the sifter, the separation functions change, too. In Fig. 9, these changes can be seen for the Cu, Al, and separator foils. Due to the small material flow rate at the beginning of the process, the separation functions are relatively sharp according to the material properties and process parameters. The more material enters the sifter and the higher the mass load is, the broader are the separation functions. Broader separation functions mean a less efficient separation. Accordingly, a lower throughput results in a more efficient separation and a higher mass recovery and purity of the battery materials. As soon as the steady state is reached, the separation functions remain constant. If the input mass flow would fluctuate, the separation function would always adapt to the current conditions, so the influences of the recovery rate of the materials can be investigated by these simulations.
The adjusting separation function also influences the mass flows in the heavy and light fraction (Fig. 10a). These mass flows are calculated for every time step depending on the results for the input mass flow, its particle sizes, and the separation function. The mass flow of the heavy and light fraction also reaches the steady state due to the steady state of the feed mass flow, as does the separation curve. Since the other process parameters are kept constant, the ratio of heavy and light mass flow does not change any further. Due to the considered material composition, the small particle sizes after this cutting mill process, and the set air flow, the mass flows mainly into the light fraction.
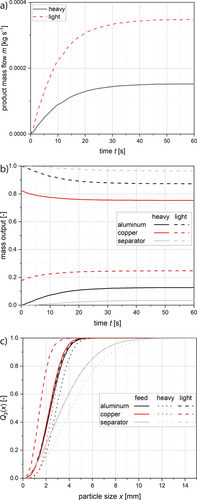
The separator foils end up in the light fraction with an amount of more than 90 % (Fig. 10b, Tab. 3). This high number was predicted due to the low density of the material. In the literature, the amount of separator foils which end up in the heavy fraction was found to be higher as well as the amount of aluminum in the light fraction was found to be lower 5. This can be explained due to lower volume flows and accordingly lower air velocities (4.16 m s−1 compared to 1.08–1.32 m s−1 5). Also, during the battery recycling, there are often inclusions of different materials. When separator foils are connected with some heavier particles, the amount which ends up in the heavy fraction is higher. The consideration of these mixed materials was not included in the development of these initial models and simulations but will be a part of future investigations.
|
|
Copper |
Aluminum |
Separator |
|||
|---|---|---|---|---|---|---|
|
Mass recovery [%] |
Purity grade [%] |
Mass recovery [%] |
Purity grade [%] |
Mass recovery [%] |
Purity grade [%] |
|
|
Light fraction |
33 |
19 |
92 |
41 |
98 |
40 |
|
Heavy fraction |
67 |
90 |
8 |
0.08 |
2 |
0.02 |
The Cu particles are the only material in this simulation which ends up in the heavy fraction with a higher amount, although still a significant proportion of these particles ends up in the light material (Tab. 3).
Comparison with the particle sizes (Fig. 10c) shows that the separator foils end up in the light fraction even if the particle sizes are larger than the sizes of the other materials. Between the input particle size and the size of the light fraction is just a slight difference for the separator foils. For the Cu and Al particles which have a similar feed particle size, the particle sizes in the heavy and light fraction differ more from each other. The amount of particles which end up in the heavy fraction is higher for the Cu particles due to its higher density. Therefore, the particle sizes in the heavy fraction are smaller than the Al particle sizes.
5 Conclusion and Outlook
The recycling of Li-ion batteries is an important field of research with high significance. The modeling of these processes and the dynamic flow sheet simulation can help to get a better understanding of the interaction of the unit processes and provide a larger database to examine different process chains. The presented model approaches and simulations show that it is possible to develop simple process models to predict the influences of the process and material parameters compared to the experimental data pretty well. Differences to the findings of other authors arise from the assumptions made and a simplified material system (using pure foils). Therefore, this model will be extended to more complex material systems in the future.
For the cutting mill, the influence of the grid size for the different materials could be described for the present cell system. Moreover, the influence of the cutting mill results on the zig-zag-sifter can be investigated without the need of further experiments, just by connecting these two processes in the simulation. Therefore, a first model approach for the zig-zag-sifter based on the separation function from Tomas and Gröger 18 was used to describe the influence of the particle size and density on the separating results as well as the process parameter for the feed mass and air flow. This model was extended using a calibration parameter to consider the deviant behavior depending on the complex particle shape of the material system.
For an accurate simulation that reflects data of more complex material systems, especially the zig-zag-sifter model has to be further improved to the complex material shapes of the comminuted battery materials. This will be part of further investigations. To simplify the cutting mill model even further, the material properties should also be included into the model equation. This allows the prediction also for other electrode foil properties. Furthermore, additional parameters such as the speed or the mill properties are to be integrated to extend the model.
In the future, we will describe the entire mechanical process chain in more detail. By this, it shall be possible to optimize not only the single unit processes but also the interaction between the processes. Similarly, different process interconnections can be easily examined and compared.
Acknowledgements
The project on which this report is based was funded by the Federal Ministry of Education and Research (Germany) under the funding code 03XP0331A. The authors are responsible for the content of this publication. Open access funding enabled and organized by Projekt DEAL.
Symbols used
-
- a [–]
-
filling degree-dependent parameter
-
- C [–]
-
comminution matrix value
-
- d [mm]
-
size
-
- k [–]
-
Weibull parameter
-
- m [kg]
-
mass
-
- n [–]
-
RPM-dependent parameter
-
- P [–]
-
screen probability mill
-
- Q [–]
-
cumulative PSD
-
- T [–]
-
separation function
-
 [m3s−1]
 -
volume flow
-
- W [–]
-
screen probability for a particle
-
- x [mm]
-
particle size
-
- z [–]
-
separation stages
Greek letters
-
- α [–]
-
exponent of separation function
-
- β [–]
-
calibration parameter separation function
-
- λ [–]
-
Weibull parameter
-
- μ [kg kg−1]
-
solids loading
-
- ρ [kg m−3]
-
density
-
- φ [–]
-
open screen area
Sub- and superscripts
-
- C
-
heavy fraction
-
- F
-
light fraction
-
- g
-
gas phase
-
- G
-
grid wire
-
- i
-
time step
-
- m
-
grid hole
-
- s
-
solid phase
-
- T
-
cut size
-
- x
-
initial particle size class
-
- y
-
target particle size class
Abbreviations
-
- Exp.
-
experimental
-
- PSD
-
particle size distribution


