Design and Analysis of Charge-Reduced Refrigerant Cycles Using R290
Abstract
R290 is one of the most promising refrigerants for heat pumps and cooling processes working in a temperature range of –15 to 70 °C. The nearly neglectable global warming potential and attractive thermodynamic properties allow the design of climate-friendly and efficient refrigeration systems and heat pumps. However, R290 is flammable, and the use of charge-reduced components and designs should be the first central step to reduce safety risks. Whereas the prediction of heat capacity, temperatures and pressure drops are sufficiently precise the prediction of refrigerant charge is not very accurate when using computer-aided design tools. The article presents a method to enhance accuracy for refrigerant cycles with less than 500 g of R290.
1 Introduction
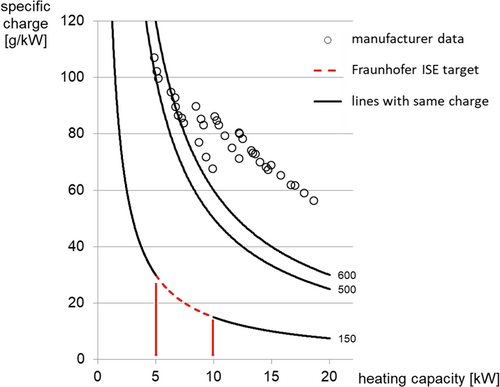
The analysis of the European market for brine-to-water heat pumps for domestic heating, most of the systems work in a range of 6–16 kW and use refrigerant charges between 500–1000 g. To compare the different systems, the capacity specific charge was calculated and plotted for the heating capacities at the standard design point B0/W35 (see Fig. 1). B0 stands for the source or brine temperature of 0 °C and W35 means the heating water temperature of 35 °C.
The total refrigerant charge of the systems in Fig. 1 is indicated by iso-charge lines of 600, 500 and 150 g. The lowest iso-charge line of 150 g represents the safety limit of the DIN EN 378 defining those systems using max. 150 g of flammable refrigerant charge do not have to implement additional safety measures 1. Combining this limit of 150 g for indoor installations with a typical heating demand of 5–10 kW for a single-family house or apartment results into the red marked area in Fig. 1 with a specific charge of 15–30 g kW−1 heating capacity.
The development of a charge-reduced heat pump module, using max. 150 g of R290 and providing a heating capacity in the range of 5–10 kW with reasonable efficiencies is addressed with the project LC150, funded by the German Federal Ministry of Economic Affairs and Climate Action (BMWK) under the grant agreement number FKZ 03EN4001A and a consortium of nine European manufacturers. The project aims to identify 2–3 attractive heat pump module designs and design knowledge on charge-reduced refrigerant cycles. The first will support the manufacturer in offering faster indoor systems with R290. The second more generic aim creates design knowledge which will be helpful also for reducing charge and therefore enhancing safety of systems with larger capacities.
Charge-reduced refrigerant cycles and heat pumps are under research for several years 2-13. From this literature the most relevant aspects for charge reduction were identified and continued with an extensive experimental and simulation-based screening of components and cycles to improve design rules and accuracy in prediction. The main aspects considered here include reducing the amount of oil in the compressor, selecting plate heat exchangers with few plates, equal volume flow and inlet vapor quality distribution and small volume on the refrigerant side.
The presented work is still in progress. Due to this the contribution describes the methodology of the cross-evaluation of refrigerant cycles, the simulation concept and first results of improved computer-aided system design.
2 Methodology
The design of refrigerant cycles is typically done by design tools using experimentally evaluated single components data. Since single component measurements are time consuming and do not cover the question of refrigerant charge of the cycle in total, the concept of cross-evaluation was developed. This means to experimentally evaluate one component in different cycle configurations, e.g., the same evaporator in combination with different compressor types. The results give feedback on the specific cycle characteristics like efficiency, refrigerant charge and heating capacity. Analyzing the characteristics of different cycles with one identical component allows to identify the efficiency and refrigerant charge sensitive components and creates a database for the validation of the simulation tool. Wherever needed additional single component measurements were done to consolidate this concept.
Fig. 2 illustrates the different parts of the cross-evaluation method. The first step is the cycle design. Different components are combined to cover a range of market available heat exchanger and compressor designs, control, and cycle concepts. Components were designed for a 4 kW, 8 kW and 12 kW version of the cycle based on simulations, manufacturer design tools and own experiences.
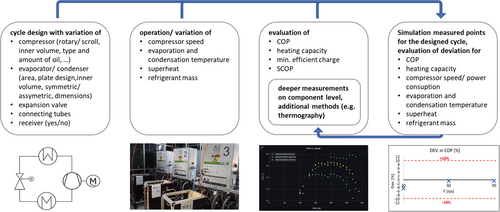
The second step was the definition of the operational envelop of the tests. In order to compare all components and prototypes equally, the point B0/W35 was chosen. B0/W35 is used as baseline and is evaluated for a variation of compressor speed and superheat. For a global comparison, the seasonal COP (SCOP) was selected as the primary evaluation criterium. Therefore, additional operation points, like EN14825, are measured.
Refrigerant charge has a significant role in the performance of a heat pump; therefore, all varied operation parameters were measured for a charge up to 300 g of R290. The measurements were started with the lowest possible charge for stable operation and charge was added successively, in 10 g increments, until the cycle reaches his upper pressure limit. During every charge increment, all points of operation are measured if possible. All varied parameters add up to 20 individual measurements per charge increment and can be found in Tab. 1. Considering the charge increments every refrigerant cycle is measured for about 300–400 operation points.
|
Parameter |
Value |
|---|---|
|
Charge [g] |
0–300 |
|
Superheat [K] |
5, 10, 15 |
|
Source temperature [°C] |
–7/0/10 |
|
Sink Temperature [°C] |
24/27/30/34/35/45/55/65 |
|
Compressor speed [%] |
10/40/70/100 |
All measurements, evaluating calculations and refrigerant charging operations were done fully automated to increase reliability as well as speed in the measurement process. More details on the experimental setup are described in 14.
The completion of the cross-evaluation method is given by the co-simulation of the experimentally evaluated refrigerant cycles and operational points. As simulation tool the software IMST-ART© is used. IMST-ART© 15 is a simulation tool based on physical models developed by the I.U.I. de Ingeniería Energetica at Universitat Politècnica de Valencia. It can be used to calculate the performance and the refrigerant charge of the vapor compression cycles.
Deviations between simulations and experimental results are discussed and analyzed more deeply. So far, additional single component measurements, calculation of thermal losses, thermographic pictures of the heat exchanger surfaces and geometrical evaluation of the internal volumes of the components were individually discussed, compared, or evaluated to get a more precise matching.
3 Application of the Method
As mentioned above, several different heat exchangers, compressors and connecting tube designs were chosen to cover three different heating capacities and to represent different design concepts. All components were discussed with their manufacturers with specific areas of attention in mind, which were determined by previous measurements 16, literature studies and expert interviews. Tab. 2 shows the recent status of designed and evaluated refrigerant circuits with the combination of components. Within the table and the rest of the document “RC” stands for refrigerant circuit, the “8” stands for the targeted 8 kW heating capacity.
|
Versions ID |
Compressor |
Condenser* |
Evaporator |
|---|---|---|---|
|
RC-8-01 |
scroll; high oil amount |
long; 20 plates; 10:6.2 asymmetric* |
long; 36 plates; symmetric |
|
RC-8-02 |
rotary; medium oil amount |
long; 20 plates; 10:6.2 asymmetric* |
long; 46 plates; 10:5 asymmetric* |
|
RC-8-06 |
scroll; high oil amount |
medium length; 40 plates; 10:8.8 asymmetric* |
long; 36 plates; symmetric |
|
RC-8-08 |
rotary; medium oil amount |
special build; not in general metrics |
special build; not in general metrics |
|
RC-8-09 |
rotary; medium oil amount |
long; 20 plates; 10:6.2 asymmetric* |
long; 46 plates; 10:5 asymmetric* |
|
RC-8-10 |
scroll; high oil amount |
medium length; 38 plates; symmetric |
long; 36 plates; symmetric |
|
RC-8-16 |
rotary; medium oil amount |
medium length; 18 plates; symmetric |
short; 20 plates; symmetric |
|
RC-8-17 |
scroll; high oil amount |
medium length; 38 plates; symmetric |
short; 40 plates; symmetric |
|
RC-8-18 |
rotary; medium oil amount |
medium length; 40 plates; 10:8.8 asymmetric* |
long; 46 plates; 10:5 asymmetric* |
|
RC-8-21 |
horizontal scroll; low oil amount |
long; 20 plates; 10:6.2 asymmetric* |
long; 36 plates; symmetric |
|
RC-8-22 |
rotary; medium oil amount |
medium length; 40 plates; 10:8.8 asymmetric* |
long; 46 plates; 10:5 asymmetric* |
|
RC-8-26 |
scroll; high oil amount |
medium length; 40 plates; 10:8.8 asymmetric* |
thermally very long; 42 plates; symmetric |
- * “10:x asymmetric” means the water side has a volume that is 10 divided by x larger than the refrigerant side.
The highlighted refrigerant circuits RC-8-09 and RC-8-21 were chosen for a comparison in the result section. Refrigerant circuit RC-8-09 is used for detailed comparison between experimental data and simulation results. The refrigerant circuit RC-8-09 is equipped with a hermetic twin rotary heat pump compressor. The compressor has a medium oil amount. The evaporator has 46 plates long and asymmetric heat exchanger.
On the other hand, the refrigerant circuit RC-8-21 is equipped with a very compact and semi hermetic automotive scroll compressor, which allows very high compressor speeds and has a very low oil amount. The evaporator is a symmetric heat exchanger with a smaller number of plates than in refrigerant circuit RC-8-09. Both refrigerant circuits are using the same condenser.
From this position it can be expected that refrigerant circuit RC-8-21 requires less refrigerant charge due to the compressor and oil amount (RC-8-09 uses three to four times the oil amount of RC-8-21). Due to higher possible revolution of the compressor RC-8-21 it can be anticipated that this refrigerant circuit achieves a higher absolute heating capacity. Regarding the efficiency (COP) the prediction is not clear, because the evaporators are completely different, and the overall efficiency highly depends on the performance of the evaporators. In RC-8-09 the evaporator has 46 plates and is asymmetric whereas in RC-8-21 the evaporator has less plates (36 plates) but is symmetric.
The following chapters describe the experimental and simulation-based analysis with their main parameters and steps. First, there is the experimental analysis giving results for the parameter variation as described in Tab. 1. Details of the experimental setup and evaluated values are described in Sect. 3.1 As evaluation criteria the COP and the heating capacity Qheat of the different operation parameters are plotted as a function of the refrigerant charge C.
The comparison of experiment and simulation is done on that base using an additional step of plausibility check by first applying the simulation model to the single components. Details are described in Sect. 3.2.
3.1 Experimental-Based Analysis of the Refrigerant Cycle
Fig. 3 shows the scheme of the experimental setup. Brine at the evaporator (source) and water at the condenser (sink), are provided by conditioning modules. Those fluids are referred as secondary fluids. These modules have the following adjustable and controllable parameters: fluid temperature and mass flow. The conditioning module for the sink side is filled with water and the module on the source side with a mixture of ethylene/glycol and water with a freezing temperature of –20°C.
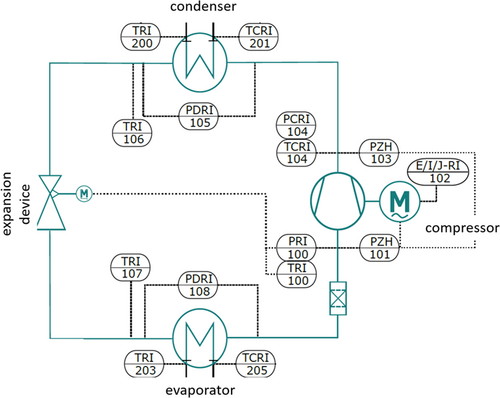
The sensors of the refrigerant cycle are installed anew when the cycle is changed to the next version. Sensors and sensor positions are necessary to control the cycle and to calculate the relevant performance values. Tab. 3 shows the relevant values and their sensor position.
|
Parameter |
Sensor number |
Equation |
|---|---|---|
|
Evaporation temperature Tev [°C] |
P100 |
Tev = Tsat,R290(P100) |
|
Evaporator inlet temperature Tev,in [°C] |
T107 |
– |
|
Evaporator outlet temperature Tev,out [°C] |
T100 |
– |
|
Condensation temperature Tcond [°C] |
P104 |
Tcond = Tsat,R290(P104) |
|
Condenser inlet temperature Tcond,in [°C] |
T104 |
– |
|
Condenser outlet temperature Tcond,out [°C] |
T106 |
– |
|
Evaporator refrigerant pressure drop dpev,ref [kPa] |
dP108 |
– |
|
Condenser refrigerant pressure drop dpcond,ref [kPa] |
dP105 |
– |
|
Superheat SH [K] |
|
Tev,in − Tev |
|
Power consumption compressor Pcomp,tot [kW] |
Pel |
– |
|
Heating capacity Qheat [kW] |
Qheat |
|
|
Cooling capacity Qcool [kW] |
Qcool |
|
For evaluation all relevant values were measured or calculated. The electrical power consumed by the driver and compressor Pcomp,tot was measured between the driver and the power grid. Therefore, all frequency converter losses are included.
The cooling and heating capacities on the source and sink side (secondary sides) were calculated by the measurement of the mass flow employing a Coriolis sensor, combined with inlet and outlet temperature measurement, using submerged PT100 sensors.
Estimating the power necessary for external pumps on the secondary side, differential pressures across the heat exchangers on the secondary side were monitored by differential pressure sensors. Controllers were used to control the inlet temperature by adjusting cooling rate employing the building wide cooling network. The temperature difference between inlet and outlet of the two plate heat exchangers on the secondary sides, were controlled by adjusting the mass flows of secondary fluids. A temperature difference of 3 K was set on the source side and a temperature difference of 5 K was set on the sink side within the secondary fluids to better emulate the EN14825 standard measurements. The suction-side superheat of the refrigerant circuit was controlled with common PID controller employing an electronic expansion valve.
All measurements relied on adjusting the charge employed to the refrigerant circuits. For this purpose, a special charging station was developed and constructed, with the specific task in mind to ensure accuracy, reliability, automated charging, and safe discharging of up to three refrigerant circuits in parallel. The principle is described more detailed in 14. The accuracy of the charging process is about ± (“charging mass” × 20 % + 3 g) with knowledge of the charged amount ± 0.3 g
The experimental data are processed by an automated calculation and visualization and of the relevant process parameters. As a summary for each refrigerant cycle measurement the COP and heating capacity as a function of refrigerant charge is plotted. For the comparison of different operation points a performance map showing the efficiency and the regions of critical charge was developed.
For the comparison between simulation and experiment six values were chosen: the COP, the heating capacity Qheat, the evaporation temperature Tev, the condensation temperature Tcond, the electric power consumption of the compressor Pcomp,tot and the refrigerant charge C.
3.2 Database of Simulation Components
3.2.1 Heat Exchangers
The methodology used to model and validate the heat exchangers starts with the available datasheet and technical drawings provided by each manufacturer. From this data, the main specifications are extracted or assumed and then provided as inputs to an Engineering Equation Solver 17 (EES) code. This code uses the plate thickness as the iterative variable to obtain the proper refrigerant-side holdup volume indicated by the manufacturer. The third step is to model the brazed plate heat exchanger (BPHX) using the “Stand-alone Analysis” feature of IMST-ART©, where the inputs to the model are the outputs from the EES code. The main correlations used for evaluation are the heat transfer coefficient (HTC), and frictional pressure drop coefficient (FC) inside the heat exchangers for single- and two-phase flows. They are summarized in Tab. 4.
Finally, the results from IMST-ART© are validated with the manufacturer's design point values. The main comparison variables, in the case of heat exchangers, are the condensation/evaporation temperature (Tcond/Tev), heating/cooling capacity (Qheat/Qcool) and refrigerant-side pressure drop (dpev,ref).
IMST-ART© successfully estimates the catalog data for condensers and evaporators of the database. The estimated Tev and Tcond values are within ±1 K error bands, while the heating/cooling capacity (Qheat/Qcool) and dpev,ref values are within ±10 % error bands. These deviations are acceptable for modeling heat exchangers.
3.2.2 Compressors
 , electrical power consumption Pcomp,tot, and cooling/heating capacity as a function of evaporation and condensation temperatures. However, in order to accurately estimate the compressor performance under different speeds and evaporating and condensing temperatures, it is better to convert these correlations to performance tables where IMST-ART© can interpolate to find the required cooling capacity and electrical power consumption of the compressor (Pcomp,tot). Then based on this data, it will be easy to calculate the main parameters of the compressors: volumetric efficiency (ηv), compressor efficiency (ηcomp), and isentropic efficiency (ηis), as indicated by Eq. 1, (2) and (3), respectively.
 (1)
(1) (2)
(2) (3)
(3)
 is the mass flow of the refrigerant (kg s−1) calculated based on the cooling capacity. Φloss is the heat losses percentage from the electcal power consumed by the compressor (%). This is an important factor that affects the discharge temperature and isentropic efficiency. This factor is difficult to estimate, and it should be updated based on the actual experimental results.
To convert the AHRI correlations to performance table, the visual basic for application (VBA) in Excel combined with the CoolProp 24 add-in were used. The IMST-ART's feature “Stand-alone Analysis” is used to model the compressors as well as the heat exchangers.
The main comparison variables, in the case of compressors are the mass flow rate  and electrical power Pcomp,tot. All parameters are within a deviation of ±3 %, compared to the view specific points indicated in provided datasheets. One of the main sources of these deviations is the linear interpolation in the catalog correlations and IMST-ART© performance tables.
3.3 Simulation-Based Analysis of the Refrigerant Cycle
Using the available database of models using the above method, all circuits measured in the laboratory can be created dynamically as independent and automated simulation. This includes the prepared models as well as, the piping dimensions (e.g., material, length, diameter) and a basic representation of the insulations. To complete the comparison to the measurements, the measurements matrix must be mirrored in the parametric study of the simulation.
Based on the baseline configuration of B0/W35/SH10/F40%, every parameter (i.e., source inlet temperatures, sink outlet temperatures, super heat, compressor frequency) was iterated with fixing of all other parameters (e.g., compressor frequency was iterated from 10 %, 40 %, 70 %, 100 % while fixing the other parameters to the baseline configuration B0/W35/SH10). Based on the measurement matrix (see Tab. 1), superheat has three iterations (5, 10, 15 K), as well as source temperature (–7, 0, 10 °C), while the sink temperature has eight iterations; the first four sink temperatures were for the low, moderate, medium, and high temperature applications (35, 45, 55, 65 °C), besides, the last four iterations were parts loads based on DIN14825 (34, 30, 27, 24 °C). All parameters' iterations resulted in 21 cases while fixing the charge. On the other hand, refrigerant charge was iterated between 10 to 250 g propane with an increment of 5 g, resulting in a total of 1050 simulations for all component combinations.
All simulations are built, started and results collected using a python interface/script and compared against the measurement data. The automation of this process, which is still under development, will give an extensive picture of prediction reliability and needs for improvement. With this the comparisons will be basis for future adaptations to the IMST-ART© simulation environment. In preparation for the evolution of the simulation environment, areas of attention have been identified based on pre-measurements and first manual simulations.
4 Results and Discussion
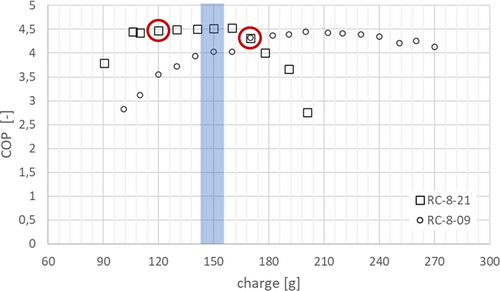
The following results (Fig. 4 and 5) show the variation of heating capacity Qheat and COP for the operation point B0/W35 with a superheat of 10 K and 40 % of compressor speed as a function of refrigerant charge for the refrigerant circuits RC-8-09 and RC-08-21.
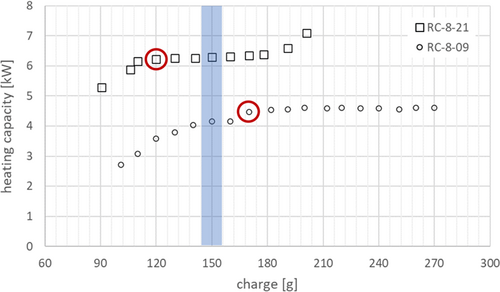
Both investigations are starting with a very low amount of refrigerant charge (90 g and 100 g). In this case the refrigerant circuit is charged with insufficient refrigerant. The refrigerant is not fully condensed in the condenser and is not fully liquid in front of the expansion device. The expansion device opens up to 100 % to ensure 10 K super heat but does not succeed. The super heat is higher than 10 K. Due to this fact both, heating capacity and COP are rising with increasing charge until the refrigerant is completely liquid in front of the expansion device. The trend of the graphs is reaching a plateau. The first point of charge reaching this plateau is identified as “minimum efficient charge” and indicate the value that is needed to run the process with stable conditions at minimum charge and with maximum efficiency (red circle). The blue column marks the region of 150 g refrigerant charge. For the RC-8-09 the minimum efficient charge is about 170 g of R290, for the RC-08-21 this value is with 120 g smaller. Precisely addressing the limit of 150 g (blue column) the cycle RC-08-21 meets this requirement. The COP in Fig. 5 drops down after passing the plateau with increasing amount of refrigerant charge in the system. In this case the system is overcharged. There is no liquid receiver in the system and thus additional refrigerant charge is hold up in the liquid line and afterwards in the condenser. Because of extra refrigerant in the condenser the heat transfer area in the condenser itself is smaller. The smaller the heat transfer area is, the higher needs to be the temperature difference between refrigerant and sink fluid (water). The higher the condensing temperature the higher absolute pressure (high pressure side) and therefore the pressure difference is higher. This results in higher power consumption of the compressor which leads to smaller COPs.
Additionally, RC-08-21 realizes higher heating capacities Qheat. The reason for that can be found in the combination of components (see Tab. 2). The condenser of both cycles is identical, but the compressor of RC-8-09 is a rotary compressor with a medium oil amount whereas for RC-8-21 a horizontal scroll with a low oil amount was used. The used evaporator was similar in length, but for RC-8-09 an asymmetric design with 46 plates was applied whereas RC-8-21 used an evaporator with a symmetric design and 36 plates.
The changes illustrate the relevant aspects for charge reduction, the amount of oil and the total volume of the compressor and the design and operation of the heat exchangers. Asymmetric designs are promising with respect to charge reduction, in the case of RC-8-09 the asymmetric design combined with a high number of plates led to maldistribution of the refrigerant mass flow and inlet vapor quality in the evaporator. This results into a higher need of refrigerant in this component and is contrary to the design intention.
Fig. 5 illustrates the efficiency of the two different refrigerant cycles. For the RC-8-21 a maximum COP of 4.5 is reached at 120 g of refrigerant charge. Enhancing the charge up to 160 g is not affecting the COP, with higher charges the COP decreases due to increasing inefficiencies in component operation. The behavior of the RC-8-21 is similar but shifted to higher refrigerant charges.
In order to compare the results of simulation and experiment six characteristic values were defined in Sect. 3.1.: the COP, the heating capacity Qheat, the evaporation temperature Tev, the condensation temperature Tcond, the electric power consumption of the compressor Pcomp,tot and the refrigerant charge C.
Fig. 6 shows the deviation between simulation and experiment in percent for four different compressor speeds. 30 rps (rounds per second = Hz) corresponds to the mentioned 10 % of max. compressor speed, 60 rps ≈ 40 %, 90 rps ≈ 70 % and 120 rps ≈ 100 %. The values are compared with the assumption that the minimum efficient charge value should show the same behavior. This point is marked in Fig. 4 and 5 by a red circle. The minimum possible compressor speed is referred to 0 % (in this case 20 rps for this specific compressor). The maximum possible compressors speed is referred to 100 % (in this case 120 rps for this specific compressor). Between the min and max limit, the compressor speed is behaving linear. The min and max limit can be different for other compressor models. Thus, with a compressor speed of 60 % two different compressor do not have to have the same compressor speed in rps necessarily.
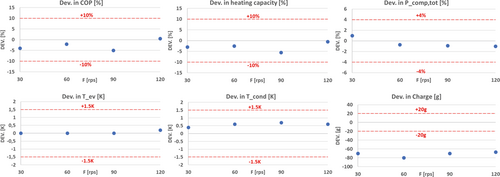
The results shown in Fig. 6 give a very good agreement of lower than 10 % deviation between experiment and simulation for the COP and the heating capacity Qheat, lower than 1.5 K deviation for the evaporation temperature Tev and the condensation temperature Tcond and lower than 4 % deviation for the electric power consumption of the compressor Pcomp,tot. As already mentioned before the estimation of refrigerant charge is strongly underestimated by the simulation, the total values are in a range of 45–80 g.
-
the volume of the heat exchanger ports is typically not considered, the predicted impact is a less steep performance increase in the “undercharge” region as well as a general increase in predicted necessary charge.
-
A part of the refrigerant is absorbed in the oil; oil adsorption models are needed to describe this effect globally, but additionally there is just little known about the direct impact on performance since this impact is included in the compressor performance provided by the manufacturer. Oil absorption increases significantly the needed refrigerant charge.
-
Oil sump location, the oil sump can be located on the discharge side of a compressor, or the suction side of a compressor. This results into strongly deviating pressures and temperature (12 bar vs 3 bar/ 70 °C vs 5 °C), which will impact the predicted amount of charge needed.
5 Summary and Conclusions
With this work an evaluation method using an extensive experimental and simulation-based evaluation of refrigerant circuits to generate more reliable design knowledge for low refrigerant charge application was introduced.
The results show a very good agreement between the experimental and simulation-based data for the reference refrigerant cycle RC-8-09 for the thermophysical performance values, the deviation is in the order of the uncertainty of the experiments.
The simulation strongly underestimated the amount of refrigerant needed in the experiments. This was already assumed in the beginning of the project and led to several more detailed analyses, which allowed to identify the decisive parameters as geometrical uncertainties of the heat exchangers and the absorption of refrigerant in the oil of the compressor.
The work on comparing experimental and simulation-based results will be continued within the next months and the extensive database will be used to improve the precision of refrigerant charge estimation for low-charge refrigerant cycles, but also to generate more component-based knowledge to identify design rules taking the whole operational envelop of a refrigeration circuit into account.
Acknowledgements
The work presented in this paper received funding from the German Federal Ministry of Economic Affairs and Climate Action (BMWK) under the grant agreement numbers FKZ 03EN4001A (LC150). Open access funding enabled and organized by Projekt DEAL.
The cooperation between Fraunhofer ISE and UPV and the ideas for this work were inspired, supported and supervised by Prof. José Miguel Corberán Salvador. He served as Professor in the Department of Applied Thermodynamics and Director of the Institute for Energy Engineering at the Polytechnic University of Valencia (UPV), Spain and died on July 7, 2022 at the age of 65. We will continue the work with his attitude towards professionalism in refrigeration, cooperation and humanity.
Symbols used
-
- cp [kJ kg−1K−1]
-
specific heat capacity
-
- C [g]
-
charge/ mass of refrigerant
-
- h [kJ kg−1]
-
specific enthalpy
-
 [kg s−1]
 -
mass flow
-
- n [s−1]
-
compressor speed
-
- p [kPa]
-
pressure
-
- P [kW]
-
electric power consumption
-
- Q [kW]
-
heating/ cooling capacity
-
- T [°C]
-
temperature
-
- V [m3]
-
volume
Greek letters
-
- Φ [%]
-
loss factor
-
- η [–]
-
efficiency
Sub- and Superscripts
-
- brine
-
brine
-
- cool
-
cooling
-
- comp
-
compressor
-
- cond
-
condensation/ condenser
-
- dis
-
discharge (side of the compressor)
-
- el
-
electric
-
- ev
-
evaporation/ evaporator
-
- Heat
-
heating
-
- in
-
inlet
-
- is
-
isentropic
-
- loss
-
losses
-
- out
-
outlet
-
- ref
-
refrigerant
-
- sat
-
saturation
-
- suc
-
suction (side of the compressor)
-
- swept
-
swept
-
- tot
-
total
-
- v
-
volumetric
-
- water
-
water
Abbreviations
-
- AHRI
-
Air-Conditioning, Heating, and Refrigeration Institute
-
- B
-
brine
-
- BPHX
-
Brazed Plate Heat Exchangers
-
- COP
-
Coefficient of Performance
-
- EES
-
Engineering Equation Solver
-
- E/I/J-RI
-
Electrical Voltage, Current, Power, Recording, Indicating
-
- FC
-
Frictional pressure drop Coefficient
-
- HTC
-
Heat Transfer Coefficient
-
- RC
-
Refrigerant Cycle
-
- rpc
-
rounds per second
-
- PRI
-
Pressure, Recording, Indicating
-
- PCRI
-
Pressure, Controlling, Recording, Indicating
-
- PDRI
-
Pressure Difference, Recording, Indicating
-
- PZH
-
Pressure, emergency value
-
- SC
-
Subcooling
-
- SCOP
-
Seasonal Coefficient of Performance
-
- SH
-
Superheat
-
- TRI
-
Temperature, Recording, Indicating
-
- TCRI
-
Temperature, Controlling, Recording, Indicating
-
- W
-
Water


