Liquid Phase CO2-Analytics for Standardized Mass Transfer Characterization in Packed Columns
Abstract
Mass transfer parameters are necessary for the design of absorption and desorption processes in packed columns. To determine the effective interfacial area and liquid side mass transfer parameters, CO2 absorption and desorption are frequently used. Reliable analytics for concentration determination are essential to obtain correct results. In this work two methods of CO2 liquid phase analysis are compared: first, the back titration of unreacted NaOH after prior precipitation of the bound CO2; secondly, the inorganic carbon analysis with a commercial inorganic carbon analyzer.
1 Introduction
The proper design of packed columns for absorption and desorption processes is of crucial interest for the chemical industry. Today, column design is based on well-known packing characteristics, represented by holdup, pressure drop, effective phase interface as well as the gas and liquid side mass transfer coefficient. These parameters are usually determined by the manufacturer through experiments in pilot or laboratory scaled test facilities. Due to the strong dependence of the packing properties on its own geometry, experimental investigations are necessary for newly developed structured and random packings. 1, 2
Recently, great efforts have been made to standardize mass transfer measurements, equipment and gas-liquid test systems to improve results and allow comparability between different test facilities. The outcome of this standardization projects is summarized within the VDI guideline 2761 part 2 1. This guideline provides recommendations for the standardized measurements and evaluation of fluid dynamic and mass transfer characterization.
Of the given test systems, the desorption of CO2 from water is the easiest to handle system for the determination of effective liquid side mass transfer, as no toxic or caustic chemicals are needed. For the investigation of the effective gas side mass transfer, the absorption of NH3 in water or SO2 in caustic NaOH solutions is recommended. Moreover, the absorption of CO2 in NaOH solutions is the only relevant system for the determination of the effective interfacial area. For all systems the experimental procedure is well described in literature. However, often no detailed description of the chemical analysis is given, especially for the liquid phase analysis of CO2 concentration. 1
In this work CO2 desorption experiments in a packed column are conducted with two different analytical methods to determine CO2 concentration in aqueous samples. The first is the back titration after precipitation of CO2 by BaCl2 and the second, the inorganic carbon analysis with a commercial IC analyzer. Results of both methods are compared and cross-validated with each other.
2 CO2Analytics in Packing Characterization
To experimentally characterize mass transfer in absorption and desorption processes, inlet and outlet concentrations of the gas and/or the liquid phase need to be known. Specially to determine the liquid side mass transfer via CO2 desorption from water, liquid phase concentrations are mandatory. Tab. 1 provides an overview of gas and liquid phase CO2 analytics used in the literature to determine mass transfer parameters in packed columns.
|
Reference |
Test system |
Liquid phase analytics |
Gas phase analytics |
|---|---|---|---|
|
Sherwood et al. 13 |
CO2-water/air |
Titration: CO2 by reacted hydroxide after precipitation of CO2 with BaOH |
Saturation of water with gas samples, then liquid analysis |
|
Shulman et al. 14 |
CO2-water/air |
Titration: CO2 by reacted hydroxide after precipitation of CO2 with BaOH |
Saturation of water with gas samples, then liquid analysis |
|
Billet et al. 6 |
CO2-water/air |
Titration: CO2 with NaOH until pH = 8.28 |
– |
|
Yoshida et al. 15 |
NaOH-water/CO2-air; KOH-water/CO2-air |
Titration: CO2 by total alkali and OH- |
Saturation of water with gas samples, then liquid analysis |
|
Vivian et al. 16 |
CO2-water/air |
Titration: CO2 by reacted hydroxide after precipitation of CO2 with BaOH |
– |
|
Vidwans et al. 17 |
NaOH-water/CO2-air |
Titration: CO2 by reacted hydroxide after precipitation of CO2 with BaOH |
– |
|
Mangers et al. 18 |
water/CO2-air |
Titration: CO2 by reacted hydroxide after precipitation of CO2 with BaOH |
– |
|
Merchuk 19 |
NaOH-water/CO2-air |
Titration |
Gas chromatography |
|
Billet et al. 7 |
CO2-water/air |
Titration: CO2 with NaOH until pH = 8.11 |
– |
|
Billet et al. 20 |
CO2-water/air |
Titration |
– |
|
Linek et al. 21 |
NaOH-water/CO2-air |
– |
IR analyzer |
|
Billet et al. 8 |
CO2-water/air |
Titration: CO2 with NaOH until pH = 8,28 |
– |
|
Henriques de Brito 22 |
NaOH-water/CO2-air |
Titration: CO2 with HCl by equivalence point difference |
IR analyzer |
|
Weiland et al. 23 |
NaOH-water/CO2-air; Na2CO3-NaHCO3-water/CO2-air |
not specified |
Gas chromatography |
|
Bornhütter et al. 24 |
CO2-water/air |
Titration: CO2 with NaOH |
IR analyzer |
|
Kolev et al. 25 |
CO2-water/air |
Titration: CO2 with a not specified acid |
– |
|
Henriques de Brito et al. 26 |
NaOH-water/CO2-air |
Titration: CO2 with HCl by equivalence point difference |
IR analyzer |
|
Weimer et al. 27 |
NaOH-water/CO2-air |
Titration |
IR analyzer |
|
Brunazzi et al. 28 |
CO2-water/air |
Titration |
– |
|
Nakajima et al. 29 |
NaOH-water/CO2-N2 |
Titration: NaOH and CO2 with HCl |
– |
|
Duss et al. 30 |
NaOH-water/CO2-air |
not specified |
IR analyzer |
|
Raynal et al. 31 |
NaOH-water/CO2-N2 |
Titration: NaOH and CO2 with a not specified acid |
– |
|
Kolev et al. 32 |
NaOH-water/CO2-air |
not specified |
IR analyzer |
|
Nakov et al. 33 |
NaOH-water/CO2-air |
not specified |
IR analyzer |
|
Hoffmann et al. 34 |
NaOH-water/CO2-air |
– |
IR analyzer |
|
Tsai et al. 35 |
NaOH-water/CO2-air |
IC analysis: acidic evolution |
IR analyzer |
|
Alix et al. 36 |
NaOH-water/CO2-air |
Titration: NaOH and CO2 with HCl |
IR analyzer, gas chromatography |
|
Tsai 9 |
NaOH-water/CO2-air |
IC analysis: acidic evolution |
IR analyzer |
|
Zakeri et al. 37 |
NaOH-water/CO2-air |
Titration: CO2 by excess HCl after dissolution of precipitated BaCO3 |
IR analyzer |
|
Grünewald et al. 38 |
CO2-water/air |
Titration |
– |
|
Alix et al. 39 |
NaOH-water/CO2-air |
Titration: CO2 with HCl |
IR analyzer |
|
Aferka et al. 40 |
NaOH-water/CO2-air |
Titration: CO2 with HCl |
IR analyzer |
|
Wang et al. 41 |
NaOH-water/CO2-air |
– |
IR analyzer |
|
Wang et al. 42 |
NaOH-water/CO2-air |
– |
IR analyzer |
|
Yazgi et al. 43 |
NaOH-water/CO2-air |
Titration: CO2 with HCl |
IR analyzer |
|
Kunze et al. 44 |
CO2-water/air; NaOH-water/CO2-air |
Titration |
IR analyzer |
|
Wang et al. 45 |
NaOH-water/CO2-air |
– |
IR analyzer |
|
Neumann et al. 46 |
NaOH-water/CO2-air |
Titration |
IR analyzer |
|
Sheng et al. 47 |
NaOH-water/CO2-air |
Titration |
IR analyzer |
 (1)
(1) (2)
(2) (3)
(3)So far, there are no commercial inline methods available that are capable to measure the entire range of concentration found in packed columns with sufficient accuracy. All relevant analytical methods therefore require sampling from the column inlet and outlet and the subsequent chemical analysis of the CO2 concentration. For CO2 desorption from water, liquid phase concentration can range from approximately 40 mol m−3 at saturation to 0.1 mol m−3 after desorption. In applications where hydroxide solutions are used together with atmospheric CO2, the concentration values might be different.
As shown in Tab. 1, most analytical methods are based on titration, but the exact method is often not mentioned. Though, many of the listed analytics prevent CO2 from degassing by chemical binding CO2 in form of carbonates as indicated by Eq. 3. The solutions are then analyzed for both, the carbonate and OH− concentrations. The used methods are often based on the Winkler 3 or Warder method 4, 5. Four different methods used for the determination of CO2 concentration are presented in the following.
One possibility to determine hydroxide and carbonate concentration simultaneously is to titrate the sample using a strong acid, e.g., HCl 4. Two indicators are used to determine both equivalence points. First, phenolphthalein is applied to determine the concentration of NaOH and  together. Then methyl orange is added for the HCO3− concentration. As a more precise alternative to the indicators, the equivalence points obtained from potentiometric titration can be used. The carbonate concentration corresponding to the absorbed CO2 can be determined as the difference between the first and second equivalence point. This method is easy and fast. However, a disadvantage of direct titration with HCl is the degassing of CO2 from the sample during titration as soon as low pH values are reached, since the solution is not stable at a low pH. Degassing can result in errors of the determined concentrations. Therefore, it is recommended to cool the samples in an ice bath during titration to minimize the degassing. Another difficulty of this method is the exact determination of the equivalence points. These are not as sharp as known from the direct titration of NaOH with HCl. Especially for small concentrations, where the equivalence points are closely apart, it becomes more difficult to find their exact positions.
In a different approach, the total alkali concentration is first determined by using only methyl orange or the potentiometric titration curve. Then, for the same sample the carbonates are precipitated by adding BaCl2, which forms hardly soluble BaCO3 with the carbonates. The remaining hydroxide can be determined by back titration with a strong acid. The reacted hydroxide is equivalent to the CO2 absorbed. This method bypasses the disadvantages of degassing CO2 by removing the carbonates before titration. Thus, only NaOH is titrated, which is known to have a sharp equivalence point that can be localized very precisely. However, care has to be taken during the removal of the precipitated BaCO3 prior to titration as remaining BaCO3 will dissolve during titration and cause errors.
A different titration method is applied by Billet and Mackowiak 6-8 without first binding CO2 as carbonates. Samples containing dissolved CO2 are titrated directly with NaOH until a pH value of approx. 8.2 is reached. Although this procedure should work in theory, physically dissolved CO2 is not stable in water and tends to outgas, especially when stirred. Therefore, the expected deviations from the actual concentrations are even higher than with the first method presented, because CO2 can degas from the sample during the entire titration and its preparation, whereas with the first method degassing only occurs during the titration when the pH value becomes acidic.
Recently, Tsai 9 used another approach to analyze the concentration. CO2 is driven out of the sample by acid evolution with a carrier gas, which is then analyzed by a calibrated IR analyzer to quantify the amount of carbon stripped from the sample. This method is similar to the inorganic carbon analytics performed by modern TOC/IC analyzers. In theory, this method should be more precise than the ones mentioned above, as the carbonates are completely purged from the sample by the acid and all CO2 is analyzed by an IR analyzer. No further preparation steps for the sample are necessary and this method exploits the disadvantage of the previous methods, as CO2 is deliberately degassed for analysis.
Today, state of the art in CO2 analysis are the inorganic carbon (IC) analysis and the titration with BaCl2 according to the Winkler method.
3 Experimental
3.1 Setup and Mass Transfer Measurements
Desorption experiments are conducted in a countercurrent operated packed column with an inner diameter of di = 0.288 m. The flowsheet is given in Fig. 1. Deionized water with a conductivity < 5 μS cm−1 is saturated with CO2 (AirLiquide, > 99.7 %) before the experiments and filled in a gassed storage container. Air is humidified before entering the main column to ensure uniform air conditions for all experiments. The gas load is measured via an orifice according to DIN EN ISO 5167-2 10. Packed bed heights consisting of 1.4 m Montz Pak Typ B1.250 metal for the first and after that 1.5 m Raschig Pak 110X-P plastic for the second characterization are installed as recommended by the manufacturer, and characterized with regard to the effective liquid side mass transfer.
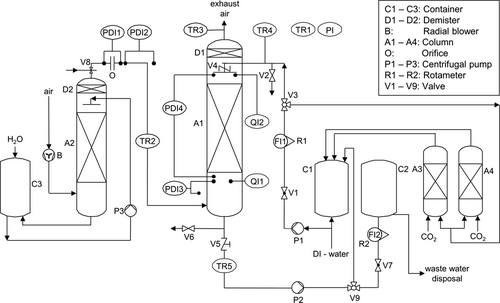
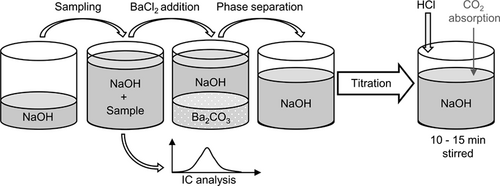
Liquid samples are taken from the feed pipe and the bottom of the column and are directly transferred into diluted NaOH (VWR, 0.1 mol L−1, > 99.8 %) solutions of known concentration to prevent CO2 from degassing. An excess of hydroxide was ensured for all samples. Gas phase concentrations are measured above and below the packing with an IR gas analyzer Ultramat 23 calibrated with calibration gas (AirProducts & Chemicals, 1.5 % CO2 in air).
3.2 Liquid Phase Sample Analytics
 is then obtained from the reacted amount of hydroxide ions according to Eq. 4 and (5), where VHCl is the amount of acid required to reach the equivalence point. VNaOH, VBaCl2 and Vsample are the volume of the diluted NaOH in the sample flask, the volume of BaCl2 solution added, and the sample volume from the column, respectively. Vtitration is a part of the volume taken from the precipitated sample, which is used for titration. Equivalence point was determined at the inflection point of the titration curve. The total alkaline concentration cNaOH is known by the NaOH amount initially used. Thus, the determination of the total alkaline concentration cNaOH is not necessary. A schematic representation of the process is given in Fig. 2 and a calculation example is given in the Appendix.
 (4)
(4) (5)
(5)
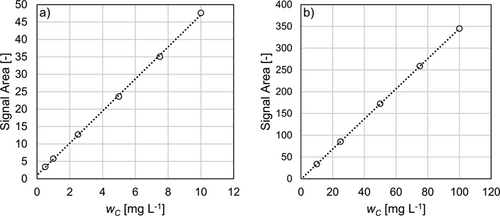
The CO2 concentration by IC analysis was determined using a Shimadzu TOC-L analyzer operating in IC mode. The carbonates and the dissolved CO2 are sparged from the sample with synthetic air as carrier gas at a low pH value around 3. The amount of CO2 present in the sample is then quantified with a NDIR analyzer. For calibration, TIC calibration standard (Bernd Kraft GmbH, 10 and 100 mg L−1 TIC) is used. Since calibration is crucial for the IC-analytical results, the calibration procedure recommended by the manufacturer is applied. Two calibration curves are recorded for concentrations of 0.5–10 mg L−1 and 10–100 mg L−1, corresponding to the dissolved column top and bottom sample concentrations, respectively. Calibrated concentrations are displayed in Fig. 3. For IC analysis, the sample is analyzed three times within 10 min, whereas the time needed for titration is around 20 min including sample preparation after 12 h for sedimentation.
3.3 Mass Transfer Evaluation
 (6)
(6) (7)
(7)4 Comparison of CO2Analytics for Mass Transfer Characterization
During the mass transfer characterization of Montz Pak Typ B1.250 metal and Raschig Pak 110X-P plastic all samples were analyzed with back titration and IC analysis. In order to compare the applicability of both methods, measured concentrations and resulting HTUOL are compared below.
4.1 CO2Concentration Results
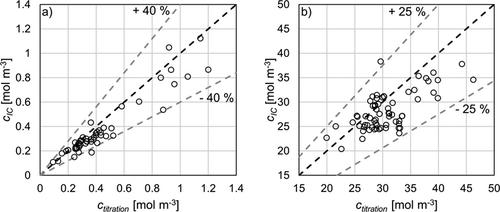
Concentrations measured by both analytics at the top and bottom of the column are compared in Fig. 4. Top concentrations between 20 and 46 mol m−3 are resulting from loading the water with CO2. Bottom concentrations are between 0.1 and 1.2 mol m−3. Both methods correspond to the measured value in the range of 40 % and 25 % inaccuracy for bottom and top concentrations, respectively. For both ranges a trend towards higher concentrations in titration compared to IC analysis can be observed. This trend is most likely based on a combination of two effects occurring during the titration analytical process. First, the CO2 samples bound in NaOH have to be reopened to add the BaCl2 solution for precipitation of the CO2 as carbonates and to separate the excess liquid from the precipitate. Secondly, the back titration is carried out under atmospheric conditions. In both cases CO2 can be absorbed from the environment into the excess hydroxide solution. Especially during the back titration, where the solution is stirred for around 10 min during the running titration, CO2 may be absorbed from air. In contrast, air is completely excluded in the IC analysis.
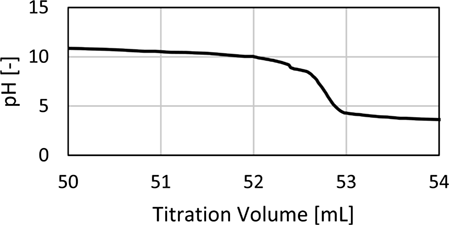
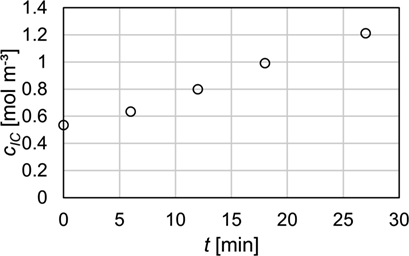
The effect of absorbed CO2 from air during stirring becomes clear when looking at the increase in concentration in a stirred sample in contact with air over time. As indicated by Fig. 5, a linear increase can be observed during the exposure of the sample to atmospheric CO2. Although the absorption rate of CO2 decreases after all hydroxide is neutralized during titration, a considerable amount of CO2 is still absorbed into the solution. This can also be observed, due to the formation of small amounts of BaCO3 on the surface of the titrated sample. However, most crystals dissolve as the pH value decreases during titration. On the one hand, this leads to a more precise determination of the concentration, since dissolved carbonates lead to an equivalent consumption of HCl during the titration. On the other hand, as mentioned before, the titration curves of carbonate solutions always have two equivalence points. At low carbonate concentrations differentiation between both is hardly possible and the equivalence point becomes less sharp. For this reason, and because it cannot be excluded that some crystals do not dissolve, inaccuracies in CO2 determination are probable. An example of a titration curve with small amounts of BaCO3 is given within the calculation example in the Appendix in Fig. A2.
Another possibility to check the quality of the derived concentrations is the closed carbon mass balance. For titration the mean deviation from the measured CO2 gas flow is 9.4 % whereas for IC analysis it is calculated to 17.1 %. Here, the amount of CO2 desorbed from the liquid is underestimated when compared to the gas streams. Although this indicates better results for concentrations determined by titration, the calculated deviations should be considered with caution. At typical gas concentrations of around 500 ppm in the column bottom, the gas concentration is close to the lower limit of the gas analyzer of 100 ppm. In this range, the manufacturer specifies a tolerance of approximately 300 ppm. If, for example, the lower concentration increases by 300 ppm, the mean deviation for titration becomes 23.8 % while the deviation for TIC analysis decreases to 16.8 %, but now with an overestimation of the desorbed CO2 calculated from the liquid in relation to the gas. Fortunately, the HTUOL is almost independent from the gas concentration and reacts for the given example only with a change of less than 1 %.
4.2 Liquid Side Mass Transfer Results
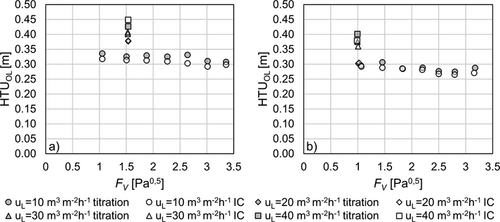
Mass transfer characteristics are compared using HTUOL according to Eq. 7. The calculation is based on the top and bottom concentrations determined by IC and titration analysis. Fig. 6 shows that the deviations of the HTUOL values are within a range of 10 % depending on the analytical method. The increase in accuracy in HTUOL determination with respect to concentration measurement occurs due to the fact that HTUOL is based on the concentration difference between inlet and outlet as well as on the damping effect of the logarithm used for calculation in Eq. 3. Therefore, the effect of inaccuracies in concentration determination seems to be not as significant as long as the same analytical method is used to determine both concentrations. However, the methods still have a slight impact on HTUOL as can be seen from Fig. 7.
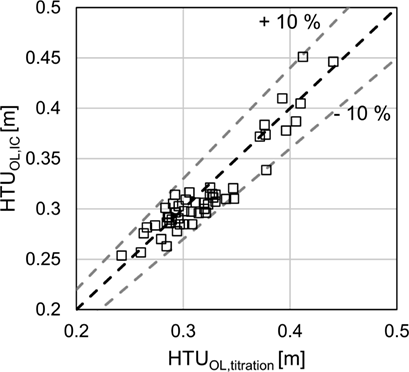
Fig. 7 displays the mean HTUOL for both packings investigated with respect to gas and liquid loads. In all measurements the mean HTUOL determined by titration is slightly higher than that determined by IC analysis. This behavior can again be attributed to the slightly higher CO2 concentrations measured by titration, which is referred to an increase of concentration in the bottom sample that has a higher impact on the HTUOL than an increase in the top sample. Nevertheless, both methods are in good agreement with each other and deviations of the HTUOL are usually within the range of the standard deviation for each measurement. Therefore, the slightly higher HTUOL for titration analysis might as well be an error that occurred during measurement or sampling. For Raschig Pak 110X-P plastic the averaged standard deviations are 3.5 % and 2.1 % for titration and IC analysis, respectively. For Montz Pak Typ B1.250 metal the averaged standard deviations are 4.7 % for titration and 6.3 % for IC analysis.
5 Conclusion
The standardized characterization of mass transfer parameters for the absorption and desorption of CO2 was investigated with regard to the influence of the analytical methods used for the determination of liquid phase concentrations. Two state-of-the-art analytical methods were compared to each other. These are back titration of unreacted NaOH after precipitation of the chemically bound CO2 in the form of carbonates and the IR-based IC analysis. For the example of mass transfer characterization by CO2 desorption, both analytical methods were applied to characterize Montz Pack Typ B1.250 metal and Raschig Pak 110X-P plastic at different gas and liquid loads.
The accuracy of concentration determination with regard to titration was within 40 % for small concentrations from 0.1 up to 1.2 mol m−3 and 25 % for concentrations between 20 and 45 mol m−3. The CO2 concentrations determined by titration showed a tendency towards higher concentrations, compared to the IC analysis for the same sample. This difference is caused by the CO2 absorption during the time required for the titration, since the titration was performed under atmospheric CO2 partial pressure. In contrast, the IC analysis was performed under exclusion of atmospheric CO2 with synthetic air as carrier gas.
Mass transfer results were compared using HTUOL of all measurements, which only varied within a range of 10 % for both analytical methods. The results of mass transfer, therefore, agree well for both methods resulting in reliable and comparable results. Nevertheless, the determination of liquid phase concentrations can be challenging and is particularly prone to errors for titration, since many time-consuming analytical steps are required. CO2 analysis by IC using a TOC analyzer is intuitive and fast and, therefore, recommended to improve the comparability of liquid side mass transfer parameters. A more detailed comparison of advantages and disadvantages is given in Tab. 2. However, this table only applies for the methods examined in this publication. Titration could easily be improved by reducing the exposure of the samples to atmospheric CO2, e.g., by shortening the titration time or by excluding CO2 with a protective atmosphere.
|
|
|
Titration |
|
TIC |
|---|---|---|---|---|
|
Calibration |
+ |
easy calibration; less prone to errors |
– |
time consuming calibration; prone to calibration errors |
|
Method |
o |
semi-automatic |
+ |
fullly automatic |
|
Error potential |
– |
prone to errors; lower reproducibility |
+ |
not prone to errors; good reproducibility |
|
Hazard |
– |
toxic BaCl2, acids and bases |
o |
acids and bases |
|
Time |
– |
time consuming; > 8 h |
+ |
less time consuming |
|
Accuracy |
+ |
high accuracy |
+ |
high accuracy |
Acknowledgements
Open access funding enabled and organized by Projekt DEAL.
Symbols used
-
- c [mol m−3]
-
molar concentration
-
- d [m]
-
diameter
-
- f [–]
-
dilution factor
-
- FV [Pa0.5]
-
gas load
-
- H [m]
-
packed bed height
-
- HTU [m]
-
height of transfer unit
-
- m [–]
-
slope of the equilibrium curve according to Henry's law
-
- NTU [–]
-
number of transfer units
-
- u [m2m−3h−1]
-
liquid load
-
- V [L]
-
volume
-
- w [mg L−1]
-
weight concentration
-
- x [–]
-
liquid phase mole fraction
-
- y [–]
-
gas phase mole fraction
Sub- and Superscripts
-
- B
-
bottom of the column
-
- C
-
carbon
-
- i
-
inner
-
- L
-
liquid
-
- OL
-
overall liquid side
-
- sample
-
liquid sample from the mass transfer experiment
-
- T
-
top of the column
-
- titration
-
prepared liquid sample for titration
Abbreviations
-
- DI
-
deionized
-
- IC
-
inorganic carbon
-
- IR
-
infrared
-
- TIC
-
total inorganic carbon
-
- TOC
-
total organic carbon
Appendix: Example for CO2Concentration Calculation
The following example is presented for a liquid load of uL = 10 m3m−2h−1 and a gas load of FV = 1.53 Pa0.5 for the Raschig Pak 110X-P. For the bottom sample 40 mL of 0.1 mol L−1 NaOH was prepared prior to the experiments. The top sample was prepared with 20 mL of 0.1 mol L−1 NaOH and 50 mL of highly purified water. The water acts as an additional volume to reduce the gas volume in the sample flask to its minimum. Consequently, 200 mL of the bottom sample and 5 mL of the top sample are added to the prepared solutions with 6 mL and 3 mL of 0.5 mol BaCl2 solution, respectively. After precipitation, 50 mL of the clear liquid of both samples are used for titration with 0.02 mol L−1 HCl. The resulting titration curves are shown in Fig. A1. The equivalence point of the samples was determined at the inflection point of the titration curve. The HCl volumes consumed at the infliction point are 54.90 mL for the top and 38.99 mL for the bottom sample.

 (6)
(6) (7)
(7) (8)
(8) (9)
(9)For the CO2 determination by IC analytics, 15 mL of the sample taken at the top of the packed column is added to 60 mL of 0.1 mol L−1 NaOH solution. At the column bottom, 200 mL sample was taken and diluted in 40 mL of 0.1 mol L−1 NaOH. The diluted samples were transferred directly to the TIC analyzer resulting in concentrations of 63.39 g L−1 and 3.551 g L−1 for top and bottom respectively. The actual sample concentration is determined using the molar mass of CO2 of 12.01 g mol−1 and the sample volumes of 15 mL and 200 mL to 26.39 mol m−3 at the column top and 0.355 mol m−3 at the column bottom.
An example for a titration curve with small amounts of BaCO3 present is given in Fig. A2. The cutout around the equivalence point shows that in the presence of BaCO3 there are two small equivalence points close to each other. Therefore, the exact position of the real equivalence point becomes less sharp, which might lead to small deviations in the determined concentrations apart from the real values.
