Dense Coconut Oil-in-Water (CO-Water) Emulsification via a Vortex-Based Cavitation Device
Abstract
In this study, a vortex-based hydrodynamic cavitation (HC) device was used to produce coconut oil-in-water (CO-water) emulsions. Emulsions were produced at 200 kPa and 25 °C with coconut oil (CO) volume fractions (αo) of 0.15, 0.30, 0.45, and 0.60. The influence of the CO volume fraction on the droplet size distribution (DSD), Sauter mean diameter (d32), other characteristic diameters, and droplet breakage efficiency (η) was investigated. To examine the influence of dispersed-phase properties, the DSD profiles of CO-water were compared with rapeseed oil-in-water (RO-water) emulsions. This study validates the application of a turbidity-based method for estimating droplet size (d32) in CO-water emulsions, demonstrating its potential for real-time process monitoring.
1 Introduction
Liquid–liquid emulsions play a crucial role in many important sectors, including cosmetics [1-3], food [4-6], pharmaceuticals [7, 8], agriculture [9, 10], and many more. These systems consist of two immiscible phases, in which one phase (the dispersed phase) is distributed as small droplets within the other phase (the continuous phase) [11]. Due to their unique microstructure and functional properties, emulsions serve as foundational frameworks across diverse applications [1, 2]. In cosmetics, a sector where products are largely consumer-driven, millions rely on emulsions daily to deliver lipids and moisture to the skin. Cosmetic products are primarily classified as ointments, creams, gels, and lotions [12]. Creams, a common form of emulsion, can be further sub-classified by their emulsion type. Lipophilic creams, or water-in-oil (W/O) emulsions, have water as the dispersed phase and oil as the continuous phase. Conversely, hydrophilic creams, or oil-in-water (O/W) emulsions, have oil as the dispersed phase and water as the continuous phase. Amphiphilic creams possess both lipophilic and hydrophilic properties. Lotions are essentially free-flowing creams, primarily of the O/W type, at room temperature. Generally, O/W creams supply more moisture to the skin, whereas W/O creams provide more lipids. More complex systems, such as multiple emulsions of the water/oil/water (W/O/W) or oil/water/oil (O/W/O) types, offer advanced functionalities for cosmetic applications [1].
In skincare emulsions, the oil phase is the major ingredient after water, being used at levels between 3 % and 20 % (w/w) [3]. The oil phase is critical in formulating O/W based cosmetic products, as variations in the oil type can significantly affect the rheological properties, sensory attributes, and overall performance of the emulsion [13, 14]. Among several new technologies, researchers have successfully harnessed the cavitation phenomenon to produce different types of liquid–liquid emulsions [15, 16]. This process is characterized by the formation, growth, and collapse of vapor-filled cavities in liquids, generating intense shear forces. Although cavitation can be generated in various ways, the two most widely used methods in the emulsification process are cavitation generated by pressure or flow variation (hydrodynamic cavitation [HC]) and by ultrasound (acoustic cavitation) [17, 18]. In a recent study by Gode et al. [19], compared six different emulsification devices in terms of droplet size distribution (DSD), energy efficiency, and energy consumption. The study found that the vortex-based HC device demonstrated the highest energy efficiency, with a Sauter mean diameter and DSD significantly lower than the other devices. This vortex-based HC device also exhibited superior energy efficiency, making it the most effective choice for continuous emulsification.
Previous studies have demonstrated the effectiveness of a vortex-based HC device for producing rapeseed oil-in-water (RO-water) emulsions with oil volume fractions up to 0.6 [20]. These findings confirmed the vortex-based HC device ability to emulsify high oil volume fraction in RO-water systems; however, its emulsification of oil with distinct physicochemical properties remains an important area of investigation. Therefore, in our present study focuses on the emulsification of coconut oil (CO), a widely used emollient in personal care formulations. Unlike rapeseed oil (RO), CO presents unique emulsification challenges due to its higher proportion of saturated fatty acids and its melting point of 23.16 °C, which significantly influence emulsification process [21]. In this study, coconut oil-in-water (CO-water) emulsions were produced using a vortex-based HC device. This approach aligns with the growing interest in value-added products (VAP) derived from coconuts, especially virgin coconut oil (VCO), which meets the consumer-driven demand for natural and effective cosmetic ingredients. VCO has gained worldwide popularity due to its diverse applications in medicinal, food, cosmetic, and skincare products [22, 23]. VCO is predominantly composed of saturated fatty acids (>90 %), most of which are medium-chain fatty acids (MCFA), with a small proportion (5–8 %) of unsaturated fatty acids. The major constituents include lauric acid, myristic acid, caprylic acid, palmitic acid, capric acid, stearic acid, oleic acid, and linoleic acid [24-27]. These physicochemical differences necessitate distinct operating conditions to produce stable O/W emulsions, making this study particularly relevant for emulsifying such an oil phase.
Emulsion stability is one of the most critical physicochemical properties in emulsification processes, fundamentally influencing the product quality and shelf life [28]. It is closely correlated with DSD, which is influenced by various parameters, including mixing conditions, emulsification method, phase composition, and emulsifier properties [29, 30]. In this study, we systematically investigate the influence of CO volume fraction on the DSD and droplet characteristics of produced CO-water emulsion. The selection of an appropriate surfactant plays an important role to produce stable O/W emulsion [31]. Researchers have combined non-ionic hydrophilic and lipophilic surfactants to optimize hydrophilic-lipophilic balance (HLB) to achieve stable CO-in-water emulsions, with droplet sizes reaching the nanoscale or submicron scale [32]. Pengon et al. [33] investigated the influence of different surfactants on the formation and stability of CO-water emulsions, utilizing surfactants such as Tween 60, polyethylene glycol hydrogenated castor oil (PHC), sodium lauryl sulfate (SLS), and poloxamer 407. Similarly, Gore et al. [34] conducted a detailed study on HLB requirements for water-in-CO emulsions, covering an HLB range from 1.8 to 11. In our study, aimed to produce stable CO-water emulsion at high CO volume fraction, therefore non-ionic hydrophilic Polyoxyethylene (20) sorbitan monolaurate (Tween 20) surfactant was selected. Additionally, another objective is to examine the influence of dispersed phase physical properties on O/W emulsions produced using vortex-based HC emulsification. To maintain consistency with our previous RO-water study [20], we used the same Tween 20 concentration in the formulation of CO-water emulsions. This ensures that any variations in DSD are attributed to differences in the oil phase properties rather than surfactant effects.
Real-time online or rapid droplet size characterization methods are especially needed in on-demand manufacturing environments, where efficient process control is essential [35, 36]. To address this need, researchers have explored various approaches. For instance, photon density wave (PDW) spectroscopy measurements for monitoring the droplet size in concentrated samples without dilution [37, 38]. Additionally, near-infrared spectroscopy (NIRs), a non-destructive and efficient technique, has been widely applied to predict droplet size in both O/W and W/O emulsions [39-43]. Among real-time measurement techniques, turbidity spectroscopy (TUS) has proven an effective method for determining particle number and size distribution across various systems [44-46]. TUS offers fast, simple, and non-destructive droplet size measurements, with a linear correlation between scattered light intensity and droplet concentration, making it suitable for quantitative analysis at the sub-micron level. Previous study has demonstrated the effectiveness of TUS in estimating the Sauter mean diameter of oil droplets in RO-water emulsions [20]; however, its applicability to emulsions with oils of distinct physicochemical properties, such as CO, has not been validated. In this study, we extend this approach to estimate the Sauter mean diameter (d32) of CO-water emulsions. Additionally, we further validate the turbidity method for droplet size estimation in CO-water emulsions, demonstrating its reliability across different O/W systems. This validation further highlights the potential of TUS as a real-time monitoring tool for continuous emulsification processes.
2 Experiment Setup and Processing of Experimental Data
The emulsification of CO-water emulsions was carried out using a batch experimental setup, as illustrated in Fig. 1. In this setup, we employed vortex-based HC device with throat diameter (dT) of 3 mm. Experiment setup consists of pen type digital thermometer (ATP Instrumentation ST-10) to monitor the temperature in the holding tank and before the vortex diode (VD) pressure gauge installed (Digitron manometer Model: 2023P7; pressure range: 0–700 kPa) to monitor the pressure during the experiment. The emulsification process was initiated by preparing a coarse dispersion of CO-water.
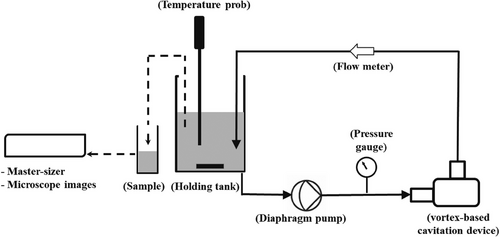
In this study, Tween 20 (MP Biomedicals, LLC, France) was used as the surfactant to produce CO-water (O/W) emulsions at high CO volume fraction. With a HLB value of approximately 16.7, it is well-suited for stabilizing such emulsions. It was incorporated into the continuous phase at a concentration of 2 % (w/v), consistent with our previous RO-water study [20], to investigate the influence of the CO physical properties on the produced CO-water emulsions without altering the surfactant type or concentration. Following the complete dissolution of the surfactant, VCO (Frontier foods, Tesco Ireland) added into continuous phase in holding tank and agitated using magnetic stirrer operated at 300 rpm. In the present experimental work, four different CO volume fractions (0.15, 0.30, 0.45, and 0.60) were considered to examine the impact of oil content on emulsion characteristics. The corresponding bulk density values for different CO volume fraction emulsions are also provided in Tab. 1. The increase in CO volume fraction results in a slight decrease in bulk density, which is attributed to the density difference between CO (974 kg m−3) and water (997 kg m−3). In this study, the term “dense emulsions” refers to CO-water emulsions with a high oil volume fraction. The coarse CO-water emulsion was passed through cavitation unit using diaphragm pump (Sinleader, Model SL-DP-16). To ensure reproducibility, we triplicate each experiment condition and analyze the data. Tab. 1 provides an overview of the material properties and experiment conditions employed in our study. Previous differential scanning calorimetry studies have reported that pure VCO exhibits a melting point of 23.16 °C [21]. Taking this thermal characteristic into account, we maintained a constant temperature of 25 °C throughout our experimental procedures for CO-water emulsion production. This temperature was selected to ensure that the CO remained in a fully liquid state during emulsification, thereby facilitating consistent droplet formation and stability in the emulsion system.
| Description | Value |
|---|---|
| Vortex based cavitation device: | |
| Throat diameter, dT [m] | 0.003 |
| Material properties: | |
| Coconut oil density, ρo [kg m−3] | 974 |
| Coconut oil viscosity, µo [mPa·s] | 37.3 |
| Water density, ρw [kg m−3] | 997 |
| Water viscosity, µw [mPa·s] | 0.7972 |
| Water–coconut oil interfacial tension, γ [mN m−1] | 23.60 [47] |
| Operating condition: | |
| Coconut oil volume fraction, [αo] | 0.15, 0.30, 0.45, 0.60 |
| Temperature, T [°C] | 25 |
| Pressure drop, ΔP [kPa] | 200 |
| Number of passes, n [–] | 1, 5, 20, 100 |
| CO-water emulsion bulk density, [kg m−3] | |
| αo = 0.15 | 987 |
| αo = 0.30 | 974 |
| αo = 0.45 | 962 |
| αo = 0.60 | 953 |
| Surfactant: | |
| Polyoxymethylene (20) Sorbitan Monolaurate (Tween 20) | 2 % |
CO-water emulsion samples were collected from the recirculation tank at predetermined intervals, corresponding to specific numbers of passes through the HC apparatus. The number of passes (interval) was determined using the equation n = Qt v−1, where Q represents the volumetric flow rate through the HC device, Q denotes the total CO-water emulsion volume, and t indicates the duration of flow. To understand the influence of number of passes and CO volume fraction on emulsion DSD, samples were measured using Mastersizer 3000 (Malvern Panalytical Ltd., UK) instrument. To confirm that all produced emulsions exhibit an O/W nature, microscopic imaging and conductivity measurements were performed. The results are discussed in Supporting Information Sect. S1. For the Mastersizer analysis, we input the refractive indices of 1.45 and 1.33 for the CO droplets and the aqueous dispersant, respectively. An absorption index of 0.01 was assumed for the dispersed phase. DSD measurements were conducted in triplicate, with samples under continuous agitation at 2500 rpm. The obscuration level was maintained between 5 % and 10 % for all analyses to ensure optimal instrument response and data reliability [20]. Turbidity of CO-water emulsions was quantified via spectrophotometric analysis, employing a SHIMADZU UV-1800 UV–vis spectrophotometer to measure absorbance at 630 nm. All analyses were performed at ambient temperature, utilizing high-precision quartz glass cuvettes (Hellma Analytics 114-10-40) with a 0.01 m optical path length. Prior to analysis, all emulsion samples underwent a standardized dilution process to 1 % (vv−1) using deionized water containing 2 % TWEEN 20, matching the surfactant concentration used in emulsification. This approach aimed to mitigate coalescence during dilution. We prepared a series of dilutions by adding varying volumes (0.6, 1.0, 1.4, 1.6, and 1.8 mL) of the 1 % emulsion to 25 mL of the surfactant-enhanced deionized water.
Our previous research leveraged a generalized correlation, originally developed by Thaker et al. [48], which establishes a relationship between pressure drop and flow rate for non-Newtonian fluids in vortex-based HC devices. We applied this correlation to estimate the effective viscosity (µeff) of CO-water emulsion, thereby extending its utility to the characterization of emulsions without necessitating extensive rheological analysis. To this end, we obtained experimental flow rate versus pressure drop profiles for CO-water emulsion compositions at a constant temperature of 25 °C. Employing nonlinear optimization techniques, we estimated the effective viscosity for different CO volume fractions of CO-water emulsion, thus characterizing their flow behavior in the context of vortex-based HC devices.
For real-time online or rapid droplet size characterization methods, we previously proposed an approach to estimate the effective diameter (deff) of dispersed phase droplets in RO-water emulsions. Derived from light scattering principles, this method assumes spherical, uniformly distributed droplets with a scattering coefficient of 2. The full derivation, including the relationships among absorbance, turbidity, and DSD, is detailed in our previous publication [20]. Our approach correlates spectrophotometric absorbance measurements with turbidity and relates these to an effective droplet diameter (deff), offering a swift alternative to traditional, time-consuming droplet size analysis techniques. This simplification enables rapid, real-time estimation of droplet size using easily measurable parameters, making it valuable for monitoring emulsion formation. Building upon this foundation, we further developed a novel methodology to estimate the full DSD of O/W emulsions, utilizes artificial neural networks (ANN) to process turbidity data [49]. In the present study, we extended the application of our established methodologies to CO-water emulsions, building upon our original work with RO-water systems. This application allows us to evaluate the robustness and versatility of our methods across different oil types in O/W emulsion systems. The results of this analysis and comparisons with our previous findings for RO-water emulsions are presented in results and discussion section.
3 Result and Discussion
3.1 Droplet Size Distribution (DSD) and Characteristic Droplet Diameters of CO-Water Emulsions
To confirm the formation of dense CO-water emulsions, microscopic images and conductivity measurements were performed, and the results were discussed in Supporting Information Sect. S1. These analyses confirmed that all produced CO-water emulsions retained an O/W structure. Fig. 2 illustrates the evolution of DSD profiles for CO-water emulsions at various oil volume fractions (αo = 0.15, 0.30, 0.45, and 0.60) as a function of number of passes (n = 1, 5, 20, and 100 passes) through an HC device. The DSD exhibit distinct bimodal characteristics across all experimental conditions, with characteristic peaks occurring at approximately 0.7 µm and 5–10 µm. Increasing the number of passes through the cavitation device progressively shifts the overall distribution toward smaller droplet sizes, while simultaneously enhancing the definition of the bimodal nature of the droplet distributions. This effect is particularly evident in the evolution of the smaller droplet peak (0.7 µm), which becomes more pronounced with increased processing. However, population of larger droplets persists even after 100 passes, suggesting a limit to the achievable size reduction through this HC process.
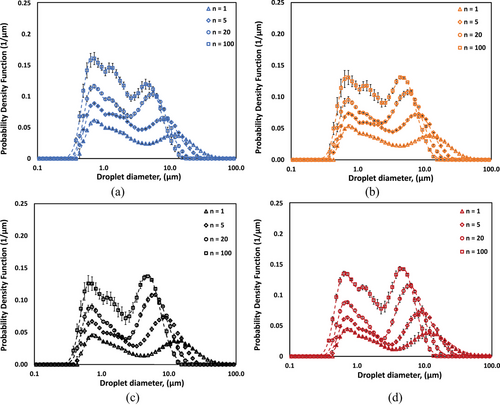
The CO volume fraction (αo) exhibits a strong influence on the DSD characteristics. As αo increases from 0.15 to 0.60, the bimodal nature of the distribution becomes more pronounced, with a notable enhancement in the higher-diameter peak showing increased intensity at n = 100 pass through the homogenizer. This trend is particularly evident at higher pass numbers (n = 5, 20, and 100), where the distinction between the two characteristic peaks becomes more defined. These observations suggest that both number of passes and CO volume fraction play crucial roles in determining the final CO-water emulsion DSD, with the persistent bimodal distribution indicating characteristic mechanisms of droplet formation in the O/W emulsion system under HC emulsification conditions. The experimental DSD profiles were mathematically described using Eq. 1, represented by the fitted lines in Fig. 2a–d. The corresponding fit parameters with characteristic droplet diameters for all experimental conditions are summarized and provided in Supporting Information Tab. S1.
The DSDs of CO-water emulsions as a function of CO volume fraction (αo = 0.15, 0.30, 0.45, and 0.60) for number of passes equal to 1, 5, 20, and 100 as illustrated in Fig. 3a–d. The DSDs consistently exhibit bimodal characteristics, with distinct peaks observed in the ranges of approximately 0.7 and 10 µm. The evolution of DSDs with an increasing number of passes reveals several key features. The initial processing (n = 1–5) results in the most significant changes in the droplet distribution profiles, particularly evident in the increase of the smaller diameter peak. As processing continues (n = 20–100), the bimodal character becomes more pronounced. The peak representing smaller droplets became more prominent, whereas the larger droplet population diminished, reaching a size limit of around 10 µm after 20 passes. This indicates a sufficient size reduction achievable with 20 passes of processing. The influence of CO volume fraction (αo) on DSD characteristics is particularly evident in the relative intensities of the two characteristic peaks. As αo increases from 0.15 to 0.60, both peaks become more distinct, with the larger diameter peak showing enhanced prominence at higher oil volume fraction.
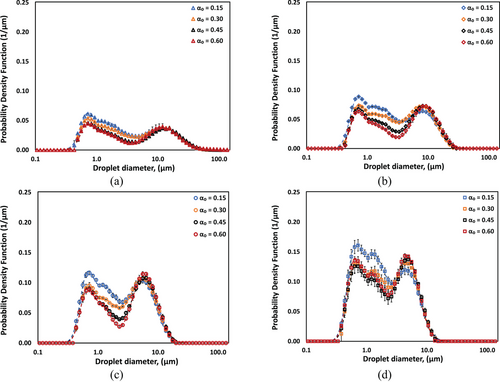
Fig. 4a,b illustrate the comparative DSD of CO-water and RO-water emulsions at oil volume fractions of 0.15 and 0.60, respectively, for both initial (n = 1) and final (n = 100) processing passes. The comparison reveals distinct differences in DSD profile between the two oil types. At αo = 0.15 (Fig. 4a), RO-water emulsions exhibit a distribution skewed heavily toward smaller droplet sizes, whereas CO-water emulsions present a more symmetric, bimodal DSD profile. After extensive processing (n = 100), RO-water emulsions exhibit a more pronounced shift toward smaller droplet sizes, resulting in narrower size distributions. In contrast, CO-water emulsions retain their symmetrical bimodal nature. At higher oil volume fraction (αo = 0.60, Fig. 4b), both systems demonstrate bimodal behavior, though with notable differences in peak characteristics. CO-water emulsions maintain distinct peaks with a significant population of larger droplets (around 10 µm) after 100 passes, whereas RO-water emulsions show less pronounced bimodality and favor smaller droplet formation.
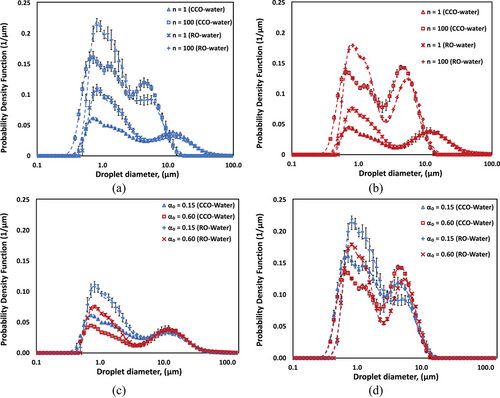
Fig. 4c,d present a comparative analysis of DSDs for CO-water and RO-water emulsions after single pass (n = 1) and extensive processing (n = 100), respectively. For initial processing (Fig. 4c, n = 1), RO-water emulsions exhibit higher probability density values in the smaller droplet range (around 1 µm), particularly at lower oil volume fraction (αo = 0.15). CO-water emulsions, in contrast, show more uniform distribution across both small and large droplet populations, with less pronounced peak intensities. At αo = 0.60, both systems display similar distribution patterns, though RO-water maintains slightly higher probability densities in the smaller droplet region. After extensive processing (Fig. 4d, n = 100), CO-water systems demonstrate well-defined bimodal distributions. However, RO-water emulsions show more pronounced peak at small droplet population, particularly at αo = 0.15.
Fig. 5a illustrates the relationship between Sauter mean diameter (d32) and the number of passes through the HC device for CO-water emulsions at CO volume fractions (αo) of 0.15, 0.30, 0.45, and 0.60. A consistent decrease in d32 with increasing passes is observed across all fractions, indicating progressive droplet refinement. At higher CO volume fractions generally yield larger d32 values, with the most significant size reduction occurring with five passes. Notably, the rate of d32 decrease diminishes as passes increase to 20, suggesting an approach to a minimum achievable droplet size. After 100 passes, d32 converges to values between 2.5 and 3.0 µm for all CO volume fractions. This difference is less pronounced at αo = 0.60, where CO-water emulsions show slightly larger d32 values across all pass numbers, but the gap narrows with number of passes.
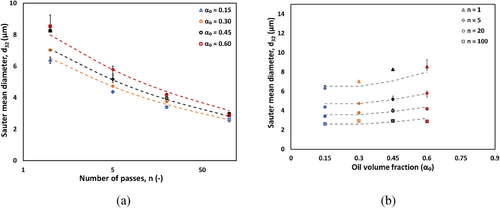
Clear quantitative differences were observed when comparing RO-water emulsions with CO-water emulsion. Comparison with RO-water emulsions at αo = 0.15 and 0.60 shows distinct quantitative differences. RO-water emulsions demonstrate smaller d32 values across all oil volume fractions. For instance, at one pass, the d32 for RO-water at αo = 0.15 is 4.8 µm, compared to about 6.4 µm for CO-water. This difference is less pronounced at higher number of passes, where CO-water emulsions show slightly larger d32 values for CO-water emulsion. Such difference we observed due to difference in DSD profile for RO-water, which skewed toward lower droplet density reflected on d32. However, the present study also shows that capability of hydrodynamics device to achieve smaller droplet size with different oil system with increase intensity (in terms of number of pass).
Fig. 6 presents cumulative droplet size distribution (CDSD) for CO-water emulsions under varying processing conditions and CO volume fractions. Fig. 6a–c illustrate the evolution of CDSDs with increasing number of passes (n = 1, 5, 20, and 100) for CO-water emulsions at different CO volume fractions (αo = 0.15, 0.30, and 0.60, respectively). At the lowest oil fraction (αo = 0.15, Fig. 6a), increasing the number of passes leads to a systematic shift toward smaller droplet sizes, evidenced by the leftward movement of the distribution curves. The most significant change occurs between n = 1 and n = 5, with subsequent passes showing progressively smaller shifts. The distribution curves maintain relatively uniform spacing, suggesting consistent size reduction with increased processing. At intermediate CO volume fraction (αo = 0.30, Fig. 6b), a similar trend is observed, though with slightly broader distributions across all pass numbers. The transition between successive passes remains systematic, indicating droplet size reduction despite the increased oil content. At the highest oil fraction (αo = 0.60, Fig. 6c), the impact of processing is most pronounced. While maintaining the general trend toward smaller sizes with increasing passes, the distributions show greater spacing after 1 pass, particularly in the median diameter range (5–20 µm). This suggests that higher CO volume fraction require more intensive processing to achieve comparable size reductions.
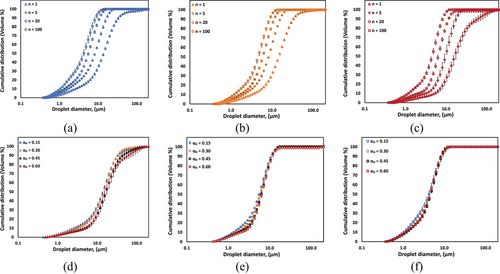
Fig. 6d–f compare the CDSDs across all CO volume fractions (αo = 0.15, 0.30, 0.45, and 0.60) at specific number of passes (n = 1, 20, and 100 passes, respectively). At initial processing (Fig. 6d, n = 1), the distributions show distinct differences across oil fractions. Lower oil fractions (αo = 0.15, 0.30) exhibit a slightly higher proportion of smaller droplets in the 1–10 µm range, whereas higher oil fractions (αo = 0.45, 0.60) show broader distributions skewed toward larger droplet sizes. With intermediate processing (Fig. 6e, n = 20), the distributions begin to converge, particularly in the median diameter range (7–15 µm). The influence of oil volume fraction becomes less pronounced, though some variations persist in the lower diameter region (1–5 µm), with lower oil fractions maintaining a slightly higher proportion of smaller droplets. After extensive processing (Fig. 6f, n = 100), the distributions demonstrate significant uniformity across all oil fractions. The curves nearly overlap throughout the entire size range, indicating that prolonged processing through the HC device effectively normalizes the DSD regardless of initial oil concentration. Minor variations in the distributions below 10 µm suggest that oil volume fraction retains a subtle influence on the final emulsion microstructure, even after extensive processing.
3.2 Effective Viscosity of CO-Water Emulsions
The measured pressure drop characteristics of CO-water emulsions through the HC device after 100 passes are shown in Fig. 8. The pressure drop (ΔP) was measured as a function of throat velocity (VT) for different CO volume fractions (αo = 0.15–0.60). For all CO volume fractions emulsion, the pressure drop increases non-linearly with increasing throat velocity, following the expected trend. However, at any given throat velocity, the pressure drop systematically decreases with increasing CO volume fraction. For instance, at VT ≈ 3 m s−1, the pressure drop decreases from approximately 193 kPa at αo = 0.15 to 96 kPa at αo = 0.60. This behavior, though seemingly counterintuitive given that higher oil fractions typically increase viscosity, can be explained through the relationship between Euler number and Reynolds number in vortex-based HC devices. The effective viscosity (µeff) of the emulsions was estimated using the correlation developed by Thaker et al. [48], with the fitted results showing good agreement with experimental data (shown by dashed lines). The good agreement between experimental data and fitted curves (based on adjusted effective viscosity) validates the applicability of the Thaker et al. [48] correlation for predicting pressure drop characteristics in CO-water emulsion systems.
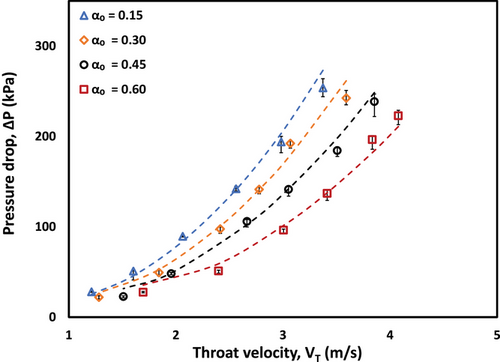
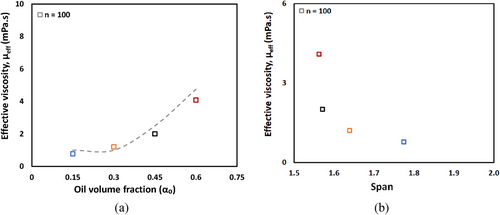
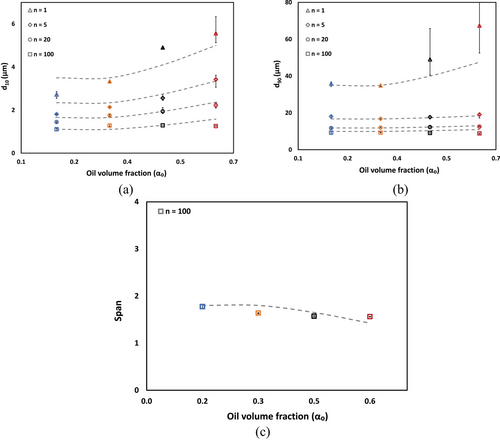
Fig. 9b reveals correlation between effective viscosity and the span of DSD of CO-water emulsions system. A reduction in span from 1.8 to 1.6 corresponds to a significant increase in effective viscosity from 0.8 to 4.1 mPa s, similar observation was also reported [51]. This trend can be attributed to the distribution of droplet sizes within the emulsion. Emulsions with larger span values contain a broader mixture of droplet sizes, where the presence of smaller droplets among larger ones may facilitate flow by acting as lubricating agents, thereby reducing the effective viscosity. Conversely, emulsions with smaller span values exhibit more uniform droplet sizes, limiting this lubricating effect and resulting in higher effective viscosity values.
3.3 Turbidimetric Analysis of CO-Water Emulsions
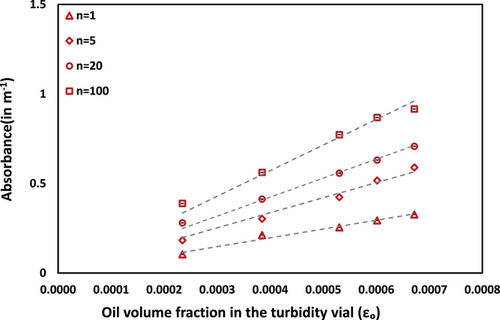
Visible light absorbance data were obtained for CO-water emulsion with CO volume fraction αo = 0.60 at a wavelength of 630 nm. The measured values of absorbance as a function of the CO volume fraction in the measurement vial (ϵo) containing CO-water emulsions obtained for different number of passes (n = 1, 5, 20, and 100) are shown in Fig. 10. The data demonstrates a clear linear relationship between absorbance and εo for all pass numbers, with correlation coefficients (R2) of about 0.99. This robust linearity at αo = 0.60 validates the measurement approach and eliminates the need for additional measurements at lower oil volume fractions (αo = 0.15, 0.30, and 0.45). The measured absorbance data was further utilized to estimate the effective diameter of oil droplets through established turbidity relationships, with detailed calculations provided in the Supporting Information section.
3.4 Emulsification Efficiency of CO-Water Emulsion
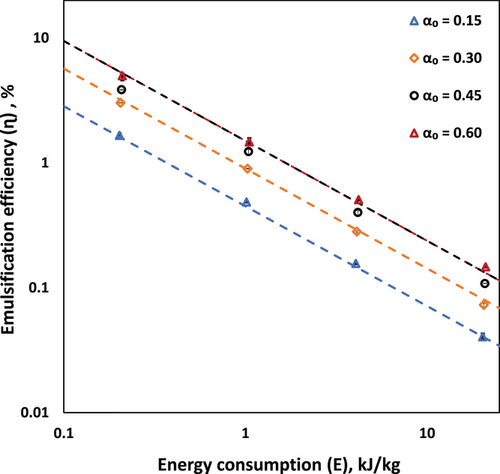
The value of parameter C and C′ in these equations was found to be 3 and 1.5, respectively. These empirical correlations effectively capture the system behavior, where the emulsification efficiency initially shows linear dependence on oil volume fraction but becomes independent of it beyond the critical concentration. The inverse relationship between emulsification efficiency and energy remains consistent across all oil volume fractions, suggesting a fundamental characteristic of the droplet breakage mechanism in the vortex-based HC device.
4 Conclusions
- The DSD analysis showed a bimodal pattern in the CO-water emulsions. Multiple passes through the cavitation device progressively refined the droplet sizes, though the bimodal nature persisted after extensive processing.
- The Sauter mean diameter (d32) exhibited a two-regime behavior with respect to CO volume fraction, with a critical transition point at αoc = 0.35. Below this critical oil volume fraction, d32 remained independent of oil volume fraction, whereas above it, d32 increased linearly with CO volume fraction. The finding agrees with earlier study on RO-water emulsions.
- The effective viscosity of CO-water emulsions showed a significant dependence on oil volume fraction. The effective viscosity increased five-fold across the studied oil fraction range from 0.8 mPa s at αo = 0.15 to 4.1 mPa s at αo = 0.60.
- Turbidimetric analysis at αo = 0.60 showed linear correlations between absorbance and oil volume fraction in measurement vials, which will be useful for rapid estimation of the Sauter mean diameter of CO-water emulsions.
- The energy consumption analysis revealed that emulsification efficiency decreased with increasing energy input following relationship (η∝E−0.8). The emulsification efficiency is linearly proportional to oil volume fraction up to critical oil volume fraction (αoc); beyond which it becomes independent of oil volume fraction.
These findings provide new data on CO-water emulsions generated using a vortex-based HC device. The presented results and correlations will provide useful foundation for extending the application of vortex-based HC devices for producing emulsions relevant for personal care applications.
Supporting Information
Supporting information for this article can be found under DOI: https://doi.org/10.1002/ceat.70015.
Acknowledgments
This publication has emanated from research conducted with the financial support of Taighde Eireann-Research Ireland under Grant number 20/FFP-A/8518.
The authors have declared no conflict of interest.
Symbols used
-
- d10
-
- [µm]
-
- d32
-
- [µm]
-
- d50
-
- [µm]
-
- d90
-
- [µm]
-
- dT
-
- [mm]
-
- deff
-
- [m]
-
- dx
-
- [µm]
-
- E
-
- [J Kg−1]
-
- n
-
- [–]
-
- ΔP
-
- [kPa]
-
- Q
-
- [m−3s]
-
- T
-
- [°C]
-
- t
-
- [s]
-
- V
-
- [m3]
-
- VT
-
- [ms−1]
Greek letters
-
- αo
-
- [–]
-
- εo
-
- [–]
-
- Γ
-
- [mNm−1]
-
- Η
-
- [%]
-
- µ
-
- [mPa s]
-
- µeff
-
- [mPa s]
-
- ρ
-
- [kg m−3]
-
- Τ
-
- [m−1]
Subscript
-
- C
-
- [–]
-
- m
-
- [–]
-
- o
-
- [–]
-
- w
-
- [–]
Abbreviations
-
- ANN
-
- artificial neural networks
-
- CDSD
-
- cumulative droplet size distribution
-
- CO
-
- coconut oil
-
- DSD
-
- droplet size distribution
-
- HC
-
- hydrodynamic cavitation
-
- LNF
-
- log-normal function
-
- MCFA
-
- medium-chain fatty acids
-
- PDF
-
- probability density function
-
- PDW
-
- Photon Density Wave
-
- RO
-
- rapeseed oil
-
- TUS
-
- turbidity spectroscopy
-
- VAP
-
- value-added products
-
- VCO
-
- virgin coconut oil
-
- VD
-
- vortex diode


