Insights into CO2 Hydrogenation to DME: In Situ DRIFTS Study of Reaction over Cu/ZSM-5 Catalyst
Abstract
This study has employed in situ diffuse reflectance infrared Fourier transform spectroscopy (DRIFTS) to generate mechanistic insights into CO2 hydrogenation to dimethyl ether (DME) via methanol (MeOH) formation followed by dehydration. DRIFTS spectra were captured in situ using low loading Cu/ZSM-5, at temperatures ranging from 100 to 300 °C and pressures of 1–25 bar. MeOH peaks were identified at 1005, 1031, and 1056 cm−1, whereas DME peaks appeared at 1464, 1228, 1192, and 1120 cm−1. Enhanced selectivity for DME was observed at 25 bar and 250 °C, favoring the formate pathway, with monodentate formate peaks at 1482 and 1350 cm−1. DRIFTS data were collected for CO2 flow only and a 20 % CO2/H2 mixture (1:4) at 25 bar and 250 °C to study the reaction mechanism over time.
1 Introduction
The role of CO2 emission as a primary driver of climate change has encouraged an urgent need to take effective actions to reduce these emissions and implement strategies for their capture and conversion [1]. One promising pathway is CO2 hydrogenation, a process that partly addresses environmental concerns and exploits CO2’s potential as a valuable resource [2]. In this context, the conversion of CO2 into valuable energy sources, including high-value hydrocarbons like methane (CH4), methanol (MeOH), dimethyl ether (DME), and dimethyl carbonate (DMC) has emerged as alternatives [3]. Along the line, DME (CH3OCH3) stands out as an environment-friendly ether with nontoxicity and noncorrosive features and offers a range of advantages as a fuel source [4]. DME is known for its use as (a) a propellant in aerosol cans for household liquid petroleum gas (LPG) replacement, (b) fuel cell applications, and (c) an intermediate feedstock for various chemicals [4, 5]. In addition, DME exhibits low emissions and has a high cetane number, leading to more stable combustion, which results in lower gaseous pollutants. Due to its high energy content (28.8 Mj kg−1) and autoignition characteristics, it can be used as a transportation fuel, alternative to diesel fuel [6]. The major market players in DME production are Zagros Petrochemical Industry (Iran), Oberon Fuels (USA), Jiutai Energy Group (China), Grillo Werke (Germany), Mitsubishi Corporation (Japan), China Energy Limited, Royal Dutch Shell, and Nouryon [7]. In 2023, the DME market size was USD 6 billion, which is expected to increase to USD 13 billion with an annual growth rate (CAGR) of 12.35 % [7]. The DME industry is experiencing significant growth, with increasing focus on refining the CO2 hydrogenation process to optimize DME production and enhance overall process efficiency.
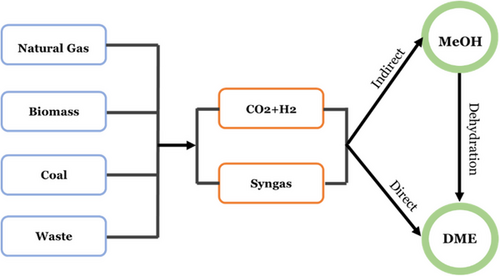
From the above, it is evident that the production of DME is more favorable at low temperature and high pressure. However, there is a complication due to CO2 being very stable and unreactive at low temperatures (<200 °C) [12]. In addition, the reaction temperature above 200 °C will generate more CO alongside MeOH and DME due to the endothermic RWGS reaction [13]. Previous researchers also found out that ratio of H2 to CO2 in between 1:3 and 1:4 has a beneficial effect on the reaction to produce DME from CO2 [3, 14-16].
To enhance the efficiency of DME, apart from considering the reaction conditions, catalysts play a pivotal role in the process of CO2 hydrogenation. Various catalysts have been designed to influence the conversion of CO2 into MeOH and subsequently into DME [17]. The most practical catalyst for achieving high selectivity is copper (active phase) over ZSM-5 (acidic support) [18-23]. Moghaddam and Hazlett [5] explored that CuO/ZnO/Al2O3 with nano-sized hollow ZSM-5 zeolites led to a DME selectivity of 74 % in a fixed bed reactor operated at T = 225 °C and P = 30 °bar. Bonura et al. [8] proposed a hybrid Cu/Zn/Zr/FER system for the synthesis of DME via catalytic hydrogenation of CO2, achieving CO2 conversion of 23.6 % and selectivity values to DME, MeOH, and CO of 47 %, 15 %, and 38 %, respectively. Cu/Zn/Zr with MFI-type zeolites were also evaluated in a fixed bed reactor under the condition of T = 240 °C and P = 40 bar, exhibiting high catalytic performance and DME selectivity about 80 % [24]. In case of acidic support, according to prior research, ZSM-5 demonstrates higher levels of selectivity in DME synthesis [25-29]. ZSM-5 acts as an acidic support, enabling the conversion of MeOH to DME through the interaction of its Brønsted and Lewis acid sites. MeOH initially adsorbs onto these sites, where Brønsted acid sites protonate the molecules, forming surface-bound methoxy groups (CH3O+) that act as reactive intermediates. A second MeOH molecule then adsorbs nearby, with Lewis acid sites facilitating its activation and alignment for the reaction. The MeOH reacts with the methoxy group, producing DME (CH3OCH3) and water. The synergy between Brønsted and Lewis acid sites is crucial for the catalytic process.
Unraveling the influence of catalysts on reactions and their pivotal role in generating products requires a mechanistic understanding of the dynamic interactions occurring between reactants and catalyst's surface. Although substantial research has focused on finding new catalysts with numerous experiments, a noticeable gap remains in understanding the primary mechanism reaction pathways. This research seeks to address this gap by investigating the mechanism pathways and key intermediate species involved in the process of converting CO2 to DME using in situ and high-pressure diffuse reflectance infrared Fourier transform spectroscopy (DRIFTS) analysis, following the aims of (a) pressure and temperature effects on hydrogenation reaction, (b) catalytic and non-catalytic CO2 hydrogenation, (c) intermediate species confirmation, and (d) establishment of the primary mechanism pathways.
Direct CO2 hydrogenation to DME using bifunctional catalysts offers an efficient industrial solution by integrating MeOH synthesis and dehydration into one step, reducing reactor size, energy use, and process complexity. In situ DRIFTS provides real-time insights into reaction pathways and intermediates, enabling precise optimization of catalysts and reaction conditions to improve DME selectivity. These findings will guide the scale-up of high-pressure continuous-feed reactors, linking research to industrial applications. By enhancing control over reaction mechanisms and supporting kinetic model development, in situ DRIFTS accelerates the transition to sustainable CO2 utilization technologies.
2 Materials and Methods
2.1 Materials and Catalyst Preparation
Feedstock: The experiment involved gas cylinders: (a) high-purity CO2/H2 mixture in a 1:4 ratio (Air Liquide), (b) pure CO2 gas, (c) 5 % volume H2 balanced with N2, and (d) pure N2 gas.
Catalyst: A low loading 2 wt %-Cu/ZSM-5: The catalyst was prepared using the incipient wetness impregnation method. First, 150 mg of Cu (NO3)2·2.5H2O (99.9 % Sigma Aldrich) was added into 20 mL of deionized water and agitated at 60 °C with the stirring speed of 400 RPM for 2 h. Subsequently, the solution was gradually added onto the ZSM-5 powders (industrial zeolite, Si/Al = 18 mol mol−1; SA = 243 m2 g−1; PV = 0.13 cm3 g−1; Pore size 7.8 A) in multiple stages with a 30 min drying period at 90 °C between each stage to ensure a high dispersion of Cu. Then, the sol–gel was oven-dried at 90 °C overnight before being subjected to calcination at 360 °C for 4 h.
2.2 Catalyst Characterization
2.2.1 X-Ray Powder Diffraction (XRD)
2.2.2 Scanning Electron Microscopy Energy-Dispersive X-Ray Spectroscopy (SEM–EDX)
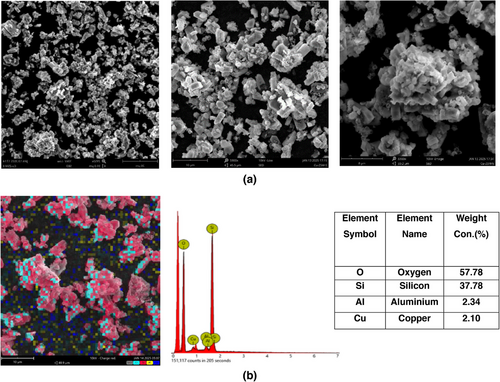
Scanning electron microscopy energy-dispersive X-ray spectroscopy (SEM–EDX) analysis was employed to investigate the sample's morphology and the dispersion of elements. The microstructural characteristics of low loading 2 wt %-Cu/ZSM-5 sample were captured using a benchtop Phenom XL scanning electron microscope (S/N: MVE 033310-0151-L). The energy dispersive X-ray spectroscopy (EDX) is used to investigate the dispersion of Cu on the sample's surface.
2.2.3 In Situ Diffuse Reflectance Infrared Fourier Transform Spectroscopy (DRIFTS)
The experimental process involved recording spectra by averaging 64 scans within a wavenumber range of 400–4000 cm−1, with a scan rate of 4 cm−1. Before that, the catalyst was reduced at 300 °C at 5 vol % of H2 environment for 2 h (ramping rate of 4 °C min−1). Afterward, the catalyst was cooled down to room temperature. The gas flow was switched to the mixture of CO2/H2 at a ratio of 1:4 in the pressurized closed system. The experiments were conducted, and the spectra were recorded under varying temperatures (ranging from 100 °C to 300 °C) and pressures (1, 10, 15, 20, and 25 bar). Before the main experiments, liquid MeOH (99.9 % Sigma Aldrich) and DME gas (99.9 % Sigma Aldrich) were used to analyze the DRIFTS background of products.
3 Results and Discussion
3.1 Catalyst Characterization
As depicted in Fig. 2, the phase composition was determined, highlighting the presence of Cu content within the sample. The initial depiction in the figure showcases the XRD pattern of pure ZSM-5, where the dominant peak observed at 23° is attributed to ZSM-5. Importantly, distinct peaks corresponding to copper species are evident at specific angles: 35.5° (CuO (0 0 2)), 38° (CuO (1 1 1)), and 48.7° (CuO (2 0 0)) (JCPDSNo.48-1548) indicating Cu is dispersed on ZSM-5 with particle size of 19 nm. The impregnation method demonstrated a superior dispersion of copper [32, 33]. Moreover, the stepwise approach employed in adding the Cu solution to ZSM-5 resulted in a more effective impregnation of copper onto the ZSM-5 substrate. However, the NH₃-TPD (temperature-programmed desorption) results indicate a slight reduction in the acidity of ZSM-5, decreasing from 1.39 to 1.32 mmol g−1 upon the introduction of copper to the support.
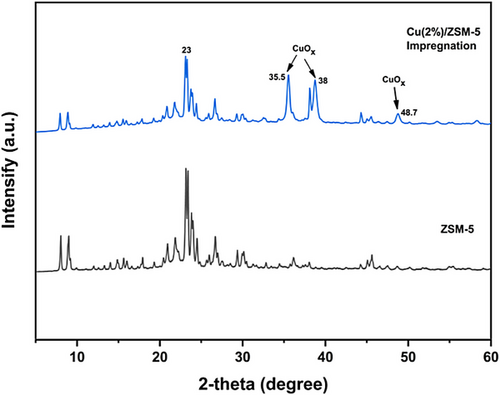
Fig. 3 illustrates the morphology of sample with 2 % copper dispersed on surface of ZSM-5 with irregular small crystal aggregates across the ZSM-5 surface. Fig. 3a displays the morphology of ZSM-5, which appears to consist of uniformly large micro-blocks and smooth surfaces in the shape of hexagonal block structure. The zeolitic structure could be due to distribution of Si and Al elements, whereas Cu is deposited near the surface of ZSM-5 in dot-like after impregnation synthesis. The surface of Cu/ZSM-5 exhibited rough and fractured areas, which changed the pore structure of the catalyst, consequently enhancing the surface adsorption and internal diffusion of reactants. The EDX image and spectrum in Fig. 3b,c show the uniform distribution of copper over ZSM-5.
3.2 In Situ DRIFTS Analysis of Pure MeOH and DME: Background Signals
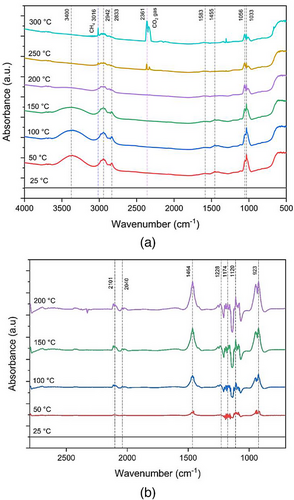
In situ DRIFTS analysis gives a deeper understanding of the CO2 hydrogenation main reaction pathways on the low loading of Cu/ZSM-5 catalyst. In order to establish a baseline for these products, the spectral data were acquired using liquid MeOH (99.9 % purity) and DME gas (99.9 % purity). In the case of liquid MeOH, it was introduced with pure N2 gas, whereas DME was introduced to the system with a flow rate of 100 mL min−1 to maintain the pressure remained constant at 1 bar, whereas the system's temperature was progressively raised from 25 °C to 300 °C. Fig. 4 displays the spectra of MeOH and DME in the temperature range of 25–300 °C, at 1 bar pressure. As the autoignition temperature of DME is around 250 °C, 200 °C was set as the highest temperature to record DME spectra. These DRIFTS spectra were examined to facilitate analyzing the spectral data of the CO2 hydrogenation under actual operating conditions. In Fig. 4a, the most prominent MeOH spectrum peaks were observed at 3400, 2942, 2833, 1583, 1455, 1056, and 1033 cm−1. When the temperature rises beyond 250 °C, two peaks at 3016 and 2361 cm−1 are observed. These peaks indicate the existence of methane (CH4) and CO2 at high temperature [34]. The peaks at these wave numbers intensify as the temperature increases. Fig. 4b shows that DME spectra were observed at 2101, 2040, 1464, 1228, 1174, 1120, and 923 cm−1. All these peaks are double checked and determined in the database NIST Chemistry WebBook (http://webbook.nist.gov/chemistry/).
3.3 In Situ DRIFTS Analysis of CO2 Hydrogenation: Catalytic and Non-Catalytic
In order to gain insights into the direct synthesis of DME from CO2 hydrogenation, in situ DRIFTS experiments analysis was conducted over a low loading of Cu/ZSM-5 catalyst. This analytical approach was carried out over a temperature ranging from 100 °C to 300 °C, and pressure was at 1, 10, 15, 20, and 25 bar.
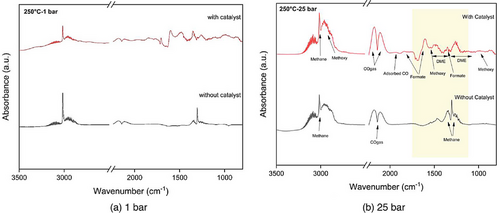
In Fig. 5, DRIFTS spectra were obtained during the CO2 hydrogenation reaction (a) without and (b) with the catalyst. The spectra were recorded over a temperature range of 100–300 °C at 1 bar. During the reaction, there are observable bands distributed across two distinct regions. One set of bands falls within the range of 4000–2500 cm−1, whereas another set emerges between 2500 and 1000 cm−1. The bands found in the first region are linked to hydroxyl groups and hydrocarbons, and they coincide with the formation of water and methane in the gas phase [35]. In Fig. 5a without catalyst, no formate species are seen in DRIFTS results; however, at high temperatures, methane formation occurs, showing characteristic peaks at 1338 and 1352 cm−1. In contrast, Fig. 5b with a catalyst displays various peaks (3715, 3660, 3610, 3016, 2180, 2112, 1707, 1600, 1480, 1346, and 1160 cm−1). The detected peaks correspond to various species, including formate, methoxy, and carbonate [28, 34-37]. The peaks at 2960, 2820, 1180, and 1150 cm−1 are linked to methoxy components [38, 39]. Additionally, signals observed at 1352 and 1338 cm−1 suggest the presence of bidentate and monodentate carbonates with different levels of attachment on the underlying substance, whereas signals at 1367, 1083, and 1050 cm−1 indicate the presence of polydentate carbonates [38]. Furthermore, the peaks at 2180 and 2120 cm−1 are attributed to gas-phase CO show the occurrence of RWGS reaction. The peak at 1751 and 1600 cm−1 corresponds to bidentate formate, whereas peaks at 1482 and 1350 cm−1 represent monodentate formate species [34, 38, 40]. The peak at 2300 cm−1 shows the presence of CO2 gas [38, 41].
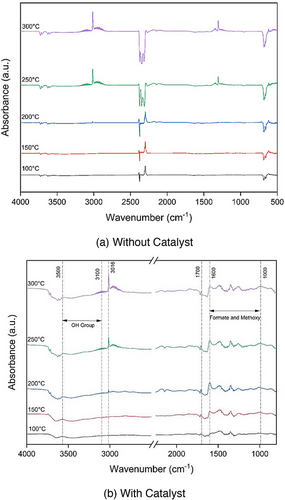
The broad peak in 3000–3500 cm−1 is attributed to the OH group [35]. The peaks observed at 3016 cm−1 in the DRIFTS spectra are indicative of C─H stretching vibrations typically associated with alkanes, suggesting the presence of methane (CH4), which implies the presence of saturated hydrocarbons [35, 36, 40, 42]. Remarkably, as the temperature increases above 200 °C, small peaks around 3100 cm−1 are observed. This aligns with the characteristic stretching vibrations of alkenes, indicating the possible formation of unsaturated hydrocarbons or the transformation of methane into other hydrocarbon species with double bonds [36]. The peak observed in the range of 1650–1700 cm−1 in the DRIFTS spectra corresponds to the C═C stretching vibrations, typically associated with alkenes [36, 43]. Initially, as the temperature increases, the intensity of this peak gradually becomes prominent (Fig. 5b), indicating the formation of alkenes.
3.4 Monitoring Reaction Intermediates by In Situ DRIFTS
In this section, intermediate species such as formate, methoxy, and carbonate are analyzed through DRIFTS under different temperature and pressure conditions. In Fig. 6a–d, the DRIFTS spectra were recorded during the CO2 hydrogenation reaction using a Cu (2 %)/ZSM-5 with higher pressure at (a) 10 bar, (b) 15 bar, (c) 20 bar, and (d) 25 bar. The formate peaks at 1600, 1482, and 1350 cm−1 are more pronounced suggesting higher pressure led to generate more intermediate species (Fig. 6d). The peak at 1600 cm−1 belonged to (HCOO─Cu), representing the stretching vibration of bidentate formate species. The peaks observed at 1464, 1248, and 1112 cm−1 are a result of the presence of methoxyl (CH3O─Cu) [28]. Peaks in the range of 1000–1180 cm−1 align with MeOH, whereas those from 1100 to 1200 cm−1, and 1464 to 1520 cm−1 correspond to DME. In the spectral range of 2100–1900 cm−1, distinct and strong bands correspond to metallic carbonyl species (C═O). Specifically, a band in the range of 2020–2030 cm−1 signifies linear CO coordination on metal sites (Cu°–CO), whereas a vibrational mode at 1920 cm−1 suggests the presence of bridging carbonyls ((Cu°)x–CO).
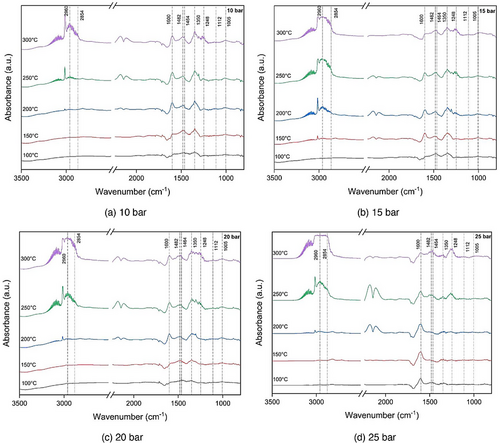
Fig. 6 depicts how raising the temperature up to 250 °C enhances the intensification of formate and methoxy within the 1100–1600 cm−1 range. However, beyond 250 °C, this trend reverses, suggesting that the reasonable temperature range for CO2 hydrogenation to DME was around 250 °C. DRIFTS results in Fig. 6d show that formate species are easy to be generated and difficult to decompose to CO during the reaction process. Up to the reaction temperature 250 °C, there is a rapid production of formate with low intensity, whereas the conversion of formate to methoxy is not prominent. However, at 250 °C, formate species can be rapidly hydrogenated by active hydrogen to form methoxy groups. To sum up, the main step in the reaction, as observed in the DRIFTS spectra, was the conversion of formate (HCOO) into methoxy (CH3O), followed by the transformation into CH3OH. Fig. 6 also illustrates that at all pressure studied here, and the primary peaks associated with carbonate and formate species become prominent above 250 °C. These results revealed that the optimal temperature for the CO2 hydrogenation process to yield DME is 250 °C.
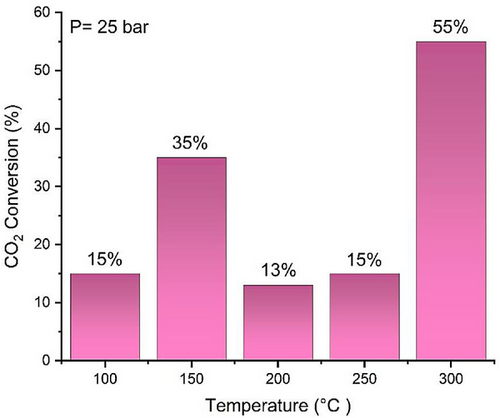
As shown in Fig. 6, higher pressure improves CO2 hydrogenation performance. To further evaluate CO2 conversion at 25 bar across various temperatures, the conversion was determined by integrating the CO2 peak intensity and is presented in Fig. 7. The results confirm that 250 °C is the optimal temperature, achieving 15 % CO2 conversion with a higher concentration of intermediates to produce MeOH and DME. Although the CO2 conversion at 300 °C is slightly higher, the peak analysis indicates increased methane formation compared to intermediate species. Additionally, from a single experiment conducted in a high-pressure fixed bed reactor at P = 25 bar and T = 250 °C, the selectivity was found to be 53.6 % for CH4, 39.8 % for C2H₆, 4.8 % for DME, with the remaining portion attributed to other by-products. The future research will focus on designing bifunctional catalysts to enhance the selectivity toward DME.
3.5 Influence of Pressure on Intermediate Species
As described in the previous section, 250 °C was the optimized temperature to generate favorable intermediate species for DME production. As such, to understand the effect of pressure, the 250 °C temperature was selected as the base case. Fig. 8 depicts how altering pressures affect the conversion of CO2 into DME at 250 °C. At reduced pressure, the peaks associated with methoxy were absent, whereas with an increase in pressure, these peaks became evident at 2960 and 2820 cm−1. Furthermore, the signal observed at 1464 cm−1, which is associated with DME, exhibits an upward trend as the pressure rises. With increasing the pressure (10–25 bar), the peaks at 1600 and 1482 cm−1 related to formate species were increased. The peak at 1350 cm−1 (monodentate formate) initially increased until 20 bar and then decreased at 25 bar which leads to its conversion to methoxy. This shows that monodentate formate exhibits lower stability compared to other formate species and fast hydrogenation to methoxy [39, 44]. Moreover, a slight shift at peak 1600 cm−1 observed when the pressure is increased to 25 bar. This shift aligns with the characteristic stretching vibrations of formate species. With high pressure at 25 bar, the intensity of formate and methoxy peaks reach to their highest level which resulted in higher production of MeOH and DME. Moreover, CO gas peaks are characterized at 2180 and 2110 cm−1 which progressively increased with rising pressure up to 25 bar. The methane peak at 3016 cm−1 is remained constant above 15 bar pressure.
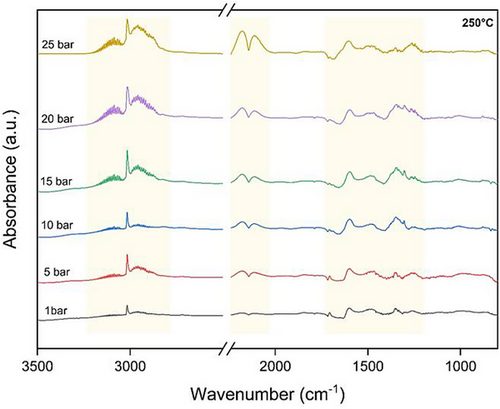
From these results, it can be concluded that the optimized operating conditions of 25 bar pressure and 250 °C temperature promote the formate pathway, thereby contributing significantly to the production of MeOH and DME.
3.6 Intermediates Species Study in Optimal Conditions: Catalytic and Non-Catalytic
Fig. 9a,b shows a comparison of DME and MeOH formation reaction (a) without and (b) with catalyst at two distinct pressures: 1 and 25 bar, at 250 °C. Compared to 1 bar, at pressure of 25 bar with catalyst, CO (2180 and 2100 cm−1), formate (1600 cm−1), methoxy (1463 cm−1), MeOH (1056, 1031, and 1015 cm−1), and DME (1228 and 1192 cm−1) related peaks will be intensified. This observation confirms that higher pressure positively impacts the rate of CO2 hydrogenation. Furthermore, in the absence of a catalyst under 1 and 25 bar conditions, the spectra lack prominent peaks corresponding to intermediate species, as well as the subsequent peaks indicative of DME and MeOH. The wavenumbers corresponding to the observed peaks are documented in Tab. 1. The peaks found in the DRIFTS spectra in Fig. 8b are attributed to MeOH and DME based on the previous studies [28, 43, 45]. Moreover, these peak assignments are according to the IR spectra of water, MeOH, and DME shown in the database NIST Chemistry WebBook (http://webbook.nist.gov/chemistry/).
| Wavenumber [cm−1] | Assignment | References |
|---|---|---|
| 3670, 3568 | Type I OH groups | [34] |
| 3750 | Type II OH groups | [34] |
| 3016 | C─H stretching-methane (CH4) | [34, 40] |
| 2960, 2820 | C─H stretching-methoxy | [48] |
| 2854, 2720 | Formate (HCOO) | [45] |
| 2180, 2110 | Gas-phase CO | [45] |
| 1920 | Adsorbed CO | [46] |
| 1352 | Bidentate carbonate () | [49, 50] |
| 1510, 1338 | Monodentate carbonate () | [49] |
| 1367, 1083, 1050 | Polydentate carbonate | [49] |
| 1600 | Bidentate formate (b-HCOO) | [28, 50] |
| 1482, 1350 | Monodentate formate (m-HCOO) | [38] |
| 1150, 1180, 1463 | Methoxy (CH3O) | [28, 49, 51] |
| 1112, 1056, 1031, 1005 | Methanol (CH3OH) | [45] |
| 1464, 1248, 1228, 1192, 1120 | DME (CH3OCH3) | [45] |
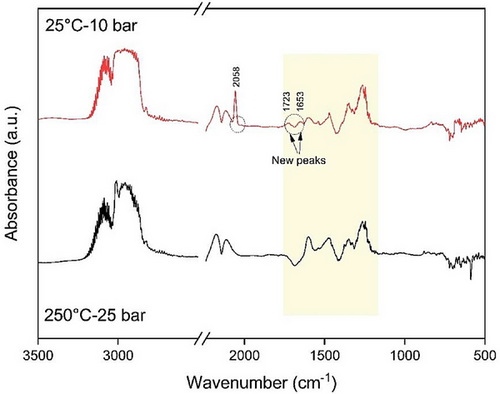
To confirm the formation and persistence of intermediate species, MeOH, and DME, the experiment was conducted at 250 °C and 25 bar, followed by cooling to room temperature. However, due to the stoichiometry of the overall reaction in the CO2 hydrogenation to DME (see Eq. 1), the pressure dropped as the reaction progressed toward the right side, reaching 10 bar. Consequently, the DRIFTS results were recorded at 25 °C and 10 bar after the cooling step. Fig. 10 illustrates the results, indicating that both the intermediates, MeOH and DME, persisted even after the temperature decrease, with the appearance of new peaks. The new peak at 2058 cm−1 can be attributed to CO adsorbed on Cu which is produced from the RWGS reaction at lower temperatures [46]. The other new peak at 1723 cm−1 is aligned to C═O stretching vibration, and the peak at 1653 cm−1 is related to adsorbed water [47]. The results showed that intermediate species, MeOH, and DME persist during the reaction.
3.7 Formate, Methoxy, and Carbonate Roles in Mechanism Pathway
In order to gain insight into mechanism pathways and the role of intermediate species, DRIFTS experiments were carried out in the presence of CO2 and CO2/H2 with ratio of 1:4 at 250 °C and 25 bar (Fig. 11). With the exposure of the active metals to CO2 flow, the peaks at 983, 1116, 1261, 1352, 1482, 1510, 1564 and 1646 cm−1 were appeared as adsorbed bicarbonates (HCO3) and carbonate (). The peak at 1510 cm−1 is monodentate carbonate and the one at 1352 cm−1 is bidentate carbonate. The peaks at 1950, 1855, and 2052 cm−1 are the adsorbed CO. With flowing CO2/H2, adsorbed CO at 1950 cm−1, which has low stability, shift toward lower frequency at 1920 cm−1 due to electron transfer of H─CO through Cu surface. This CO adsorbed at 1920 cm−1 has a longer surface lifetime but with a weak C─O bond that reacts with dissociated H atoms to generate methane which appeared at peak 3016 cm−1 [44]. There was hardly any decrease in CO band 1837 and 1939 cm−1intensities of adsorbed bicarbonates decreased, but the CO band 1837 and 1939 cm−1 hardly decreased, which is adsorbed on Cu.
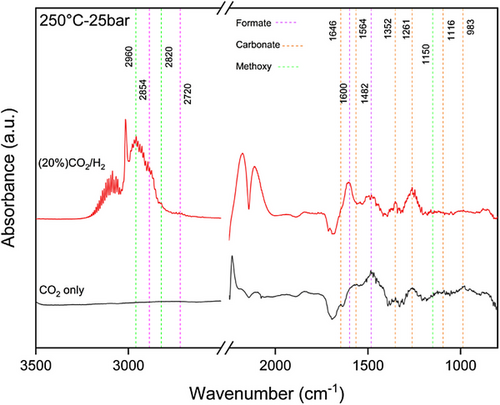
Additionally, the peaks at 983, 1116,1482, 1564, and 1646 cm−1 decreased, whereas peaks at 1261, 1352, and 1600 cm−1 increased and new peaks at 2854 and 2720 cm−1 as formate species and at 2960 cm−1 and 2820 cm−1 as methoxy species were generated. It also indicated that carbonate rapidly reacts with H to form formate and formate gradually was converted to methoxy; hence, methoxy is generated from hydrogenation of formate species [50, 52]. Monodentate formate at 1482 and 1350 cm−1 is less stable than bidentate formate and is more active which can be a key intermediate to decompose to methoxy and CH3OH on catalyst which is in good agreement with DME production [44]. As a result, formate is the important intermediate species in producing MeOH and subsequently DME.
3.8 Main Mechanism Pathways in CO2 Hydrogenation to MeOH and DME
-
In Step 1, CO2 is adsorbed via metal oxide to generate MeOH, and its activation follows two pathways, as below [54]. The simple concept is illustrated in Fig. 12.
-
Formate pathway: When CO2 directly combines with H atom from H2, it produces formate molecules (HCOO*), which then generate methoxy (CH3O*) and with further hydrogenation produce MeOH (CH3OH).
-
RWGS pathway: CO2 is transformed into CO and subsequently into MeOH through hydrogenation intermediates.
-
-
In Step 2, the MeOH-to-DME dehydration step, two main mechanism pathways are as follows:
- MeOH associate mechanism: Two co-adsorbed MeOH molecules associate into DME.
- MeOH dissociate mechanism: One molecule of adsorbed MeOH is first dissociated into a surface methoxy species and then reacts with another MeOH molecule to form DME.
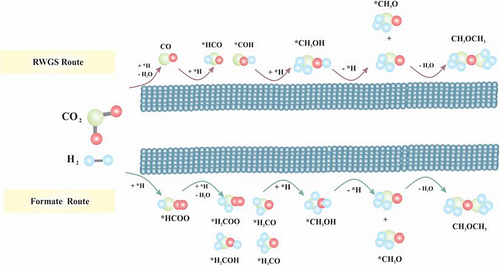
Over the surface of Cu/ZSM-5, H2 dissociates on Cu sites, and CO2 adsorbs dissociatively with ZSM-5 and reacts with H to form intermediate formate species either bidentate (b-HCOO) or/and monodentate (m-HCOO) formats [55]. The b-HCOO species react with H to form HCOOH, which is further hydrogenated to H2COOH. Then, H2CO and OH are formed by decomposing H2COOH, whereas H2CO undergoes consecutive hydrogenation (preceding methoxy (CH3O─)) to form CH3OH. The desorbed MeOH molecules, via acid sites of support, produce methoxy groups, and, finally, two surface methoxy groups interact to form DME and water.
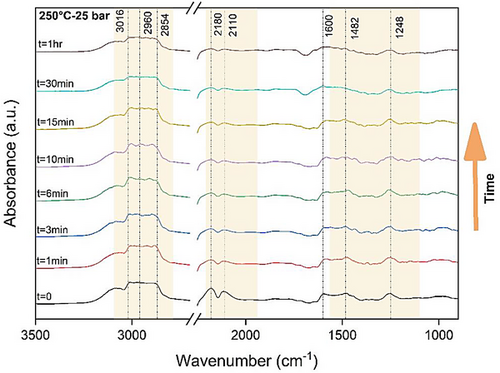
Fig. 13 presents the time-dependent in situ DRIFTS spectra illustrating CO2 hydrogenation over Cu (2 %)/ZSM-5 at optimal conditions (250 °C and 25 bar) for 1 h, with data collected at various time intervals. The peaks associated with methoxy and formate at 1248, 1482, 1600, 2854, and 2960 cm−1 begin to emerge and exhibit growth within the initial 10 min. Beyond the 10 min time point, there is a noticeable reduction in all peaks related to formate species, ultimately stabilizing at 1 h. Specifically, the peak at 1482 cm−1, corresponding to methoxy, undergoes a decline after 10 min, indicative of MeOH dehydration. This observed trend indicates the consumption of formate species within the initial 10 min of the reaction. Simultaneously, peaks associated with CO generation through the RWGS pathway become more prominent, maintaining constancy after the initial 10 min (2110 and 2180 cm−1). These observations suggest that the reaction starts with the RWGS pathway, gradually shifting toward the formate pathway as the primary mechanism. The predominance of the formate reaction mechanism becomes evident after 10 min.
4 Conclusions
The impact of varying pressure (1, 10, 15, 20, and 25 bar) and temperature (from 100 °C to 300 °C) on the mechanism of CO2 hydrogenation was investigated by using in situ DRIFTS analysis over low loading of Cu (2 %)/ZSM-5. The DRIFTS results confirmed the formation of MeOH, DME, and the key intermediates—formate (HCOO) and methoxy (CH3O*). The optimal operating conditions were found to be at 250 °C and 25 bar. Under these optimized conditions, the intensities of formate and methoxy species increased, signifying their crucial role as intermediates in the process, with the formate pathway emerging as the predominant mechanism. Observations also indicated that the primary step in the formate mechanism pathway involves the conversion of formate (HCOO) into methoxy (CH3O), followed by its transformation into CH3OH, in contrast to the generation of formate through carbonate. As illustrated in Fig. 11, characteristic peaks at 2854 and 2720 cm−1 were attributed to formate, whereas peaks at 2960 and 2820 cm−1 were associated with methoxy species. The primary formate species, identified as monodentate formate with peaks at 1482 and 1350 cm−1, was observed to rapidly hydrogenate into methoxy on copper surfaces. The findings collectively deepen our understanding of the CO2 hydrogenation process, offering valuable insights for improving DME production through selection of the catalyst and optimized reaction conditions.
Acknowledgments
Open access publishing facilitated by Monash University, as part of the Wiley - Monash University agreement via the Council of Australian University Librarians.
Abbreviations
-
- DME
-
- dimethyl ether
-
- DRIFTS
-
- diffuse reflectance infrared Fourier transform spectroscopy
-
- MeOH
-
- methanol
-
- RWGS
-
- reverse water-gas shift
-
- SEM–EDX
-
- scanning electron microscopy energy-dispersive X-ray spectroscopy
-
- TOF
-
- turnover frequency
-
- XRD
-
- X-ray powder diffraction


