Positron Emission Particle Tracking for Liquid-Solid Mixing in Stirred Tanks
Abstract
Mixing in stirred tanks is vital to a wide range of industrial processes, typically requiring solids to be fully suspended and evenly distributed. The quality of suspension and mixing is typically measured visually. Such measurements are thus subject to human interpretation and can only feasibly be conducted in transparent systems – an uncommon condition in industrial systems. Visual measurements of homogeneity must also infer full 3D distributions of particles solely from the observation of a limited section thereof. This work details methods by which a system's homogeneity and state of suspension may be measured and quantified with no human interpretation, which can extract information from opaque systems and consider full 3D data acquired throughout the interior of a given system.
1 Introduction
1.1 Measuring Solids Suspension and Homogeneity in Stirred-Tank Systems
The mixing of solids and liquids in stirred-tank systems is an important process widely used across a variety of industrial sectors 1-4. In many of these applications, e.g., wastewater treatment and fermentation 3, 5, it is desirable that all solids within the system are fully suspended, thus maximizing contact between the solid and liquid phases. For a given system, there must exist a minimum impeller speed Njs at which all the solid particles within said system are ‘just suspended' 6. The Njs is a valuable engineering concept, as it represents the point at which full suspension may be achieved without wasting energy operating at a higher impeller speed than necessary. However, despite its importance, the Njs is still – as in the original 1958 work of Zwietering 6 – typically measured in a rather rudimentary manner, namely, through visual observation 4.
In this paper, a method is detailed through which the Njs may instead be determined using positron emission particle tracking (PEPT), a technique which employs highly penetrating gamma radiation to image the 3D motion of particles even within the interior of dense, optically opaque systems. In addition to potentially offering a more rigorous and unambiguous measurement of Njs (the method presented being fully algorithmic as opposed to relying on human interpretation), PEPT's ability to probe opaque systems, objects, and fluids means that such measurements can be performed in real process equipment, and with real industrial fluids and particles 7-12.
A second principal operating condition for solid-liquid mixing in stirred tanks is that there exists an even distribution of solids across the vessel 13. While the Njs tells us the necessary impeller speed for particle suspension, it provides no information regarding the homogeneity of the suspension produced – knowledge which, in some industrial processes, is crucial 14. The homogeneity of an experimental system is commonly inferred by visually measuring the vertical position of a sharp interface near the top of the system between a lower region of high solids concentration and an upper region of low concentration known as the cloud height 13, 15, 16. The accuracy of this parameter, however, is undeniably questionable, as it infers information relating to the full, 3D distribution of particles within a system from a single-point measurement taken at the outer edge of the vessel. The metric is also known to fail for solids loadings < 10 wt % 13. The use of PEPT enables us to map out the full, 3D particle distributions within the systems of interest, allowing us to quantify more precisely the homogeneity of our systems.
In the present study, firstly the method discussed above is applied to investigate the influence of the Zwietering solids loading X 6 on the measured Njs, comparing values measured by PEPT to those obtained using conventional, visual methods, and the predictions of models based on these methods. Secondly, the influence of solids loading on the homogeneity of a system at Njs is investigated, quantifying this homogeneity and its variation with X using a simple scalar metric derived from PEPT data, which is termed the homogeneity index, IH.
1.2 A Brief Review of Prior Work
 (1)
(1)where ν is the kinematic viscosity, Δρ is the difference in density between the solids and fluid, ρf is the fluid density, dp is the mean particle diameter, X is the Zwietering loading (i.e., the percentage mass ratio of solids to liquid in suspension), and D is the impeller diameter. The parameter S, known as the Zwietering constant, is related to the vessel and impeller geometry.
The work by Mak 17 documented a set of S values for a range of impeller shapes and types, while Devarajulu and Loganathan 2 developed a correlation for different impellers as a function of clearance, tank diameter, and liquid level. Ibrahim and Nienow 18 concluded that increases in viscosity led to an increase in Njs as expected by the Zwietering correlation. However, more recently, Kresta et al. 19 found that there was no clear pattern in Njs upon changing the viscosity and suggested that Njs is independent of viscosity in turbulent flow when the particles are larger than the Kolmogorov length scale. Effects due to the particle and fluid densities are generally well understood and agreed upon, as noted in the work of Ayranci and Kresta 20. There has been considerable research into the effects of particle diameter on Njs, in both mono- and poly-dispersed systems, generally agreeing on Zwietering's exponent 4, 21, 22.
Recent works have raised questions over the validity of the effect that solids loading has on just-suspended speed. Ayranci and Kresta 20, e.g., reported that their data was not accurately correlated by the 0.13 exponent of Zwietering, who studied relatively low solids loadings ranging from 0.5 to 17 wt % (0.5 ≤ X ≤ 20) 6. Ayranci and Kresta performed experiments up to 35.5 wt % (X = 55) and recommended that the exponent is changed to 0.24. The work of 2012 work Myers et al. 23 suggests the use of differing exponents for three distinct solids loading ranges, as discussed in greater detail in Sect. 4.1. As is clear from the above, the influence of solids loading on the dynamics of stirred-tank systems is a matter of some dispute and requires further exploration; as such, it is upon this parameter which we predominantly focus in the present work.
Perhaps one of the most striking recent developments in the above-discussed field is the application of artificial neural networks (ANNs; “deep learning”) to the prediction of Njs. Recent work by Choong, Ibrahim, and El-Shafie 24, 25 has developed an ANN model which draws upon several hundred existing data sets in order to predict the just-suspension speed of a system for known solid loading, particle, tank, fluid, and impeller details. It is vital to keep in mind, however, that the output provided by any neural network is only as accurate as the data with which it is trained 26. As such, it is imperative that in tandem with the development of these impressive, novel methodologies for data analysis, one continues to develop more accurate methodologies for the acquisition of the data used thereby; this latter issue is considered in this paper.
Much – perhaps even a majority of – recent work concerning solid-liquid mixing in stirred tanks has been conducted using numerical simulations. Such works notably include a series of papers published by Tamburini and colleagues between 2009 and 2019 27-32, determining suitable turbulence 28 and drag 23, 30 models for such systems at relatively low solids concentrations, and the 2016 work of Wadnerkar et al. 33, which explored solids loadings up to 40 wt %. There exist two main approaches to the numerical modeling of solid-liquid two-phase systems: the “pure-CFD” or Euler-Euler approach, in which both solid and liquid phases are modeled as continua (see, e.g., 34-36) and the Euler-Lagrange or “point-particle” approach, wherein the solid phase is instead modeled as discrete particles, using a modeling approach such as the coupled computational fluid dynamics and discrete element method (CFD-DEM) approach (see, e.g., 37, 38).
The Euler-Euler approach offers impressive computational efficiency, but suffers from two major disadvantages for our current purposes: firstly, it is infamously difficult to provide accurate representations of (inherently discrete) particulate media as continua 39, 40; secondly, it is, for obvious reasons, inherently challenging to directly, and reliably, determine a value for the Njs from a continuum. The Euler-Lagrange approach, which allows the particulate phase to be directly modeled, does allow a direct determination of the Njs, and also avoids issues regarding the continuum modeling of discrete particles. A major disadvantage of this methodology, however, is that it is extremely computationally expensive 41, especially in the case of two-way coupling and finely resolved flow, thus limiting its suitability for simulating large, industrial-scale systems. Nonetheless, as algorithms become more efficient and hardware more powerful, Euler-Lagrange methodologies are expected to prove increasingly valuable in the coming years and decades 42.
While the above-described numerical modeling techniques are very powerful and allow a great deal of detailed information to be extracted from a system, if their results are to be meaningful, they require – for both Euler-Lagrange and Euler-Euler approaches – extensive calibration and validation against similarly detailed experimental data 42, 43. High-resolution, 3D imaging methodologies, such as the PEPT technique, which is described in the coming sections, represent an ideal source of such data 44. In this paper, a manner is described in which PEPT may be used to extract various useful quantities from solid-liquid flows in a stirred tank, providing information which may prove highly valuable both to the cutting-edge numerical simulations and deep learning methodologies discussed above, as well as carrying significant value in their own right as a means of better understanding these important industrial systems.
2 Materials and Methods
2.1 Experimental Setup and Procedure
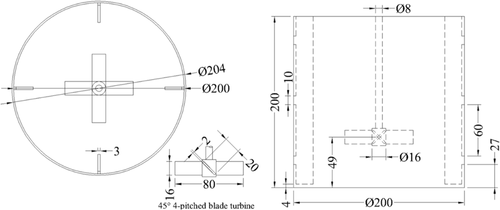
The experimental system comprises a flat-bottomed baffled Perspex tank of diameter T = 200 mm, with a down-pumping 4-blade 45° pitched-blade turbine of diameter D = 80 mm and clearance C = 49 mm from the bottom of the vessel. The geometry described, including impeller type, size, and clearance, was chosen to match the setup used in recent PEPT work concerning anaerobic digestion 3, which is an important real-world application of systems such as those studied here. The system was, in all cases, filled with a total volume V = 5 L of material comprising a mass Mp∈[0,1.5] kg of monodisperse, spherical, 1.2-mm-diameter glass particles (ρp = 2500 kg m−3), with the remaining volume filled with water (ρf = 1000 kg m−3), providing Zwietering loadings in the range X∈[0,60]. A schematic diagram of the system is given in Fig. 1.
For each solids loading tested, the impeller was initially set to the just-suspended speed predicted by the Zwietering correlation given in Eq. 1. An initial 10-min run was then conducted at this impeller speed, and the PEPT data acquired analyzed as described in Sect. 3.1 to assess if the system was in a fully suspended state. If the particle was found to settle for more than 2 s (i.e., Njs had not been reached), a new run was conducted at an increased impeller speed. If the new data set suggested that Njs had now been reached, the next run would then be conducted at an impeller speed lying between that of the two preceding tests. This process was repeated, iterating toward a value of Njs. Once an apparent Njs had been determined, a longer (3 h) run was then conducted in order to ensure that the PEPT tracer was able to fully explore the relevant phase space, and thus that the Njs had indeed been reached. If the particle is found to settle for more than 2 s during this run, an additional 3-h run is performed at an increased impeller speed. The entire two-step process is, in the current work, repeated until complete suspension is observed at an impeller speed no more than 10 rpm above the nearest non-Njs system is found. However, with enough experimental time, it would be possible using this method to determine the Njs to an arbitrary degree of accuracy.
2.2 Data Acquisition: Positron Emission Particle Tracking
Positron emission particle tracking (PEPT) is a technique which allows the 3D motion of solid particles to be tracked and recorded with millisecond-scale temporal resolution and sub-millimeter spatial resolution, even within the interior of large, dense, and/or optically opaque systems 45, 46. The technique allows fully Lagrangian and Eulerian velocity field mapping in solid-liquid stirred tanks, which can be used as a robust validation method for computational fluid dynamics (CFD) and coupled CFD-DEM models, thus improving the accuracy and application of these powerful tools in design and optimization of laboratory and industrial-scale tanks. PEPT can be also employed to investigate in great detail the influence of particle size and shape in turbulent flows, hydrodynamic forces (e.g., drag, lift, turbulent dispersion), particle-particle interaction, in addition to geometrical and operational parameters.
 (2)
(2)The fluorine-18 atoms in the tracer emit positrons, which rapidly annihilate with electrons within the dense tracer medium, releasing pairs of 511 keV gamma rays whose trajectories are collinear and antiparallel (see Fig. 2a). If these gamma rays are both detected by a ‘gamma camera', their straight-line trajectory can be reconstructed. With enough such trajectories, it is possible to triangulate the position of the particle from which the corresponding gamma photons were emitted (see Fig. 2b). For a tracer with adequately high β+ activity, the tracer's position can be triangulated many times per second, allowing the motion of moving tracers to be recorded.

It is important to note that the above represents a significantly abridged and simplified explanation of the PEPT technique. Further details relating to PEPT and its application to chemical engineering systems can be found in a recent review 47 and references therein.
2.3 Other Approaches
For the sake of completeness, it is important to note that there exist, in addition to PEPT, various other methodologies through which one can obtain data from optically opaque systems 40. A methodology commonly used to study a variety of chemical engineering systems 48, including stirred-tank systems 23, 49, 50, is electrical capacitance/resistance tomography (ECT/ERT). While ECT carries a notable advantage over PEPT in terms of the relatively low cost of its setup and operation, the spatial resolution offered thereby is significantly lower 51, even despite recent improvements 52, 53, thus limiting its ability to precisely determine the fine motion of small particles, a matter whose importance will become abundantly clear in Sect. 3.1. The requirement for ECT that tracers and their surrounding media must possess strongly differing electrical permittivities 54 also introduces limitations regarding the materials and combinations thereof which can be successfully imaged.
The issue of reduced spatial resolution is shared by other 3D imaging methodologies such as computer-aided radioactive particle tracking (CARPT) 55, 56 and magnetic particle tracking (MPT) 57. These two methodologies also possess the disadvantage as compared to PEPT of requiring extensive calibration 57-59, while the latter additionally – due to the requirement of a magnetic tracer – cannot be performed truly noninvasively, though close density-matching is found to produce strongly representative results 57, 60. It is worth noting, nonetheless, that the methodologies for determining Njs and the newly defined “homogeneity index” presented in this paper may – if suitable spatial resolution is achievable for the particle size of interest – also be directly applied to data obtained from CARPT and MPT, or indeed other particle-tracking methodologies.
Finally, techniques such as X-ray computed tomography (CT) 61 may also be used to image opaque systems and, under suitable conditions, may do so with higher spatial resolution than ECT, MPT or CARPT. However, such techniques inherently possess a significantly lower temporal resolution, in particular when operating with high spatial resolution 62, making them of limited use in imaging the rapid dynamics of the systems explored here.
3 Data Analysis
3.1 DeterminingNjs
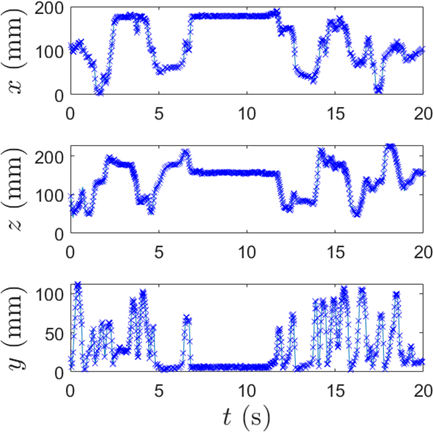
One of the main objectives of this work is to use PEPT data to develop a method for determining the Njs that, unlike conventional visual methods, is fully algorithmic, and thus requires no human interpretation, increasing both rigor and accuracy. The algorithm used is in fact fairly simple, as the data provided by PEPT are highly amenable to such measurements. For a given data set at a given impeller speed, by using PEPT to reconstruct the vertical component of the tracer particle's trajectory, it is started as described in the preceding section. A short segment of such a trajectory is pictured in Fig. 3. From this image, it is intuitively obvious that the system in question is below Njs, as it spends a long period of time immediately static and adjacent to y = 0, the base of the system. However, as the aim is to eliminate reliance on such intuition, instead a set of rigorous criteria must pe provided by which to establish whether or not a system is indeed below Njs.
As a starting point, the standard definition of Njs as the lowest impeller speed at which no particle remains stationary on the vessel base for more than 1–2 s is adopted 6. As such, in order to test whether a particle is above or below Njs, one needs to be able to extract information from the PEPT data that tells a) whether the particle is static, b) whether, whilst it remains static, it is also in contact with the base of the system, and c) the duration of any continuous time period for which both a) and b) consistently hold true.
The methodology begins by using a static point source to determine the standard deviation, σi (i = x,y,z) on the location accuracy of said tracer. Note that, due to the asymmetry of the detector system used 46, individual σ values are acquired for each of the three spatial directions; specifically, resolution in the horizontal z direction (perpendicular to the detector heads) is typically lower than in the orthogonal x and y directions. The specific, quantitative error values for any given PEPT measurement depend also on the activity of the tracer used, the details of the system in which the tracer is housed and various other factors. For the setup and typical activity range used for the experiments described here, error values of σx ≈ 0.7 mm, σy ≈ 0.7 mm, and σz ≈ 1.7 mm, were observed.
During any finite time period Δt, a tracer is assumed to be static along the i-th coordinate so long as its recorded position is not displaced by more than 3σi during this period, i.e., Δi <3σi. If this condition holds true for all three spatial dimensions (i.e., Δx <3σx, Δy <3σy, Δz <3σz), then the particle can be assumed static. Using similar logic, the tracer can be assumed to be in contact with the vessel base if it is found to lie within 3σy of the known base position (y = 0).
The algorithm scans through all data points in turn until a data point with height y <3σy – i.e., a potential particle-base contact – is found. The timestamp corresponding to this data point is recorded as t0, and its position as (x0, y0, z0). The algorithm then scans through the next N data points until a particle location (x1, y1, z1) for which y1 >3σy, x1–x0 >3σx and/or z1–z0 >3σz is found or, alternatively, the end of the file is reached. The timestamp of this data point is recorded as t1. If t1–t0 ≥2s, the data must, based on the above definition, be below Njs, and the program ends. If t1–t0 <2s, the algorithm continues to scan through the system until the next data point for which y <3σy is reached, and the above process is repeated. If an entire data set is scanned with no periods for which t1–t0 ≥2s the system can (if the data set used is suitably long to allow the tracer to explore all phase states – as discussed in Sect. 2.1) be assumed to be above Njs.
In order to ensure reproducibility and rigor in the above methodology, sensitivity analysis was performed, repeating the above process with thresholds of 2σy and 4σy; in all cases, systems initially defined as above Njs remained defined as above Njs, and systems below Njs remained defined as below Njs.
3.2 Quantifying Homogeneity
3.2.1 Defining a Rigorous Homogeneity Index
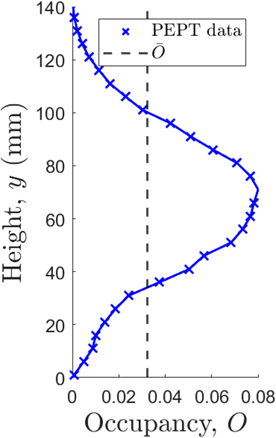
In order to quantify the homogeneity of a system, i.e., how uniformly solids are distributed throughout said system, one begins by extracting from the relevant PEPT data a one-dimensional occupancy profile 63. This is achieved by subdividing the experimental volume into a series of individual ‘slices' in a given direction, and for each of these slices determining the occupancy, O, representing the fraction of the total experimental time period spent by the tracer in that particular slice. By taking slices in the vertical direction, one may produce an occupancy profile such as that pictured in Fig. 4.
 (3)
(3) (4)
(4)where Vp is the volume of a single particle. By dividing the system into a number of equally sized voxels and calculating Oi, ni, and thus ηi for each, one may determine the spatial distributions thereof, as illustrated in Fig. 4. However, as  , the form of each of these profiles will be identical, differing only in the absolute values achieved, i.e., the form of the occupancy profile depicted in Fig. 4 is directly representative of the 1D distribution of solids throughout the system.
The interested reader may find a full mathematical proof of the direct relation between PEPT-measured occupancy distributions and time-averaged solids fraction distributions in reference 63.
 (5)
(5) (6)
(6)Using the above metric, a system which is truly homogeneous will yield a value IH = 0, with higher values corresponding to more strongly inhomogeneous systems. Similar measures to that described here have previously been successfully applied to the measurement of single-species concentration distributions in binary gas-fluidized beds 64, 65 and segregation in binary vibro-fluidized systems 66. It is valuable to note that although in the above example specifically the vertical homogeneity of the system is considered, the exact same approach and system of equations may be used to determine the radial homogeneity of the system or, by dividing this system into a series of fully 3D voxels instead of quasi-1D slices, an ‘overall' homogeneity.
It should be noted, however, that this last approach inherently involves a reduction in the size of the individual voxels as compared to the 1D case and thus, for a fixed experimental duration, a reduction in the quality of the relevant statistics. Due to the high symmetry of the system of interest in the present work, simply a pair of orthogonal 1D distributions is considered, which may still be used to comprehensively investigate the homogeneity of the system as a whole, but without the necessity of either compromised statistics or overly long experimental runs.
3.2.2 Comparison with other Indices
There exist a number of manners suggested in the literature through which a measure of a system's homogeneity may be determined, and it is perhaps useful to briefly contextualize the parameter discussed above in terms of these precedent methodologies. Arguably the most established and widely used index through which researchers assess and quantify the homogeneity of a system is the cloud height 13, 15, 16, whose definition and limitations were discussed in Sect. 1.1. Other researchers, using tomographic techniques such as ECT/ERT, have also proposed alternative indices more similar to that described here.
Williams et al. 67, e.g., used ECT across a number, np, of axially separated planes across a system. For each plane, the authors divided the area into a series of square pixels and calculated the standard deviation of the electrical conductivity across these pixels, normalized to the average value for said plane. The mixing index was then taken as the mean of the normalized standard deviation values achieved over all planes. Later work by Hosseini et al. 50 used a similar approach, but instead calculated the mean concentration in each of the n planes, and then determined the standard deviation of these mean values. The approach of Williams et al. 67 can therefore be thought of as a measure of homogeneity in the horizontal direction, and that of Hosseini et al. 50 as a measure of axial homogeneity.
Later work by Harrison et al. 68 adapted the approach of Williams et al. 67 to use annuli as opposed to square pixels, facilitating the calculation of a “radial mixing index”. The approach of Hosseini et al. 50 carries a notable disadvantage as compared to that of Williams et al. 67 or Harrison et al. 68 in that the initial averaging performed provides only rather coarse data and may falsely report perfect homogeneity in cases where there exist significant variations in packing density in the radial directions, or even between annuli 68. All three of these approaches, however, possess notable limitations as compared to the index proposed in the preceding subsection. Firstly, the measures are only relative, i.e., they do not consider the mean volume fraction of relevant elements for the system as a whole, only for the individual measured components. Secondly, measurements are only taken at a limited number of discrete heights (4, in the case of 50). As such, in particular for the case of highly inhomogeneous systems, it is distinctly possible that the measurements taken from these discrete points may not be representative of the system as a whole. Though one may improve upon this latter issue by using more planes of detectors, there will nonetheless always exist an inherent physical limitation in terms of the measurement density achievable due simply to the physical size of the equipment required.
With PEPT, a pseudo-continuous measurement may be obtained with arbitrarily fine resolution, limited only by the amount of data available 47. The former issue is in fact addressed in the 2014 work of Carletti et al. 69, who consider the overall mean conductivity, as opposed to that specific to a given slice. The authors propose for their index a form very similar to that of Eq. 6, though considering conductivity rather than occupancy. The main issue regarding this distinction is that where the relationship between solids fraction and occupancy offers a unique solution for any combination of materials (e.g., three-phase flows, polydisperse solids etc.) to extract a value of local solids concentration from a conductivity measurement, one must solve an ill-posed problem. In other words, if a system comprises multiple species of particle and/or fluid for which  (where
  is the electrical permittivity of the i-th species), a single value of the measured conductivity for a given region may correspond to various different combinations of materials, and thus different ratios of solid and liquid. Using PEPT-measured occupancy values, so long as one tracer corresponding to each individual species is used, a single unique value may be accurately obtained. In the following section, it is discussed how this may be achieved in practice.
3.3 Extension to Binary and Polydisperse Systems
Though, in the present work, exclusively monodisperse systems are explored, it is nonetheless valuable to note, for the sake of future researchers, that the methodologies described in the preceding subsections can also be trivially extended to the case of two or more particle species. For the case of Njs measurements, it is necessary simply to perform the analysis described in Sect. 3.1 using one or more tracer particles belonging to each species present within the system. This may be achieved either by multiple particle tracking methodologies, such as those described in 70, or by repeated single particle tracking experiments, each experiment using a tracer of a different species.
A similar approach may also be taken to the determination of the homogeneity index, or indeed indices, for binary and polydisperse systems. In such systems, one now has a choice as to how to characterize the homogeneity thereof. Firstly, one may wish to assess the homogeneity of distribution for all particle species individually. In this case, one needs merely repeat the analysis described in Sect. 3.2 using one representative tracer for each species present. As above, the individual traces for these different species may either be acquired simultaneously or sequentially, dependent on the user's preferred method. By summing the normalized occupancy profiles obtained and then suitably re-normalizing them, Eq. 6 may be used on the resultant data to obtain a value for the “overall” homogeneity of the solids distribution. Finally, in addition to looking simply at the homogeneity of the particle distributions in absolute terms, one may also look at segregation between the different particle species using methodologies described in detail in 47, 66, 71.
4 Results and Discussion
4.1 Njsas a Function of Loading
 , with α = 0.13, as per Eq. 1. Similar exponents have also been found in later experimental works, such as those performed by Nienow 72 (α = 0.12) and Baldi et al. 21 (α = 0.125). Later work by Myers et al. 4, however, suggested instead the existence of three distinct exponents which become relevant for different ranges of solids loading, specifically:
 (7)
(7)Least squares regression fits to the PEPT data using the exponents proposed by Zwietering (solid black line), Ayranci and Kresta (dashed and dotted blue lines) and Myers (dashed and dotted red lines) are indicated in Fig. 5a. Perhaps surprisingly, the best fit to the experimental data is in fact provided by the original exponent of Zwietering 6. The fits of Myers 4 and Ayranci and Kresta 20 show considerable deviation. It is perhaps worth noting, however, that if one ignores the points nearest the crossover between the two regimes noted by Myers 4 and consider only the three lowest and three highest data points acquired, the Myers fits seem much more reasonable; however, with the small number of data points considered in each case, a reliable statement regarding their accuracy cannot be provided based on this data alone.
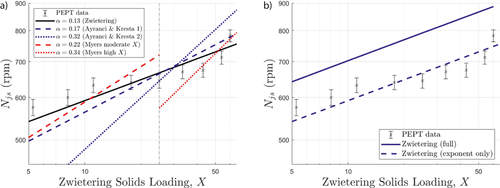
It is important to note here that the aim of this analysis is not to provide a critique of the above models. It is known 20 that the scaling of the Njs with loading is strongly dependent on material, system size, and a variety of other factors, meaning that the data presented here should only be considered valid for the current particles and system geometry, and not extrapolated further. Rather, it is the intention in the present work to assess whether results acquired using our PEPT algorithms align with expectations from prior studies utilizing visual techniques. To this end, the observation that the data align reasonably well with the oldest and most well-established of scaling laws is a pleasing result.
In Fig. 5b, the data are also compared to the full Zwietering model given in Eq. 1, including all relevant terms as opposed to simply the scaling in X. From this plot, it is clear that while the general form of the trend predicted by the Zwietering model agrees well with our data, the Njs values are consistently significantly overestimated by the model, even considering the experimental error margins. Specifically, the two values disagree by approximately 20 %. There are two possible interpretations for this observation: firstly, it is possible that the Zwietering correlation is simply not suitable for the particular system in question. The second, somewhat more interesting, interpretation is that visual observations, upon which the correlation was developed, tend to overestimate the Njs. If this is true, then the use of PEPT to measure Njs could potentially result in significant energy savings in industry. Further work should be conducted directly comparing optical and PEPT measurements in order to determine whether this is indeed the case.
4.2 Homogeneity as a Function of Loading
An immediately notable feature of Fig. 6a is that even though all systems depicted are operating at, or at least to within experimental error of, their respective Njs, the distributions of solids throughout the vertical extent of the system vary significantly for different solids loadings. The same also holds true for the radial direction (Fig. 6c), though the extent of the observed variations is somewhat reduced as compared to the vertical case. Systems with relatively low loadings clearly demonstrate a relatively homogeneous distribution across a considerable portion of the system, while those with higher X demonstrate significant gradients in occupancy, and thus solids density, throughout. Notable also is that for X ⪸ 30 the profiles remain remarkably similar, both in the vertical and radial directions. Pleasingly, all the above observations are clearly reflected in Fig. 6b, suggesting that IH provides a cogent measure of homogeneity.
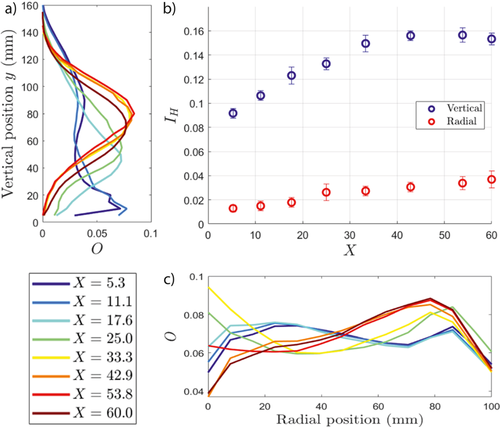
The general trend relating the measured homogeneity to the solids loading agrees reasonably well with prior (optical) work performed by Hicks et al. 16, with both investigations showing the highest level of homogeneity in the systems possessing the lowest solids loading, with a decrease in homogeneity for increasing X down to a plateau, and finally a small increase in homogeneity at large X. It is interesting to note that in our measurements this latter increase in homogeneity is observed only in the vertical (axial) distribution of solids, and not the radial. This raises the important question as to whether simple cloud height measurements can be reliably used to infer the homogeneity of a system in general, or whether they are limited to providing information regarding the solids distribution in the axial direction. In any case, the observation in Fig. 6 of the marked differences in both the form and overall degree of homogeneity in the axial and radial directions clearly highlights the value of both the use of PEPT and the IH parameter.
To allow direct comparison, Fig. 7 presents data from 16 illustrating the typical variation of cloud height (their chosen metric to measure homogeneity) with X. The main discrepancy between the two investigations is that the plateau region of Fig. 7 spans a larger range of X than that displayed in Fig. 6. This discrepancy could potentially be due to a difference in system design or particle properties between the two systems. However, it is stated in the paper of Hicks et al. 16 that the form depicted in Fig. 7 is general for a range of particles, impeller designs, and system sizes, suggesting that this is not the origin of the discrepancy.
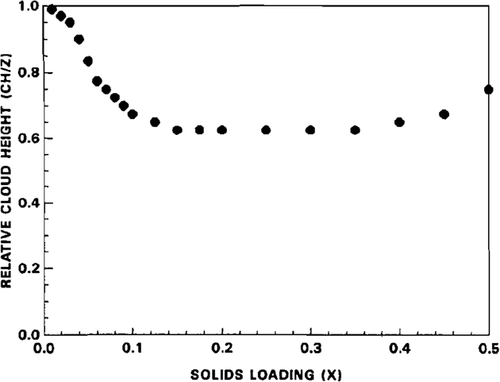
The discrepancy between our observations and the earlier work of 16 may well be due to the over-simplicity of the cloud height as a measure of homogeneity. From Fig. 6a one can clearly see that the form of the particle distribution changes significantly between X ∼ 15 and X ∼ 35, this variation being clearly represented by the IH values depicted in Fig. 6b. However, if the judgment were based only on the point at which the occupancy, and hence solids fraction, reduces to approximately zero (i.e., the cloud height), it is likely that all systems in this range would be interpreted as being similarly homogeneous, as is observed in the cloud height measurements of 16.
The above provides an edifying example of how a parameter such as IH, which subsumes higher-order information corresponding to the full 3D volume of a system into a single scalar parameter, can more accurately and reliably quantify the homogeneity of a stirred tank than a simpler parameter such as the cloud height, which is based only on a single point measurement.
Having shown that the homogeneity index IH can successfully quantify the uniformity of a distribution in both the axial and radial directions, and confirmed that our observations align broadly with expectations from prior studies, it remains only to attempt to explain why this trend is observed. Based on a simple consideration of the hindered settling velocity, which decreases monotonically with solids fraction 73, 74, one may expect an increased solids loading to lead to a more homogeneous distribution of solids. However, across the majority of the parameter space explored both here and in 16, the inverse holds true. The observed decrease in homogeneity with increasing X (and thus increasing η) is likely to be caused by the corresponding increase in energy dissipation related thereto.
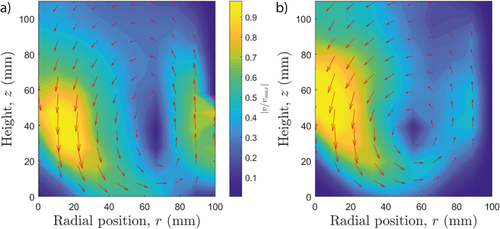
As the solids loading increases, particles become more likely to undergo collisional interactions 75 as opposed to simply following the flow as an effectively non-interacting ‘gas', as may be observed for low particle loadings 76. This increase in collision frequency has the dual effects of both directly dissipating the kinetic energy of the particles at an increased rate 75 but also of disrupting flow and increasing turbulence within the system. The net result is that, as illustrated in Fig. 8, for more densely loaded systems the velocity imparted to the particles by the impeller at small r is more rapidly lost, resulting in a less strong upflow at large r, and thus preventing a majority of particles being transported to the top of the system. The result is the distinct absence of particles at large z and pronounced ‘bulge' of particles at moderate z clearly observed for all high-X systems in Fig. 6a.
5 Summary and Conclusions
Using data acquired via positron emission particle tracking, detailed methodologies have been provided through which the complete suspension speed and homogeneity of solids distribution may be accurately and autonomously measured, even for the case of optically opaque systems. These measures were then used to explore how the Njs of a simple, fluid-immersed system of glass spheres varies with the Zwietering solids loading fraction X across a wide range of phase space 5 < X ≤ 60. From a number of tested correlations, our experimental data for the variation of Njs with X were found to be best described by the X0.13 scaling first proposed by Zwietering 6, though the equations of Myers et al. 4 were also found to give reasonable agreement for the highest and lowest values of X explored.
The use of our proposed homogeneity index IH to quantify the uniformity of solids distribution within a stirred-tank system produced a range of results which broadly agree with the observations of prior researchers 16 using conventional visual measures. A comparison of the obtained results with these previous observations, combined with a closer direct analysis of the vertical density profiles used to calculate IH, suggest a failure of conventional cloud height measurements to account for differences between the solids distributions exhibited by systems possessing moderate 15 ≦ X ≦ 35 solids loadings.
The authors have declared no conflict of interest.
Symbols used
-
- C [mm]
-
impeller clearance
-
- D [mm]
-
impeller diameter
-
- dp [mm]
-
particle diameter
-
- g [m s−2]
-
acceleration due to gravity
-
- IH [–]
-
homogeneity index
-
- Njs [rpm]
-
minimum impeller speed for just suspension
-
- O [–]
-
occupancy
-
- T [mm]
-
tank diameter
-
- Ms [kg]
-
solids mass
-
- S [–]
-
Zwietering geometric constant
-
- V [L]
-
volume of material (solids and liquid) in tank
-
- X [–]
-
Zwietering solids loading
-
- y [–]
-
vertical position
Greek letters
-
- ρF, ρs [kg m−3]
-
intrinsic density of fluid/solid
-
- σy [–]
-
standard deviation on measurements of vertical position
-
- ν [m2s−1]
-
kinematic viscosity
Abbreviations
-
- ANN
-
artificial neural network
-
- CFD
-
computational fluid dynamics
-
- DEM
-
discrete element method
-
- ECT
-
electrical capacitance tomography
-
- ERT
-
electrical resistance tomography
-
- PEPT
-
Positron emission particle tracking


