Effect of Crystallization Conditions on the Metastable Zone Width and Nucleation Kinetics of p-Aminobenzoic Acid in Ethanol
Abstract
A detailed knowledge of the metastable zone width (MSZW) and nucleation kinetics is vital for the design of batch cooling crystallization processes. Factors such as cooling rate and impeller speed affect the MSZW and nucleation kinetics. Crystallization and dissolution temperatures were measured as a function of cooling rate and impeller speed during the batch cooling crystallization of p-aminobenzoic acid (pABA) from ethanol in a 0.5-L stirred-tank crystallizer. The polythermal experimental data were analyzed using the Nyvlt and first principles-based Kashchiev-Borissova-Hammond-Roberts (KBHR) methods. In all experimental cases, the latter model revealed that the nucleation process of pABA in ethanol was dominated by an instantaneous nucleation mechanism. The Nyvlt and KBHR analyses delivered a range of parameter values associated with a power-law model describing the nucleation rate as well as the concentration of nuclei.
1 Introduction
A detailed knowledge of nucleation mechanism and kinetics is crucial for the design of crystallization processes and selection of its operating conditions for obtaining crystals with required physical properties, such as crystal size distribution, morphology, and purity. The nucleation process significantly influences the metastable zone width (MSZW), which is an important parameter as it determines the onset of crystallization and the seeding temperature. The MSZW is defined as the difference between the solute-solvent system saturation (or equilibrium) temperature and the temperature at which a detectable crystallization commences. The onset of crystallization, however, is not unique, as it depends on a number of factors including cooling rate, impeller speed, and crystallizer scale size. The effects of these parameters on nucleation kinetics can be assessed through different models ranging from the empirical models, such as the Nyvlt approach 1, to the ones based on first principles including the Kashchiev-Borissova-Hammond-Roberts (KBHR) model 2. Both of these models make use of experimental data obtained through the polythermal method that relate the effect of cooling rate to the onset of crystallization. However, the latter modeling approach provides a more detailed physical insight into the nucleation process.
A number of studies 3-10, have been carried out previously in order to determine the MSZW in stirred-tank crystallizers using variable cooling rates, agitation rates, and solution concentrations for different organic/inorganic compounds. These studies have revealed that the MSZW becomes wider as the cooling rate increases, implying that the crystallization temperature decreases with increasing cooling rate. It has been suggested 3 that the crystallization temperature is reduced due to a slower nucleation rate with respect to the rate of supersaturation generation owing to the cooling of the solution. It is relatively easy to induce nucleation at a higher concentration since the solution contains more solute molecules, which will enhance the potential for solute-solute interactions 3. Turner et al. 4 found that in the crystallization of p-aminobenzoic acid from three different solvents, namely, ethanol, acetonitrile, and water, in 1.5-mL agitated vials, at a higher solute concentration nucleation occurred via the instantaneous nucleation mechanism, whilst a progressive nucleation took place at a lower concentration.
As for the effect of agitation rate on MSZW, early studies of Mullin and Raven 5, 6 revealed the dependency of supercooling of aqueous inorganic salt solutions on stirrer speed. A higher agitation rate caused a reduction in the supercooling required for nucleation, yet further increase in agitation resulted in a stronger supercooling which deterred the nucleation process. However, nucleation was enhanced at a much higher stirrer speed. This behavior was attributed to the combined effect of enhanced diffusion mass transfer and attrition of clusters of nuclei caused by turbulence. In the crystallization of L-glutamic acid 7 and borax decahydrate 11 from aqueous solutions, it was observed that, as expected, the MSZW decreased with increasing agitation speed up to 350 rpm. However, Liang et al. 7 found that after the initial decrease the MSZW became wider with further increase of the stirrer speed beyond a critical value of around 350 rpm. Liszi et al. 8 investigated the effect of the stirrer speed on batch cooling crystallization of sulfamide derivative from an aqueous solution and their data revealed that the nucleation rate was small at low Reynolds numbers (Re < 1000) which rose significantly up to a critical Re ≈ 4000. However, it remained constant at Reynolds numbers higher than the critical value.
Previous studies 12-14 examined the influence of agitation rate on nucleation of organic compounds in batch cooling crystallization through induction time measurements in small vials agitated by a magnetic stirrer and in laboratory-scale stirred-tank crystallizers. Generally, the induction time was found to decrease with higher agitation rate which was attributed to shear-induced cluster aggregation under turbulent flow conditions 12. However, Liu and Rasmuson 13 also found that as the agitation rate increased, the induction time reduced initially and then it became higher and reached a plateau, which resembled the trend of MSZW versus agitation rate observed by Mullin and Raven 5, 6.
In a number of studies, including some of the ones cited above, nucleation kinetics have been determined from the measurements of induction time using the isothermal method or the MSZW applying the polythermal method. Stochastic nucleation models have been extensively employed to extract nucleation rates generally from the measured induction time (see a succinct review in 14) whereas methods developed by Nyvlt 1 as well as Kubota 15 and Sangwal 16 have been widely used for the determination of nucleation rates from the MSZW data. In a recent study, Cedeno et al. 14 demonstrated that stochastic models significantly underpredict the nucleation rates compared with those obtained from the latter approaches 1, 15, 16. They claimed that the nucleation rates predicted by stochastic models may not be scalable and hence are not suitable for the design of industrial crystallizers.
This investigation focuses on the crystallization characteristics of p-aminobenzoic (pABA) acid in ethanol, particularly the effect of cooling and agitation rates on the MSZW and nucleation mechanism and kinetics. Although several groups 4, 14, 17, 18 investigated the effects that cooling rates exert on the onset of nucleation and nucleation kinetics of pABA, these studies were carried out in very small volumes such as in vials and in droplets. The hydrodynamic and mixing conditions in such systems are not representative of large-scale stirred-tank crystallizers with a typical industrial configuration.
There has been a limited application of the first principles-based KBHR approach 2 for characterizing the nucleation process of pABA 4, 17. In this study, crystallization and dissolution temperatures were measured as a function of cooling rate and impeller speed for the batch cooling crystallization of alpha pABA (α-pABA) from ethanol. The data were obtained in a 0.5-L jacketed glass crystallizer agitated using a retreat curved impeller. The onset of crystallization was detected via a turbidimetric technique. The cooling rates ranged from 0.3 to 0.8 °C min−1 and agitation rates from 100 to 200 rpm. The crystal size measurements were carried out using a Malvern Morphologi G3. The MSZW data obtained by the polythermal method were analyzed in order to determine the nucleation mechanism using the KBHR approach, and nucleation kinetic parameters associated with a power-law model were extracted using Nyvlt and KBHR approaches.
2 Materials and Methods
2.1 Materials
The materials chosen as the model solute-solvent system are α-pABA and pure ethanol. The α-pABA crystals with 99.9 % purity were purchased from Sigma Aldrich. It is a non-standard amino acid, which comprises hydrogen bonding (H-bonding) functional groups of carboxylic acid and amino functional groups attached to its carbon ring as illustrated in Fig. 1. This type of functional groups is present in many pharmaceutical compounds, making pABA exhibit some of the molecular-scale characteristics of pharmaceutical compounds and their precursors.

pABA can crystallize into two well-defined polymorphs of alpha and beta forms. It can also form a third polymorph, which has an orthorhombic structure, when dissolved into aqueous solutions containing selenous acid. As the selenous acid was not used in this study, only alpha and beta forms were considered. Pure ethanol served as the solvent for dissolving crystals of pABA. It is a simple alcohol with the chemical formula C2H5OH and comprises an ethyl group linked to a hydroxyl group (–OH).
2.2 Experimental Setup and Procedures
The Radleys Lab Reactor System (Radleys, Shire Hill, Essex, UK) 19 was employed for the crystallization experiments, which consists of a 0.5-L unbaffled jacketed glass crystallizer with a dish-shaped bottom, as illustrated in Fig. 2. The solution temperature was maintained by a Huber Ministat 230 thermostatic bath operated through an in-house LabVIEW software running on the reactor control PC. The pABA solution was stirred at a defined rate using a retreat curve impeller controlled by the Radleys RS50 Controller. A class-A PTFE Pt100 temperature probe and an in-house-built turbidimetric fiber-optic probe measured the temperature and turbidity of the solution to detect the onset of crystallization, respectively. These data were recorded by the LabVIEW derived data-logging software.

 (1)
(1)where ceq is the equilibrium concentration (g solute kg−1 solvent) and T is the temperature (°C). For the 0.5-L scale reactor, 67.07 g of pABA was needed per 500 mL of ethanol to make up a solution of initial concentration of 170 g kg−1 of solvent corresponding to a saturation temperature of 29.31 °C. The solution was cooled at different rates ranging from 0.3 to 0.8 °C min−1 at a controlled agitation rate of 150 rpm, which was taken as the base case. Experiments were repeated with a different agitaton speed of 200 rpm. For determining the effect of agitation rate on MSZW, the solution was stirred at a controlled agitation rate of three different values, i.e., 100, 150, and 200 rpm, with heating (for crystal dissolution) and cooling (for crystallization) cycles at a rate of 0.5 °C min−1 as the base case. The experimental matrix is given in Tab. 1.
|
Agitation rate [rpm] |
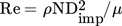
Reynolds number ( |
Cooling rate [°C min−1] |
|---|---|---|
|
100 |
83 228 |
0.5 |
|
150 |
124 842 |
0.3 |
|
0.5 |
||
|
0.65 |
||
|
0.7 |
||
|
0.8 |
||
|
200 |
166 456 |
0.3 |
|
0.5 |
||
|
0.65 |
||
|
0.8 |
 )
)
For each experimental condition, the measurement was repeated three times to ensure the reproducibility of data. The values of Reynolds number for the chosen stirrer speeds given in Tab. 1 reveal that the flow in the crystallizer is turbulent. It was observed that the depth of the vortex formed in the unbaffled vessel at the highest impeller speed was quite shallow.
2.3 Polythermal Measurements and Data Analysis
The turbidity probe was first calibrated at the beginning of the experiment to ensure that correct data were obtained for turbidity profiles. Two values were required to calibrate the probe, and these were measured at 0 % and 100 % transmittance. The former gives the voltage reading of 0.55 V whilst the latter gives 7.35 V. These were then plotted on a transmittance against turbidity graph which yields a straight-line profile having a slope of 14.71 and y-intercept of −8.09.
As mentioned in Sect. 2.2, 0.5 L solutions were subjected to heating and cooling cycles, with each cycle initiated by heating the solution at a given rate from 15 °C for the first cycle or 5 °C for subsequent cycles up to 40 °C, i.e., 10 °C above the saturation temperature, where the temperature was kept constant for 60 min to ensure complete dissolution of the crystals, and then cooled to 5 °C at the same rate where it was held for another 30 min to equilibrate. Prior to carrying out experiments, the thermal response of the crystallizer to this set-point ramp temperature plan was examined by heating/cooling water at two different rates. Fig. 3 illustrates the measured reactor temperature-time profiles at heating/cooling rates of 0.5 and 1.0 °C min−1 against the set point temperatures.

Fig. 3 demonstrates that at the onset of heating and cooling and at the maximum/minimum set-point temperatures there are clear departures of the reactor temperature from the set-point temperature profile. This is due to a delay in the response of reactor temperature to the change in temperature of the heat transfer fluid flowing in the jacket (not shown in Fig. 3). This demonstrates that the thermal inertia of the glass vessel is considerable. It can also be observed that the measured temperature profiles are much more linear and parallel to the set-point temperature, and the temperature overshoot/undershoot are less pronounced at 40 °C and 5 °C, respectively, for the lower cooling rate compared to that at the higher cooling rate. The calculated slope of the measured reactor temperature profile is 0.93 °C min−1 during the cooling period with a set-point rate of 1.0 °C min−1, whereas the slope is the same when a set-point cooling rate of 0.5 °C min−1 was specified.
The crystallization and dissolution temperatures were estimated from the points on the turbidity profile when a sudden change in light transmittance was detected. The crystallization temperature was taken as a point at which the light transmittance was found to decrease below 100 % or at least declined by 10 % from the constant value of transmittance. Concurrently, the dissolution temperature corresponds to a point at which the light transmittance reached at least 20 % from the zero-transmittance recorded (see Fig. 5).
 (2)
(2)The relative critical undercooling (uc) can thus be calculated using Eq. (S3) given in SI. From the values obtained, a ln-ln graph of cooling rates (q) and critical undercooling (uc) was plotted and the data points were then fitted to a straight line where the numerical value of the slope was used to determine the mechanism governing the nucleation process, i.e., whether the crystallization occurred via progressive or instantaneous nucleation mechanism.
3 Results and Discussion
3.1 Crystal Images and Morphological Data
The images of pABA crystals collected after the polythermal cooling crystallization experiments at stirrer speeds of 150 and 200 rpm were obtained by optical microscopy and are depicted in Fig. 4. The needle-like morphology reveals that they are the alpha form of pABA crystals. This polymorph forms more readily and appears to dominate in the solution crystallization from all solvents 20, 21 than the beta polymorph having a hexagonal morphology, which often nucleates concomitantly with the alpha form, from aqueous solutions.

Since the crystal structure of the alpha polymorph is characterized by dimers formed through the association of carboxylic acid groups and π-π stacking interactions, Toroz et al. 17 proposed that the possibility of this polymorph to nucleates in the solutions is highly likely compared to the beta form. The crystal structure of the beta polymorph is based on a four-membered hydrogen bonding ring structure, with no formation of carboxylic acid dimers, which explain that the formation of this structure is less favorable. The formation of long, needle-like α-pABA crystals in ethanol in 1.5-mL vials was also observed in previous studies 17, 20. This is supported by the study of Gracin and Rasmuson 22, who noted that the system was enantiotropic with a transition temperature of 25 °C. Below this transition temperature, crystallization of the beta polymorph was stable in which the supersaturation needed to be carefully controlled for it to nucleate either in water or in ethyl acetate.
3.2 Effects of Cooling Rate and Agitation Rate on MSZW
Fig. 5 illustrates typical measured time profiles of the solution temperature and turbidity probe output signal (transmittance), together with the crystallizer set-point temperature, during repeated heating/cooling cycles at a rate of 0.8 °C min−1. The crystallization temperature (Tc) and crystal dissolution temperature (Tdiss) were estimated from the points on the turbidity profile where a sudden change in light transmittance was detected as explained in Sect. 2.3. The values of the crystallization and dissolution temperatures for each repeat experiment at different heating/cooling rates (henceforth these will be referred to as only cooling rate) and at agitation rates of 150 and 200 rpm together with the calculated critical undercooling (ΔTc) using Eq. 2 needed for Nyvlt and KBHR analysis are given in Tab. 2.
|
Agitation rate [rpm] |
Cooling rate [°C min−1] |
Tc [°C] |
Tdiss [°C] |
ΔTc [°C] |
||||||
|---|---|---|---|---|---|---|---|---|---|---|
|
Tc,1 |
Tc,2 |
Tc,3 |
Average Tc |
Tdiss,1 |
Tdiss,2 |
Tdiss,3 |
Average Tdiss |
|||
|
150 |
0.8 |
17.2 |
16.1 |
18.2 |
17.2 |
27.4 |
28.2 |
28.6 |
28.1 |
9.0 |
|
0.7 |
15 |
15.9 |
17.4 |
16.1 |
26.5 |
26.7 |
26.5 |
26.6 |
10.0 |
|
|
0.65 |
18.1 |
18.1 |
19.7 |
18.6 |
28.3 |
28.7 |
29.1 |
28.7 |
7.5 |
|
|
0.5 |
22.2 |
18.9 |
21.0 |
20.7 |
28.3 |
26.0 |
29.1 |
27.8 |
5.4 |
|
|
0.3 |
21.8 |
21.8 |
23.8 |
22.5 |
24.4 |
26.5 |
28.5 |
26.5 |
3.7 |
|
|
|
|
|
|
|
|
|
|
Te |
26.1 |
|
|
200 |
0.8 |
16.9 |
16.7 |
17.9 |
17.2 |
28.7 |
28.9 |
29.4 |
29.0 |
9.3 |
|
0.65 |
20.7 |
19.6 |
20.0 |
20.1 |
31.4 |
28.7 |
30.6 |
30.2 |
6.4 |
|
|
0.5 |
19.6 |
19.0 |
20.8 |
19.8 |
28.0 |
29.7 |
29.0 |
28.9 |
6.7 |
|
|
0.3 |
21.3 |
22.0 |
22.4 |
21.9 |
27.3 |
27.3 |
27.2 |
27.3 |
4.6 |
|
|
|
|
|
|
|
|
|
|
Te |
26.5 |
|

Figs. 6a and 6b are plots of the crystallization and dissolution temperature of α-pABA in ethanol as a function of the cooling rate at 150 and 200 rpm agitation speed. The crystallization temperature decreases whilst the dissolution temperature increases slightly with rising cooling rate. The values of the equilibrium temperature (Te) required for data analysis using the KBHR approach were obtained by linear extrapolation of Tdiss data to 0 °C min−1 cooling rate. The best linear fittings to these data for 150 and 200 rpm agitation rates are given by: y = 2.375x + 26.119 and y = 4.1583x + 26.511, and the corresponding values of Te are 26.1 °C and 26.5 °C, respectively.

As revealed in Fig. 6a, the crystallization temperature has a slightly stronger dependency on the cooling rate for 150 rpm compared to 200 rpm (Fig. 6b). As expected, the crystallization temperature decreases with increasing cooling rate. This is due to a slower nucleation rate as well as a slower growth rate of nuclei with respect to the rate of supersaturation generation by the cooling of solution as suggested by Borissova et al. 3. Interestingly, dissolution measurements demonstrate a relatively weak dependency of the dissolution temperature on the heating rate, as featured by the slope of the linear trend lines fitted to these data. Yet, dependency of crystallization temperature on the cooling rate is relatively high which suggests that the crystallization process is kinetically controlled. As for the effect of agitation rate, the data exhibit a small dependence of the dissolution temperature on the cooling rate for both impeller speeds as seen based on the slopes of the trend lines fitting the dissolution temperature data. In both cases, the trend lines for the crystallization temperature are similar, such that as the cooling rate increases, the temperature decreases, hence an enlargement in MSZW at faster cooling rates.
The variations of MSZW, defined by Eq. 2 as the difference between the equilibrium temperature (Te) and the crystallization temperature (Tc), as a function of cooling rate for each agitation rate are depicted in Fig. 6c. Overall, the MSZW varies within the range of 3.7 °C to 10.0 °C. It can be seen that, if the two outliers at 0.65 and 0.7 °C min−1 cooling rates are ignored, the MSZW at 200 rpm is slightly wider than at 150 rpm. This apparent unexpected trend is explained below with the help of Fig. 7.

Fig. 7 illustrates the impact of the agitation rate (100, 150, and 200 rpm) on the MSZW of α-pABA in ethanol at a fixed cooling rate of 0.5 °C min−1. The MSZW decreases with an increase in the stirrer speed from 100 to 150 rpm, and then it becomes wider with further raise in the speed from 150 to 200 rpm. A similar trend was observed in previous studies by Liang et al. 7 and Mullin and Raven 5, 6 in the crystallization of L-glutamic acid and ammonium dihydrogen phosphate, respectively, from aqueous solutions. However, the critical stirrer speed at which the trend reversed was found to be higher, i.e., 350–400 rpm, compared to the present study. The initial decrease of MSZW is due to a stronger mixing intensity resulting in higher mass transfer rates 23, which is also in line with Nyvlt's suggestion that the nucleation rate constant will increase with higher stirrer speeds 1.
On the other hand, widening of the MSZW beyond a critical speed may be explained based on the suggestion of Nyvlt et al. 24 that a strong level of turbulence localized around the nuclei displaces the crystallized solution and simultaneously replaces it with fresh solution, thus delaying the detection of nucleation. We also postulate in line with 5, 6 that clusters formed through the aggregation of molecules in cooling crystallization are susceptible to breakage as the hydrodynamic shear rate increases with higher stirrer speed, which can delay the detection of the onset of crystallization. Liang et al. 7 observed formation of air bubbles at high stirrer speeds and speculated as the cause for the reversal of the trend due to the disruption of mass transfer associated with the formation of nuclei by the air bubbles. However, bubble formation was not observed in our experiments. A similar trend in the variation of induction time with increasing agitation rate was also found by Liu and Rasmuson 13 in small vials agitated by magnetic stirrers.
Fig. 8 compares the MSZW of α-pABA in ethanol obtained as functions of cooling rate and agitation rate in the 0.5-L crystallizer and with those obtained by Toroz et al. 17 in 1.5-mL vials of Crystal16 (Technobis Crystallization Systems, Alkmaar, The Netherlands). The MSZW data of Thompson 25 in the 0.5-L crystallizer at a stirrer speed of 250 rpm are in the range of 6–10 °C, which are in line with those at 150 and 200 rpm confirming the trend displayed in Fig. 7. However, the MSZW in 1.5-mL vials at an agitation rate of 300 rpm is much wider within the range of 13–30 °C. This significant widening of the MSZW cannot be attributed only to the increase of agitation rate from 250 to 300 rpm, the volume of solution has a significant role to play. Liu and Rasmuson 13 also observed that the induction time reduced when the vial volume increased from 10 to 20 mL and suggested that the likelihood of nucleation became higher with larger volume.

3.3 Nucleation Kinetics
3.3.1 Polythermal Data Analysis Using the KBHR Approach
The relative critical undercooling uc was calculated at each cooling rate q using Eq. (S3) in the SI and as given in Tab. 3. The uc values are within the limits specified by inequalities uc < 0.1 2, thus can be used in the KBHR approach (see for details SI).
|
ΔTc [°C] |
uc |
q [°C s−1] |
ln q |
ln uc |
|---|---|---|---|---|
|
150 rpm |
|
|
|
|
|
9.0 |
0.0299 |
0.013 |
−4.3175 |
−3.5089 |
|
10.0 |
0.0335 |
0.012 |
−4.4510 |
−3.3964 |
|
7.5 |
0.0250 |
0.011 |
−4.5251 |
−3.6879 |
|
5.4 |
0.0181 |
0.008 |
−4.7875 |
−4.0109 |
|
3.7 |
0.0122 |
0.005 |
−5.2983 |
−4.4055 |
|
200 rpm |
|
|
|
|
|
9.3 |
0.0312 |
0.013 |
−4.3175 |
−3.4674 |
|
6.4 |
0.0214 |
0.011 |
−4.5251 |
−3.8441 |
|
6.7 |
0.0224 |
0.008 |
−4.7875 |
−3.7984 |
|
4.6 |
0.0154 |
0.005 |
−5.2983 |
−4.1737 |
For each agitation rate, a ln-ln plot of the cooling rate against relative critical undercooling is constructed to determine the nucleation mechanism of α-pABA based on the slope of the best fit trend line. The plots for agitation rates of 150 and 200 rpm are illustrated in Fig. 9a. The lines of best linear fit of the data are expressed by the following equations: y = 0.9123x − 1.2076 and y = 1.3584x + 0.4584, respectively. In both cases, the slopes of the lines are less than 3, suggesting that the crystallization of α-pABA in ethanol at a concentration of 170 g kg−1 solvent occurred via the instantaneous nucleation mechanism. Hence, Eq. (S17) in SI was applied, where a plot of ln q versus uc was constructed for both agitation speeds. OriginPro was used to obtain the free parameters, ln q0, 1/m, (n+1)m, and  , through fitting the equation to the data points based on the nonlinear least-square method. However, reliable values of these parameters could not be obtained due to the insufficient number of experimental data points to fit the nonlinear complex relationship of ln q and uc.

 (3)
(3)Based on the assumption in 17, the parameters of Eq. 3 were assigned the following values: d = 1, m = 1, αdet = 1 × 10⁻⁶, KG = 1 × 10⁻⁸ m s−1, and kv = 1.28 × 10⁻¹⁰. Hence, substituting all these values into Eq. 3 gives c0 = 8.56 × 10⁸ m−3. Similarly, for the agitation rate of 200 rpm, where ln q0 = 0.4584 and (n+1) = 1.3584, the value of c0 = 2.64 × 10⁹ m−3. A larger number of nuclei per unit volume is formed at a higher agitation rate, which demonstrates the effect of mixing in enhancing the nucleation rate. The values of n for both agitation speeds were less than 1, which indicates that the growth of crystallites in the system was limited only by the mass transfer rate. The present values of c0 reveal a good agreement with those calculated by the same methodology in 4 using crystallization data for α-pABA in 1.5-mL vials.
3.3.2 Nyvlt Approach
 (4)
(4)The calculated values of Δcmax are presented in Tab. 4, such that cmax is the initial concentration of the solutions prepared and c* is determined from the correlation of solubility (Eq. 1) with respect to the ΔTc at each cooling rate.
|
ln q |
ΔTc [°C] |
ln ΔTc |
Tc [°C] |
c* [m−3] |
Δcmax = cmax−c* [m−3] |
dc*/dTc |
|---|---|---|---|---|---|---|
|
Agitation rate = 150 rpm |
||||||
|
−4.3175 |
10.9 |
2.3888 |
17.2 |
140.9 |
29.1 |
2.6664 |
|
−4.4510 |
10.5 |
2.3514 |
16.1 |
138.5 |
31.5 |
3.0035 |
|
−4.5251 |
10.1 |
2.3092 |
18.6 |
144.4 |
25.6 |
2.5420 |
|
−4.7875 |
7.1 |
1.9601 |
20.7 |
149.5 |
20.5 |
2.8943 |
|
−5.2983 |
4.0 |
1.3863 |
22.5 |
153.9 |
16.1 |
4.0254 |
|
Agitation rate = 200 rpm |
||||||
|
−4.3175 |
11.8 |
2.4709 |
17.2 |
140.9 |
29.1 |
2.4560 |
|
−4.5251 |
10.1 |
2.3158 |
20.1 |
148.0 |
22.0 |
2.1741 |
|
−4.7875 |
9.1 |
2.2083 |
19.8 |
147.2 |
22.8 |
2.5017 |
|
−5.2983 |
5.4 |
1.6802 |
21.9 |
152.5 |
17.5 |
3.2688 |
 (5)
(5)where J = 0.027 m−3s−1 at an agitation rate of 150 rpm. Similarly, for the agitation rate of 200 rpm (Fig. 9b), the best linear fit is given by: y = 1.218x − 7.3736, where m0 = 1.218 and kj = 5.74 × 10⁻⁴ m−3s−1 and thus, J = 0.026 m−3s−1. The values of J reveal that the nucleation rates are very similar for different agitation rates. The nucleation order does not vary significantly with increasing stirring rate. Nyvlt et al. 24 pointed out that the nucleation order is approximately inversely proportional to the molecular weight of the solute based on the experimental results of inorganic salts and is known as the energy barrier of nucleation, which is associated with the number of molecules forming a critical nucleus 1.
Both approaches revealed kinetics of nucleation of pABA in ethanol based on the analysis of experimental data. However, Nyvlt's approach yields values of two empirical parameters, i.e., the apparent nucleation order m0 and the nucleation rate constant kj, which do not elucidate the nucleation mechanisms. It is assumed that the nucleation rate at the onset of crystallization is equal to the rate of supersaturation generation for a limited period of time during which the growth of the newly formed crystals is neglected.
On the other hand, the KBHR approach determines the key parameters associated with both nucleation and nuclei growth processes and provides an insight into the nucleation mechanism by differentiating between instantaneous nucleation and progressive nucleation. The nucleation rate expressions do not involve any empirical parameters. This is achieved by relating the limit of metastability to either the fraction of crystallized volume, adet, or the number of nucleated crystallites, Ndet, at the detection point. Hence, both nucleation and growth rates of nuclei are taken into account.
Overall, the nucleation rates calculated from the Nyvlt approach were not affected by the agitation rate as the mass crystallized was found almost the same, whereas the KBHR analysis revealed that at the higher agitation rate more nuclei were produced, which means that at a higher agitation rate the crystals are smaller.
4 Conclusions
Crystallization and dissolution temperatures were measured as a function of cooling rate and impeller speed for the batch cooling crystallization of pABA in ethanol. The data were obtained in a 0.5-L jacketed glass crystallizer agitated using a retreat curved impeller. The cooling rates ranged from 0.3 to 0.8 °C min−1 and the agitation rates from 100 to 200 rpm.
The onset of crystallization and the dissolution of crystals were detected via a turbidimetric technique. For all experimental conditions investigated, the needle-like alpha form of pABA was obtained as confirmed by microscopic images of the crystals. The MSZW was found to decrease with higher impeller speed up to a critical value, then it increased beyond this speed. The MSZW became larger with higher cooling rate.
Data analysis by the Nyvlt and KBHR approaches revealed that the operating conditions did not affect the kinetics of nucleation significantly. In all experimental cases, the KBHR model demonstrated that the nucleation process was dominated by an instantaneous nucleation mechanism. This suggests that all nuclei appeared at the same instance of time, then they grew to a critical size that could be detected. The data analysis delivered a range of values of the parameters associated with a power-law model describing the nucleation rate as well as the concentration of nuclei.
5 Supporting Information
Supporting Information for this article can be found under DOI: 10.1002/ceat.201900679. This section includes details of Nyvlt and KBHR approaches and additional references to primary literature relevant for this research 26-28.
Acknowledgements
The authors gratefully acknowledge the Public Service Department of the Government of Malaysia for providing a Federal Scholarship to SZMN for carrying out this research as part of the MEng degree program at the University of Leeds, UK.
The authors have declared no conflict of interest.
Symbols used
-
- c* [m−3]
-
concentration at equilibrium (determined from correlation of solubility)
-
- ceq [m−3]
-
equilibrium concentration
-
- cmax [m−3]
-
maximum solution concentration
-
- Δcmax [m−3]
-
maximum concentration difference
-
- c0 [m−3]
-
concentration of instantaneously nucleated crystallites
-
- d [–]
-
dimensionality of crystal growth
-
- Dimp [m]
-
diameter of impeller
-
- J [m−3s−1]
-
nucleation rate
-
- KG [m1/ms−1]
-
growth rate constant
-
- kj [m3(m0−1)s−1]
-
empirical parameter of nucleation rate
-
- kv [m3−d]
-
crystallite growth shape factor
-
- m, n [–]
-
crystallite growth exponent
-
- m0 [–]
-
nucleation rate order
-
- q [°C min−1]
-
cooling rate
-
- q0 [°C s−1]
-
parameter in uc(q) dependence for progressive and instantaneous nucleation
-
- T [°C]
-
temperature
-
- Tc [°C]
-
crystallization temperature
-
- ΔTc [°C]
-
critical undercooling
-
- Tdiss [°C]
-
dissolution temperature
-
- Te [°C]
-
equilibrium temperature
-
- uc [–]
-
relative critical undercooling
-
- u0 [–]
-
relative undercooling at the moment of crystallite in instantaneous nucleation
-
- V [V]
-
voltage
Greek letters
-
- αdet [–]
-
detectable fraction of crystallized volume
-
- ρ [kg m−3]
-
density
-
- μ [kg m−1 s−1]
-
viscosity
Abbreviations
-
- KBHR
-
Kaschiev-Borrisova-Hammond-Roberts approach
-
- MSZW
-
metastable zone width
-
- pABA
-
p-aminobenzoic acid