Applying Reaction Kinetics to Pseudohomogeneous Methanation Modeling in Fixed-Bed Reactors
Abstract
Reactor simulations can reduce the effort when designing fixed-bed reactors for methanation processes. Several microkinetic models were developed under a variety of operating conditions. However, most production-scale fixed-bed methanation processes exceed the temperature range in which these kinetic models were obtained. In addition, heat and mass transport limitations strongly influence the reaction kinetics. In this work, microkinetic rate equations for CO and CO2 methanation were analyzed with respect to their suitability for high-temperature, pseudohomogeneous reactor modeling. The best-suited kinetic model was fitted to the operating conditions and validated by means of CFD simulations. It is shown that the simulations match the experimental data for various operating conditions.
1 Introduction
 (1)
(1) (2)
(2) (3)
(3)Due to the highly exothermic methanation reactions, catalyst deactivation by the formation of temperature hot spots and sintering is a crucial issue when designing fixed-bed reactors 2. Therefore, the simulation of fixed-bed reactors can reduce the effort and risk associated with the development of new reactor concepts or geometries by verification during the design phase. However, the simulation of catalytic fixed-bed reactors is challenging due to the complex interactions between chemical and physical processes. Reasons are, for example, the stochastic distribution of catalyst pellets inside the bed, the coupling of heat and mass transfer between the solid and gas phases, and the variety of occurring reactions.
For fixed-bed reactor simulations, a detailed resolution of the heterogeneous flow field can be conducted by means of particle-resolved computational fluid dynamics (CFD) models 3. However, when simulating large chemical reactors or complex geometries, shorter computation times are desired. Therefore, continuum models, which do not account for the detailed structure of the bed, are used frequently in methanation applications 4-7. In continuum models, balances can be accounted for by a single phase in pseudohomogeneous reactor models 7, or by the two phases separately in heterogeneous reactor models 6. Most models consider either 1D or 2D reactors. 2D models generally assume axial symmetry. 3D models are, despite their longer computation times, used to design industrial-scale plants 8.
Different kinetic rate equations are used in the literature to determine the reaction rates of the methanation process. The published kinetic reaction rates were obtained under different conditions, such as temperature and pressure range, as well as catalyst material, catalyst size, and test equipment 9. Macrokinetic models 8 are measured at elevated temperatures and include a combination of microkinetics and heat and mass transfer limitations. Therefore, they are only valid within small deviations of the operating conditions. Microkinetic models are obtained without the influence of external reaction rate limitations 10-13. When applying microkinetic models to a methanation reactor, the influence of transport limitations has to be taken into account.
This work was aimed at modeling small-scale, decentralized, bio-syngas methanation reactors with complex geometries, low partial pressures, and temperatures that exceed the temperature range in which the kinetic models were obtained. Therefore, a pseudohomogeneous CFD reactor model that considers limitation by pore diffusion through effectiveness factors based on Thiele moduli and radial gradients in porosity and velocity was developed. Several kinetic rate models for CO and CO2 methanation from the literature were analyzed with respect to their suitability for this model. A combination of kinetic rates was chosen and fitted to experimental results by a fitting factor. Finally, the developed model was validated under varying operating conditions. The influence of catalyst degradation and heat and mass transfer limitations other than pore diffusion effects were neglected.
2 Kinetic Models and Methods
In the following, several kinetic models from the literature are presented and compared with respect to their applicability to high-temperature pseudohomogeneous reactor modeling with effectiveness factors based on first-order Thiele moduli. In addition, the most important features of the Ansys Fluent CFD simulation model are presented.
2.1 Kinetic Models
A large variety of kinetic models has been proposed over the past decades. Overviews can be found in 4, 9, 14.
-
The model of Xu and Froment 10.
-
The model developed by Klose and Baerns 11, which was modified by Zhang et al. 15 and Rönsch et al. 9.
-
The model of Ducamp 13, which is the model of Xu and Froment with modified activity coefficients and adsorption constants.
-
Kinetic model 6b of Kopyscinski et al. 14.
-
The model of Koschany et al. 12.
In most studies, the set of three rate equations proposed by Xu and Froment 10 is used for methanation simulations 4, 16, 17. It was initially created to model methane steam reforming, which takes place at higher temperatures than the methanation reactions. However, by including the backwards reactions, the modeling of methanation is also possible. The temperature range in which the model was established is 573–848 K and the pressure range is 3–15 bar. The chosen catalyst was particularly designed for methane steam reforming.
Klose and Baerns 11 developed a CO methanation model with an 18 wt% Ni/Al2O3 catalyst in the temperature range of 453–557 K and the pressure range of 1–25 bar. This model was adapted by Zhang et al. 15 for a 50 wt% Ni/Al2O3 catalyst and complemented with the WGS reaction from the Xu-Froment kinetic model. Rönsch et al. 9 complemented CO methanation with a term that characterizes the reverse reaction and corrected the adsorption term of the WGS reaction. The model by Rönsch et al. only considers CO methanation and the WGS reaction.
Model 6b of Kopyscinski et al. 14 was developed in temperature and pressure ranges of 553–633 K and 1–2 bar. The CO methanation does not include a backwards reaction, as this model was developed for temperatures below 633 K, where the methane steam reforming activity is negligible.
Another possibility to attain a microkinetic model that is fitted to a specific catalyst under certain methanation conditions was presented by Ducamp 13. He adapted activity coefficients and adsorption constants of the three kinetic rates proposed by Xu and Froment to his experimental data. The temperature and pressure ranges of the experimental validation data used by Ducamp differ from those examined in 10. Ducamp fitted the kinetic model at temperatures between 553 and 673 K and pressures between 1 and 10 bar.
The model of Koschany et al. 12 only considers CO2 methanation and includes a backwards reaction. The kinetic model was fitted at temperatures ranging from 453 to 613 K and pressures ranging from 1 to 10 bar. An overview of the conditions under which the kinetic models were created is shown in Tab. 1.
|
Kinetic model |
Xu and Froment 10 |
Klose and Baerns 11 |
Zhang et al. 15 |
Ducamp 13 |
Koschany et al. 12 |
Kopyscinski et al. 14 |
|---|---|---|---|---|---|---|
|
Temperature [K] |
573–848 |
453–557 |
548–633 |
553–673 |
453–613 |
553-633 |
|
Pressure [bar] |
3–15 |
1–25 |
1–5 |
1–10 |
1–10 |
1–2 |
|
Catalyst Ni content [wt%] |
15 |
18 |
50 |
15 |
25 |
50 |
|
Catalyst support |
Ni/MgAl2O4 |
Ni/Al2O3 |
– |
Ni/MgAl2O4 |
Ni/Al2O3 |
Ni/Al2O3 |
|
Reactions considered |
CO, CO2, WGS |
CO (not backwards) |
CO (not backwards) |
CO, CO2, WGS |
CO2 |
CO (not backwards), WGS |
2.2 CFD Model
The steady-state model was developed with Ansys Fluent 2019R1. User-defined functions were used to implement the porosity distribution, the mass diffusivity, and the thermal conductivity.
2.2.1 Fixed-Bed Modeling
Pseudohomogeneous, continuous reactor models enable the time-efficient modeling of complex methanation reactor geometries. The equations of state are solved only for one phase, and interfacial heat and mass transport limitations cannot be considered. The influence of the catalyst pellets on the simulation, such as porosity distribution, thermal conductivity, and mass diffusivity, are considered via effective quantities, which consider both the gas phase and the solid catalyst.
The influence of transport limitations can be estimated via dimensionless quantities such as the two Mears criteria for external heat and mass transfer 18, the Weisz-Prater criterion for intraparticle mass transport 19, and the Anderson criterion for internal heat transport 20. In general, the influence of internal mass transport and external heat transport must be considered when modeling methanation reactors with large catalyst pellets, small pore radii, and small Reynolds numbers 21. To enable reasonable computation times for complex reactor geometries, only pore diffusion effects are considered in this work. The consideration of heat transfer limitations, which was not done here, might lead to superheating of the catalyst pellets and higher reaction rates in the front part of the reactor.
 (4)
(4) (5)
(5) (6)
(6)where ϕK is the Thiele modulus for a spherical particle, rcat the radius of a catalyst particle, kv the reaction rate coefficient, cs the species concentration, Deff the effective diffusion coefficient, and rV the volumetric reaction rate.
 (7)
(7) (8)
(8) (9)
(9)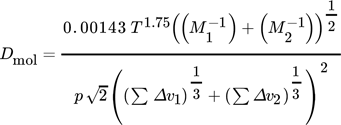 (10)
(10)where DKn is the Knudsen diffusion coefficient, dpore the pore diameter, Mi are molar masses, and v1 and v2 are diffusion volumes.
 (11)
(11)where Dpar is the parallel diffusion coefficient.
 (12)
(12) (13)
(13)where μ is the dynamic viscosity and u the velocity.
The thermal conductivity (including heat transfer by radiation) and the mass diffusivity are calculated on the basis of a stagnant and a dynamic contribution via the Λr model as described in 28, 29. Therefore, no wall heat transfer coefficient need be considered. The diffusivity is assumed to equal the diffusivity of CO in an H2 bulk for all species. As gradients in the radial direction are larger than those in the axial direction, the axial values for the thermal conductivity and the mass diffusivity are set equal to the values in the radial direction. The catalyst thermal conductivity is assumed to be λcat = 0.87 W m−1K−1 6. The emissivity coefficient of the catalyst pellets εcat is assumed to be unity due to the porous nature of the pellet. The pore diameter was obtained via BET analysis to 3.5 nm. Tab. 2 lists all simulation parameters.
|
Parameter |
Value |
|---|---|
|
Pore diameter dpore [nm] |
3.5 |
|
Catalyst pellet diameter dcat [mm] |
4.5 |
|
Emissivity coefficient εcat [–] |
1 |
|
Geometry parameter εpore/τ [–] |
0.1 |
|
Catalyst thermal conductivity λcat [W m−1K−1] |
0.87 |
|
Catalyst particle density ρcat [kg m−3] |
1535 |
|
Infinite bed porosity |
0.42 |
|
Wall thermal conductivity [W m−1K−1] |
19 |
2.2.2 Applied CFD Model
The modeled dented reactor pipe geometry consists of an inlet zone (void space), an inert zone (filled with inert pellets), and the porous zone (filled with catalyst). The structured mesh has 294 860 elements. Inflation in cell size towards the tube wall ensures the accuracy of the Λr model. The independence of the solution from the mesh was shown with a 594 000-cell mesh. The 2.9 mm stainless steel (AISI 314) wall of the reactor is modeled as a shell-conduction layer that only considers radial heat conduction and a constant temperature at the cooled side of the wall.
The mathematical model considers three Ansys Fluent submodels: The mass and energy model, which enables heat and mass transfer, the species model, which enables species transport and reactions, and the laminar viscous model, as laminar flow is assumed due to low Reynolds numbers.

2.3 Experimental Validation
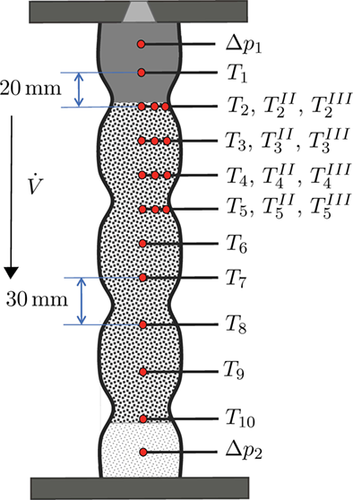
Measurements were conducted to validate the methanation reactor model. The dented reactor pipe was loaded with 265 mL of 25 wt% Ni/γ-Al2O3 catalyst on top of an inert material layer. Thermocouples (Type K) at ten axial locations measured the temperature. Mass flow controllers (Bronkhorst EL-Flow) controlled the inlet gas composition. In addition, the outlet gas composition was analyzed by using two online gas analyzers (NDIR, TCD, PMA, SICK S710).
A countercurrent jacket cooling system with Julabo Thermal Oil H350 as cooling fluid was used to cool the reactor walls to 533 or 563 K. The inlet gas mixture was preheated to the same temperature. Before approaching the measuring points, the catalyst was activated with a 90/10 mixture of N2/H2 for several hours at 673–693 K. The measuring points were approached and the temperatures and outlet gas compositions were averaged over at least 20 min after stationary conditions were reached.
3 Rate Analysis
Analysis of rate equations is crucial for the accuracy of the simulations and also influences the convergence behavior of CFD simulations. An examination with respect to temperature and the applicability of analytical effectiveness factors is shown in the following.
3.1 Extrapolation with Temperature
Due to the influence of heat and mass transport limitations, kinetic models cannot be obtained at temperatures that resemble the maximum temperatures in production-scale methanation reactors 15. Therefore, an extrapolation is necessary.
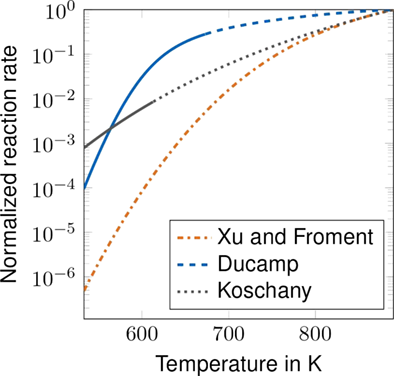
The normalized CO methanation kinetic rates of the presented kinetic models are shown in Fig. 3 for the rich gas composition (see Tab. 5), which is based on 30. All shown kinetic models except the CO methanation model of Kopyscinski et al., which only considers the forward reaction, consider the forward and the reverse reaction. The temperature range reflects typical temperatures for fixed-bed methanation reactors. Normalized reaction rates offer the possibility to compare the temperature dependence of the kinetic models without the influence of the catalyst activity. The solid parts of the lines indicate whether the kinetic model is within its range of validity (see Tab. 1).
The low partial pressures of the examined gas compositions also represent a possible deviation from the conditions under which the kinetic models were created. However, this deviation was not investigated in this work.
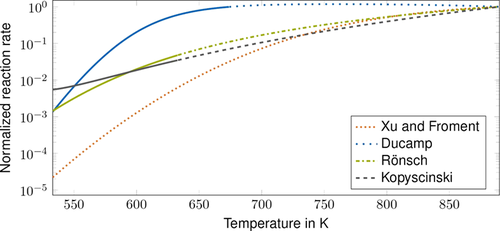
The model of Xu and Froment shows low normalized rates at low temperatures. This indicates a conflict between ignition and convergence behavior when using this model for simulations. Therefore, when using this model in simulations, the rate has to be adapted with a high fitting factor to enable ignition. The high reaction rates at higher temperatures then lead to large gradients, which influence the convergence behavior negatively.
The kinetic model parameterization by Ducamp shows a decrease in reaction rates above 750 K. Therefore, this model is not suitable to model methanation at high temperatures.
In contrast, the kinetic models by Rönsch et al. and Kopyscinski et al. show a moderate increase in reaction rates with temperature over the examined temperature range. Therefore, these models are suitable for modeling methanation reactors that operate over a broad temperature range.
Similar analyses can be conducted for the WGS reaction and CO2 methanation (Fig. 4). Considering CO2 methanation, the kinetic model by Koschany et al. shows the most favorable behavior for an extrapolation with temperature due to a well-defined increase in reaction rates and significant reaction rates at low temperatures.
3.2 Applicability of First-Order Effectiveness Factors
Depending on the kinetic model and the reaction conditions, CO methanation reactions proceed with a reaction order in the range of –1 to 1 with respect to CO. Negative reaction orders are obtained for high CO concentrations and low temperatures, whereas for low CO concentrations and high temperatures positive reaction orders are observed 11, 31. Negative reaction orders in high-temperature methanation applications can lead to effectiveness factors exceeding unity 32. Under reaction conditions that are strongly limited by pore diffusion phenomena, effectiveness factors based on Thiele moduli can be calculated for arbitrary non-negative reaction orders, by multiplying the effectiveness factor for first-order reactions with a constant factor. This is deduced from the constant vertical distance between the asymptotes in the double-logarithmic plot in Fig. 5. The error resulting from assuming a reaction order of 1 instead of 0 is ca.  for strongly limited operating conditions. However, the error that is made when assuming a positive reaction order instead of a negative reaction order can be much larger 32.
Therefore, a kinetic model that is suitable for pseudohomogeneous modeling should have positive reaction orders over the relevant range of operating conditions.
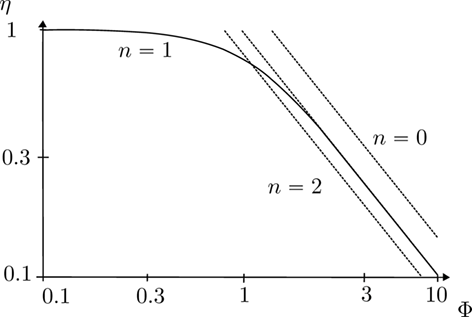
Fig. 6 shows the normalized CO methanation kinetic rates versus the CO partial pressure. The bulk is assumed to consist of H2 and the overall pressure of H2 and CO combined is set to be 1 bar. Negative reaction orders with respect to CO are indicated by an increase in reaction rates with a decrease in partial pressure. At a relatively low temperature of 533 K (Fig. 6a), significantly negative reaction orders can be observed for the kinetic models of Xu and Froment, Ducamp, and Rönsch et al. The kinetic model of Kopyscinski et al. does not show reaction rates far above unity. At a temperature of 890 K (Fig. 6b) significantly higher reaction orders are observed for all kinetic models, except for the kinetic model of Kopyscinski et al., which shows similar behavior compared to low temperatures.
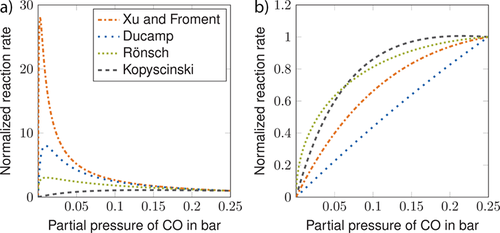
Fig. 7 shows the normalized CO2 methanation kinetic rates as a function of the partial pressure. The normalized kinetic rate by Xu and Froment equals the normalized kinetic rate by Ducamp and has a reaction order of unity. The model of Koschany et al. has reaction orders larger than zero over the whole range of partial pressures, as the rate monotonously decreases. The model of Rönsch et al. does not consider CO2 methanation explicitly.

3.3 Kinetic Model Adaption
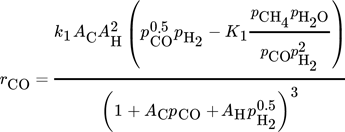
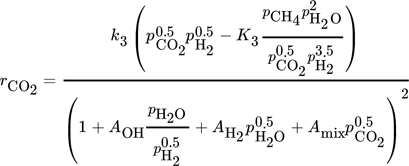
The CO methanation rate by Rönsch et al. and the CO2 methanation rate by Koschany show suitable rates over a wide range of temperatures and no or only slightly negative reaction orders. Therefore, these two kinetic rate equations (Eq. 15, Eq. 19) are combined with the WGS reaction by Rönsch et al. (Eq. 16) to conduct the CFD simulations. It was not possible to reach sufficient CO2 conversion by only considering the CO2 methanation as a combination of CO methanation and the WGS reaction. The kinetic model of Kopyscinski et al. is suitable for the CO-methanation, as well. However, due to the lack of a reverse CO methanation reaction, the model of Rönsch et al. was chosen.
Inhibition of CO2 methanation by the presence of CO, as discussed in the literature, is not considered 35. This inhibition is assumed to be not present, due to the strong pore diffusion limitation ( ). Therefore, the local CO content within the catalyst pore is low over the major part of the pore.
 (14)
(14)where rint is the internal reaction rate.
-
The catalyst activity.
-
Different pore geometry parameters or pore diameters, as
 for reaction conditions that are strongly limited by pore diffusion and under which only Knudsen diffusion inside the pores is relevant (see Eqs. (4), (7), (9)).
 -
Constant positive reaction orders other than unity under strongly pore diffusion limited reaction conditions (see Sect. 3.2).
The sF factors are chosen in a manner that the maximum temperature in the reactor is slightly above the experimentally determined temperature and the CH4 conversion rates are reasonable.
Therefore, the CO methanation rate and the WGS rate by Rönsch et al. are multiplied by a factor of sF,Rönsch = 3.5, and the CO2 methanation rate from the model by Koschany et al. by a factor of sF,Koschany = 4.
 (15)
(15) (16)
(16) (17)
(17) (18)
(18) (19)
(19) (20)
(20)where Ai are adsorption constants and R is the universal gas constant.
|
Parameter |
Value |
|---|---|
|
ACH4,0 [bar−1] |
6.65 × 10⁻⁴ |
|
ACO,0 [bar−1] |
8.23 × 10⁻⁵ |
|
AH2O,0 [–] |
1.77 × 10⁵ |
|
AH2,0 [ bar−1] |
6.12 × 10⁻⁹ |
|
AH,0 [ bar−0.5] |
1.6 × 10⁻² |
|
AC,0 [bar−0.5] |
5.8 × 10⁻⁴ |
|
k1,0 [mol kgcat−1s−1] |
7/3.6 × 1010 |
|
k2,0 [mol kgcat−1s−1bar−1] |
7.83/3.6 × 106 |
|
ΔHCO [kJ mol−1] |
–70.65 |
|
ΔHH [kJ mol−1] |
–16.0 |
|
ΔHC [kJ mol−1] |
–42.01 |
|
ΔHCH4 [kJ mol−1] |
–38.28 |
|
ΔHH2 [kJ mol−1] |
–82.9 |
|
ΔHH2O [kJ mol−1] |
88.68 |
|
E1 [kJ mol−1] |
103.0 |
|
E2 [kJ mol−1] |
62.0 |
|
sF,Rönsch [–] |
3.5 |
|
Parameter |
Value |
|---|---|
|
AMix,0 [ bar−0.5] |
0.82 |
|
AOH,0 [ bar−0.5] |
0.46 |
|
AH2,0 [ bar−0.5] |
0.5 |
|
K3,0 [mol gcat−1s−1bar−1] |
4.15 × 10⁻⁵ |
|
ΔHH2 [kJ mol−1] |
0.47 |
|
ΔHCO [kJ mol−1] |
–4.8 |
|
ΔHOH [kJ mol−1] |
29.3 |
|
ΔHMix [kJ mol−1] |
–9.9 |
|
ΔHO [kJ mol−1] |
–28.7 |
|
E3 [kJ mol−1] |
208.2 |
|
sF,Koschany [–] |
4 |
4 Simulation Results
The developed CFD model was used to calculate the axial temperature profiles for different operating conditions (see Tab. 5). The mixed methanation of CO and CO2 was tested with two starting gas compositions (lean gas and rich gas). The pure CO2 methanation was tested with a diluted (N2) stoichiometric starting gas composition at two different reactor pressures.
|
Parameter |
Rich gas |
Lean gas |
CO2 methanation |
|---|---|---|---|
|
yN2 [–] |
0 |
0 |
0.3 |
|
yH2 [–] |
0.7442 |
0.416 |
0.56 |
|
yCO [–] |
0.153 |
0.117 |
0 |
|
yCO2 [–] |
0.0478 |
0.467 |
0.14 |
|
yCH4 [–] |
0.0548 |
0 |
0 |
|
|
0.2 |
4.07 |
0 |
|
|
8.5 |
5.2 |
0 |
|
Tcool [K] |
533 |
533 |
563 |
|
prct [bar] |
1 |
1 |
1, 2 |
|
GHSV [h−1] |
2096 |
3608 |
2264 |
The simulated maximum temperatures are close to the experimentally determined values (see Figs. 8 and 9). The adiabatic temperatures under inlet gas conditions were obtained via equilibrium simulations based on a Gibbs Reactor in Aspen Plus and show that the maximum temperatures in the reactor stay below the adiabatic values. However, the steep rise in temperature and the high maximum temperature indicate almost adiabatic behavior. The hot-spot position is accurately predicted by the simulation model. However, for highly reactive operating conditions (i.e., rich gas and CO2 methanation at 2 bar), the temperature peak is predicted slightly too close to the reactor inlet. In the rear part, the temperature is overestimated by the simulation model for all operating conditions. This can be attributed to ongoing heat release by chemical reactions and low thermal conductivity in the gas phase. The thermal conductivity of the fixed-bed reactor might be underestimated by the used thermal conductivity model as shown in 36.
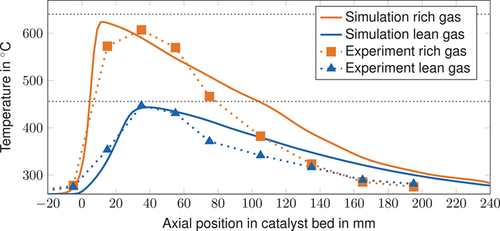
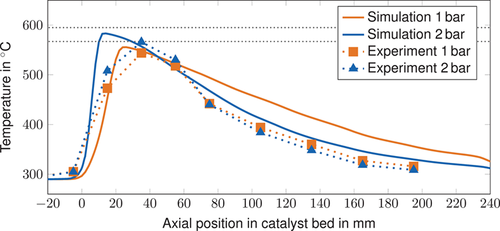
The developed model slightly underestimates the methane conversion, except for the lean gas measuring point, where more CO2 is converted (see Tab. 6). The difference exceeds the effect caused by a shift in the thermodynamic equilibrium due to higher outlet temperatures.
|
|
CH4 |
H2 |
CO2 |
CO |
||||
|---|---|---|---|---|---|---|---|---|
|
Measuring Point |
Sim |
Exp |
Sim |
Exp |
Sim |
Exp |
Sim |
Exp |
|
Rich gas |
59.5 |
71.8 |
37.1 |
27.1 |
3.4 |
1.0 |
0.0 |
0.1 |
|
Lean gas |
20.7 |
17.9 |
4.4 |
10.2 |
74.7 |
71.5 |
0.2 |
0.3 |
|
CO2 1 bar |
22.4 |
25.9 |
16.5 |
9.7 |
4.1 |
2.8 |
0.0 |
0.0 |
|
CO2 2 bar |
27.1 |
27.9 |
8.2 |
6.5 |
2.0 |
2.0 |
0.0 |
0.0 |
The results show that the developed kinetic model can be used for the design of complex methanation reactor geometries. In particular, the hot-spot characteristics are accurately predicted. The effectiveness factors based on Thiele moduli show values between 0.1 at the beginning of the reaction zone to 0.005 immediately in front of the hot spot. Therefore, the effectiveness factors based on analytical solutions strongly influence the simulation results.
5 Conclusion
A CFD model for catalytic methane synthesis in small-scale fixed-bed reactors was developed. A 3D reactor model that considers radial gradients in porosity and pore diffusion limitation by means of Thiele moduli was validated with various feed gas mixtures. Thus, a suitable kinetic model for high-temperature methanation applications was developed based on an analysis of kinetic models in the literature (Xu and Froment, Rönsch et al., Ducamp, Kopyscinski et al., Koschany et al.).
Kinetic models need to be adapted to pseudohomogeneous reactor models. This adaption can be conducted by fitting with a constant factor for strongly pore diffusion limited reaction conditions. This factor lumps the effects of catalyst activity, pore properties, and the fixed reaction order, which is assumed for the calculation of effectiveness factors.
The kinetic rate equation by Rönsch et al. was found to be best suited for modeling CO methanation in applications showing a wide range of temperatures. This results from a moderate increase in activity with temperature, which leads to realistic ignition behavior and correctly estimated hot-spot temperatures. For the same reasons, the kinetic model of Koschany et al. is favored for the CO2-methanation. Model 6b of Kopyscinski et al. shows reasonable behavior but does not comprise a reverse reaction. The normalized kinetic model by Xu and Froment is far too active when exceeding the temperature range in which the model was established. The kinetic model by Ducamp shows a decrease in activity at temperatures above the fitted range. Therefore, this model is not suitable for the temperature range that occurs in the examined reactor.
Effectiveness factors based on first-order Thiele moduli are able to reflect the behavior of the Langmuir-Hinshelwood mechanism for high temperatures. However, at low temperatures, negative reaction orders can lead to an excessive increase in reaction rates. This effect is particularly pronounced for the kinetic models by Xu and Froment and by Ducamp. Therefore, it is important to consider the behavior of the chosen kinetic rate equation when estimating the error, which is done by assuming effectiveness factors based on fixed-order reactions. Due to the wide range of values for effectiveness factors observed in the methanation reactor (0.005–0.1), the assumption of fixed effectiveness factors (e.g. 0.1) leads to large simulation errors and should be avoided.
The developed CFD model is able to predict the temperature profiles in a wide range of feed gas compositions, which include highly reactive CO/CO2 methanation conditions, accurately.
Acknowledgements
The BioCORE project is funded by the German Federal Ministry of Education and Research under FKZ 03VP05470. The author is responsible for the content of this publication.
The authors have declared no conflict of interest.
Symbols used
-
- Ai [differs]
-
adsorption constant
-
- c [mol m−3]
-
species concentration
-
- dw [m]
-
distance to wall
-
- dp [m]
-
catalyst particle diameter
-
- dpore [m]
-
catalyst pore diameter
-
- D [m2 s−1]
-
diffusion coefficient
-
- Ei [J mol−1]
-
activation energy
-
- GHSV [h−1]
-
gas hourly space velocity
-
- ΔHr [J/mol]
-
enthalpy of reaction
-
- ΔHi [J/mol]
-
adsorption enthalpy
-
- k [differs]
-
reaction rate coefficient
-
- Ki [–]
-
equilibrium constant
-
 [kg s−1]
 -
mass flow
-
- M [kg mol−1]
-
molar mass
-
- n [–]
-
reaction order
-
- p [Pa]
-
total pressure
-
- pi [Pa]
-
partial pressure
-
- rcat [m]
-
catalyst particle radius
-
- ri [mol kg−1s−1]
-
reaction rate per unit catalyst mass
-
- rV [mol m−3s−1]
-
volumetric reaction rate
-
- R [J mol−1K−1]
-
universal gas constant
-
- sF [–]
-
fitting parameter
-
- T [K]
-
temperature
-
- Tcool [K]
-
cooling temperature
-
- u [m s−1]
-
velocity
-
- v [–]
-
diffusion volume
-
 [m3 s−1]
 -
volumetric flow rate
-
- yi [–]
-
mole fraction
-
- z [–]
-
z coordinate
Greek letters
-
- εcat [–]
-
emissivity coefficient of the catalyst pellet
-
- εpore [–]
-
porosity of the catalyst particle
-
- η [–]
-
effectiveness factor
-
- λcat [W m−1K−1]
-
thermal conductivity
-
- μ [Pa s]
-
dynamic viscosity
-
- ρ [kg m−3]
-
density
-
- τ [–]
-
tortuosity of the catalyst particle
-
- ϕK [–]
-
Thiele modulus sphere
-
- Ψ [–]
-
porosity
-
 [–]
[–] -
infinite bed porosity
Subscripts
-
- cat
-
catalyst
-
- eff
-
effective
-
- int
-
internal
-
- Kn
-
Knudsen
-
- Mix
-
mixture
-
- mol
-
molar
-
- par
-
parallel
-
- rct
-
reactor
-
- v
-
volumetric
-
- 0
-
standard state
Abbreviations
-
- CFD
-
computational fluid dynamics
-
- NDIR
-
nondispersive infrared
-
- PMA
-
paramagnetic analyzer
-
- TCD
-
thermal conductivity detector
-
- WGS
-
water-gas shift


 [–]
[–]
 [g min−1]
 [L min−1]


