Molecular characteristics of residual cancer and stromal cells after chemoradiotherapy for gastric cancer: report of four cases
Key Clinical Message
Four patients with gastric cancer underwent 5-fluorouracil and cisplatin-based chemoradiotherapy followed by surgery. Expression analysis of chemoradiosensitivity related genes in residual cancer using formalin-fixed paraffin-embedded specimens may be useful when determining a chemotherapy regimen for disease recurrence after chemoradiotherapy for gastric cancer.
Introduction
Theoretically, preoperative chemoradiotherapy (CRT) may increase the curative (R0) resection rate due to tumor downsizing, and decrease the local and systemic recurrence rate, thus improving disease-free and overall survival. The strategy of preoperative CRT for locally advanced or bulky gastric cancer is emerging as a promising treatment modality, although it is still in the experimental stage 1-5. Several reports have shown that the R0 resection rate was ~70% and the pathologic complete response rate ranged from 20% to 30% in gastric cancer patients treated with preoperative CRT followed by surgery 3-5. However, rates of local recurrence and distant metastasis have been reported to range from 30% to 50% in gastric cancer patients after preoperative CRT followed by surgery 2-4.
Recently, pathologic response or quantification of residual cancer after CRT has shown to be significantly associated with the clinical outcome after preoperative CRT followed by surgery in esophageal 6-8, gastric 9, 10, and rectal cancer 11, 12. Moreover, post-CRT pathologic response appears to predict disease-free survival and overall survival rather than pre-CRT clinical response 13.
In addition, to the clinical importance regarding the quantity of residual cancer, gene expression profiles in residual cancer may have a significant role in the treatment of recurrence in gastric cancer patients who undergo preoperative CRT followed by surgery 14. Reactive cancer stroma surrounding residual cancer cells may play an important role not only in responsiveness to CRT but also in disease recurrence after CRT 15. Thus, we focused on the gene expression of both residual cancer and stroma in formalin-fixed paraffin-embedded (FFPE) specimens after preoperative CRT.
This preliminary study aimed to evaluate the expression of chemoradiosensitivity-related genes in both residual gastric cancer and stroma after preoperative CRT. We evaluated thymidylate synthase (TS), dihydropyrimidine dehydrogenase (DPD), thymidine phosphorylase (TP), and orotate phosphoribosyl transferase (OPRT) as 5-FU pathway genes; excision repair cross-complementation group 1 (ERCC1) as a CDDP pathway gene 16; and epidermal growth factor receptor (EGFR), vascular endothelial growth factor (VEGF), hypoxia-inducible factor-1alpha (HIF1A), and cyclooxygenase 2 (COX2) as radioresistant genes 17-20.
Material and Methods
Patients
From 2002 to 2005, five patients (men, mean age 63.4 years; range: 52–73) with locally advanced or bulky gastric adenocarcinoma were eligible for preoperative CRT. One patient had an unresectable tumor after CRT. The other four patients underwent resection of the primary tumor and regional lymph nodes. These four patients were included in the study after obtaining a written informed consent from each of them.
5-Fluorouracil- and cisplatin-based CRT regimen
The regimen included four cycles of 5-FU, administered at a dose of 600 mg/m2 intravenously for 24 h and UFT (Tegafur and Uracil) at a dose 400 mg/body weight orally for 5 days along with CDDP administered intravenously at a dose of 20–40 mg/day for 5 days with concurrent 40 Gy radiation, followed by gastric resection. Preoperative radiotherapy was delivered to both the primary tumor and the peritumoral area at a dose of 40 Gy in 20 fractions within 4 weeks (2 Gy/day for 5 days a week). The time interval between preoperative CRT and surgery was 2–3 weeks.
Clinical and pathologic response
Gastric cancer was staged based on the Guidelines for the Japanese Classification of Gastric Carcinoma provided by the Japanese Society for Gastric Cancer Association (JGCA). 21 Clinical response was evaluated by barium swallow, endoscopy, and computed tomography and graded as complete response, partial response, no change, or progressive disease. The degree of pathologic response was classified into four categories: grade 0, neither necrosis nor regressive changes; grade 1, more than 2/3 vital residual cancer cells (VRTCs); grade 2, less than 1/3 VRTCs; or grade 3, no VRTCs.
Microdissection in FFPE specimens
Tumor specimens were fixed in 10% v/v formaldehyde solution and embedded in paraffin. Ten-μm-thick sections of the FFPE specimens stained with nuclear fast red were manually microdissected to collect the residual cancer and stromal cells, using hematoxylin and eosin sections as a reference.
RNA extraction from FFPE specimens
Microdissected samples were digested with proteinase K in lysis buffer containing Tris-HCl, ethylene-diamine-tetraacetic acid, and sodium dodecyl sulfate as previously reported with minor modification 22. RNA was purified by phenol and chloroform extraction.
cDNA synthesis
cDNA was synthesized with random hexamer primer and Superscript III reverse transcriptase (Invitrogen, Carlsbad, CA) according to the manufacturer's instructions.
Real-time quantitative RT-PCR
Real-time quantitative RT-PCR (polymerase chain reaction) analysis was performed using an ABI PRISM 7700 Sequence Detection System (Applied Biosystems, Inc., Foster City, CA). Primers and probes for beta actin, TP, OPRT, VEGF, HIF1a, and COX2 were designed with primer3 software (Biology Workbench Version 3.2, San Diego Supercomputer Center, at the University of California, San Diego). Primers and probes for TS, DPD, ERCC1, and EGFR were synthesized according to previously published sequences 23. Sequences are shown in Table 1. PCR was performed in a final volume of 25 μL using a Taqman Universal PCR Master Mix (Applied Biosystems) containing 0.5 μL cDNA, 900 nmol/L of each primer, and 200 nmol/L of probe for the respective genes. Cycling conditions were 50°C for 2 min and 95°C for 10 min followed by 40 cycles at 95°C for 15 sec and 60°C for 1 min.
| Gene | Primer and probe | Sequence |
|---|---|---|
| TS | Forward primer | 5′-GCCTCGGTGTGCCTTTCA-3′ |
| Reverse primer | 5′-CCCGTGATGTGCGCAAT-3′ | |
| Probe | 5′-TCGCCAGCTACGCCCTGCTCA-3′ | |
| DPD | Forward primer | 5′-AGGACGCAAGGAGGGTTTG-3′ |
| Reverse primer | 5′-GTCCGCCGAGTCCTTACTGA-3′ | |
| Probe | 5′-CAGTGCCTACAGTCTCGAGTCTGCCAGTG-3′ | |
| OPRT | Forward primer | 5′-CCAGGAGTTCAGTTGGAAGC-3′ |
| Reverse primer | 5′-GGAACCTCGTTTGCCAATAA-3′ | |
| Probe | 5′-TTGTACTGTTGGCCAAGATTATCTCCTCCT-3′ | |
| TP | Forward primer | 5′-GCTGGAGTCTATTCCTGGATTC-3′ |
| Reverse primer | 5′-TCTGACCCACGATACAGCAG-3′ | |
| Probe | 5′-TCCAGAGCCCAGAGCAGATGCA-3′ | |
| ERCC1 | Forward primer | 5′-GGGAATTTGGCGACGTAATTC-3′ |
| Reverse primer | 5′-GCGGAGGCTGAGGAACAG-3′ | |
| Probe | 5′-CACAGGTGCTCTGGCCCAGCACATA-3′ | |
| VEGF | Forward primer | 5′-CAGAAGGAGGAGGGCAGAA-3′ |
| Reverse primer | 5′-CTCGATTGGATGGCAGTAGC-3′ | |
| Probe | 5′-TCCATGAACTTCACCACTTCGTGATGA-3′ | |
| HIF1A | Forward primer | 5′-CCGCTGGAGACACAATCATA-3′ |
| Reverse primer | 5′-CTTCCTCAAGTTGCTGGTCA-3′ | |
| Probe | 5′-TGGCAGCAACGACACAGAAACTGA-3′ | |
| EGFR | Forward primer | 5′-CCTATGTGCAGAGGAATTATGATCTTT-3′ |
| Reverse primer | 5′-CCACTGTGTTGAGGGCAATG-3′ | |
| Probe | 5′-AACCAGCCACCTCCTGGATGGTCTTTAA-3′ | |
| COX2 | Forward primer | 5′-ATTCCCTTCCTTCGAAATGC-3′ |
| Reverse primer | 5′-TCAGCATTGTAAGTTGGTGGA-3′ | |
| Probe | 5′-CTTGACATCCAGATCACATTTGATTGACAG-3′ | |
| Beta actin | Forward primer | 5′-ACAGAGCCTCGCCTTTGC-3′ |
| Reverse primer | 5′-GCGGCGATATCATCATCC-3′ | |
| Probe | 5′-CCGCCGCCAGCTCACCAT-3′ |
Relative mRNA levels of target genes
Relative mRNA levels were determined by the standard curve method. The standard curves and line equations were generated using fivefold serially diluted solutions of cDNA from the gastric cancer cell line MKN74. All standard curves were linear in the analyzed range with an acceptable correlation coefficient (R2). The amount of target gene expression was calculated from the standard curve. Quantitative normalization of cDNA in each sample was performed using the expression of the beta actin gene as an internal control. Finally, mRNA levels of the target gene were presented as ratios to mRNA levels of beta actin. Real-time PCR assays were performed twice for each sample and mean values were used for calculations of the mRNA levels.
Immunohistochemistry for Ki-67
To determine whether residual cancer cells were viable, immunohistochemistry for Ki-67 as a marker for proliferative activity was performed. Resected specimens were fixed in formalin and embedded in paraffin wax, according to routine procedures. Mouse monoclonal antibody MIB-1 (Zymed Laboratories, Inc., San Francisco, CA) for Ki-67 was used in this study. Three-μm-thick sections of FFPE tissue samples were deparaffinized by incubation in xylene and rinsed in graded ethanol–water solutions. Antigen retrieval for Ki-67 was performed by heating the samples in an autoclave for 15 min at 121°C in citric buffer (pH 6.0). Samples were blocked with normal horse serum and endogenous peroxidases were quenched with 0.3% H2O2 in methanol. Sections were incubated with anti-Ki-67 (1:1) antibodies for 2 h at 4°C, rinsed, and then incubated with the peroxidase-conjugated goat anti-mouse secondary antibody for 1 h at room temperature. The detection substrate was 3,3-diaminobenzidine, and all sections were counterstained with Meier's hematoxylin before mounting. Negative controls were run simultaneously with preimmune immunoglobulin. Nuclear staining of Ki-67 was considered positive.
Statistical analysis
All statistical analyses were performed using JMP version 5 (SAS Institute Inc., Cary, NC). Values of each target gene are expressed as median value (interquartile range). The differences in target gene levels between residual cancer and stromal cells were evaluated using the Mann–Whitney U test. P < 0.05 was considered statistically significant.
Results
Patient characteristics, tumor stage, and clinical outcome
All four male patients had a mean age of 61 years (range: 52–73). Two patients underwent microscopic complete resection (R0 resection), whereas the other two had incomplete resection with macroscopic residual peritoneal metastasis. Mean survival time was 7.4 months (range: 1–16.6). All patients died of disease recurrence (Table 2). Possible explanations of our unfavorable results suggested that the patients were in the final stage of the disease with potentially positive lymph nodes at diagnosis and that our CRT regimen was less intensive without induction chemotherapy.
| No of patients | Age/gender | Clinical stage | Pathologic stage | Clinical response | Pathologic response | Resection status | Survival time/prognosis |
|---|---|---|---|---|---|---|---|
| 1 | 52/M | T3N1H0P0M0Stage3a | T2N3H0P0M0Stage4 | PR | Grade 0 | R0 | 9.5 months/death |
| 2 | 64/M | T3N2H0P0M0Stage3b | T2N2H0P0M0Stage3a | NC | Grade 1 | R0 | 16.6 months/death |
| 3 | 55/M | T4N2H0P0M0Stage4 | T3N3H0P0M0Stage4 | NC | Grade 0 | R2 | 2.6 months/death |
| 4 | 73/M | T3N3H0P0M0Stage4 | T2N2H0P1M0Stage4 | NC | Grade 0 | R2 | 1.0 months/death |
- PR, partial response; NC, no change; R0, curative resection with clear margin macroscopically and microscopically; R2, resection with macroscopic residual tumor.
Pathologic response to CRT
One patient was classified as partial response and three as no change. According to the pathologic response criteria, one of the four patients was categorized as grade 1 and 3 as grade 0.
In the specimen showing grade 1 pathologic response, mucin lakes with small cancer nests, dense fibrosis, and nests of residual cancer with fibrotic stromal reaction were observed (Fig. 1A).
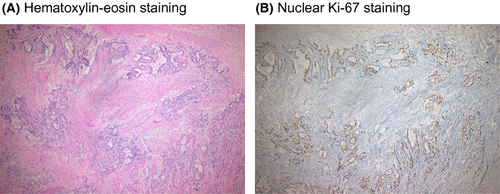
Ki-67 nuclear staining in residual cancer cells
Nuclear immunoreactivity of Ki-67, a marker of proliferative activity, was found in residual cancer nests, which suggested that residual cancer cells were considered viable (Fig. 1B).
Expression of 5-FU pathway genes in residual cancer and stromal cells
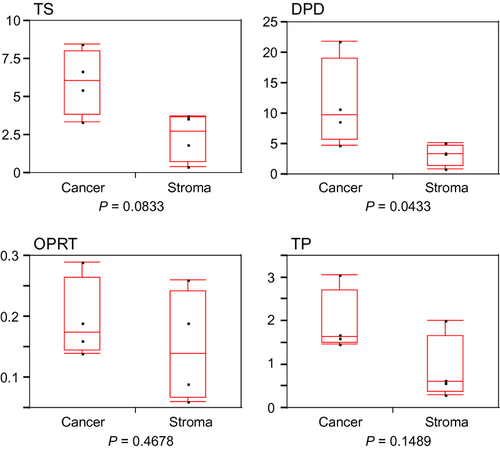
Median values (interquartile range) of TS, DPD, OPRT, and TP are shown in Table 3. DPD was significantly higher in residual cancer than in stroma (P = 0.0433). There was a trend toward increase in TS in residual cancer compared with stroma (P = 0.0833). No significant differences in OPRT and TP between residual cancer and stroma were observed (Fig. 2). These results suggested that residual cancer showed a 5-FU-resistant phenotype.
| Gene of target | Residual cancer cells | Stromal cells | P valuea |
|---|---|---|---|
| TS | 6.06 (3.86–8.04) | 2.73 (0.76–3.70) | 0.0833 |
| DPD | 9.74 (5.80–19.13) | 3.45 (1.50–4.77) | 0.0433 |
| OPRT | 0.18 (0.15–0.27) | 0.14 (0.07–0.24) | 0.4678 |
| TP | 1.64 (1.50–2.72) | 0.61 (0.37–1.67) | 0.1489 |
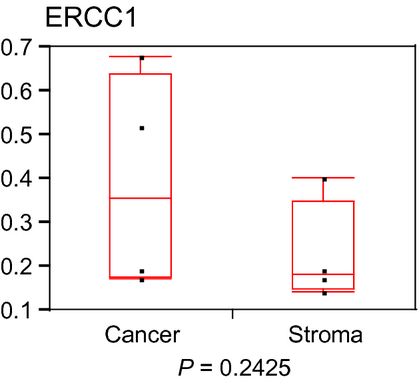
| ERCC1 | 0.36 (0.18–0.64) | 0.18 (0.15–0.35) | 0.2425 |
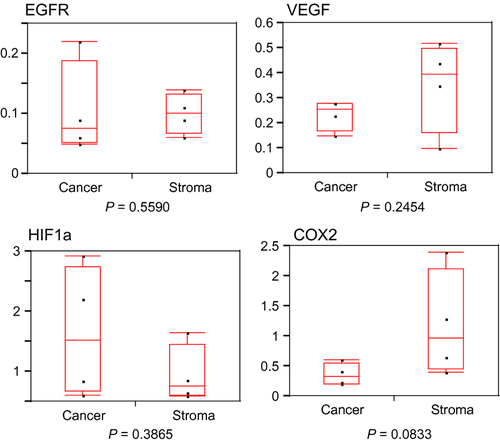
| VEGF | 0.08 (0.05–0.19) | 0.10 (0.07–0.13) | 0.559 |
| HIF1A | 0.26 (0.18–0.28) | 0.40 (0.16–0.50) | 0.2454 |
| EGFR | 1.52 (0.67–2.74) | 0.76 (0.61–1.45) | 0.3865 |
| COX2 | 0.32 (0.21–0.55) | 0.97 (0.45–2.12) | 0.0833 |
- Values of each target gene are expressed as median value (interquartile range).
- a Mann–Whitney U test.
Expression of CDDP pathway gene in residual cancer and stromal cells
The median value (interquartile range) of ERCC1 is shown in Table 3. There was no significant difference in ERCC1 level between residual cancer and stroma (Fig. 3).
Expression of radioresistant genes in residual cancer and stromal cells
Median values (interquartile range) of EGFR, VEGF, HIF1a, and COX2 are shown in Table 3. A trend toward decrease in COX2 was found in residual cancer compared with stroma (P = 0.0833). No significant differences in EGFR, VEGF, and HIF1a between residual cancer and stroma were observed (Fig. 4). These results suggested that residual cancer showed a radiation-sensitive phenotype compared with stroma.
Discussion
In this study, we showed that residual gastric cancer cells after CRT had higher TS and DPD mRNA levels and a lower COX2 mRNA level, as compared with stromal cells after CRT. Since TS and DPD have shown to be important biomarkers for predicting tumor sensitivity to 5-FU-based therapy 24, our results suggested that higher TS and DPD expression may indicate a 5-FU-resistant phenotype in residual gastric cancer after CRT. In contrast, higher COX-2 expression has been associated with poor response to radiotherapy (radioresistant) in several cancers 25-27. Therefore, lower COX2 expression in residual gastric cancer cells after CRT may indicate a good response to radiotherapy (radiosensitive) for recurrent tumor after CRT.
Sugiyama and colleagues reported that the differential expression patterns of genes related to angiogenesis, invasion and metastasis, cell adhesion, and proliferation were observed in colon cancers, surrounding cancer stroma, normal stroma, and normal mucosa using laser capture microdissection and subsequent focused gene arrays 28. We also demonstrated that a difference in several chemoradiosensitivity genes such as TS, DPD, and COX2 were found between residual gastric cancer cells and stromal cells after CRT.
Tumor tissue is composed of tumor cells and surrounding stroma, which includes extracellular matrix and mesenchymal cells such as fibroblasts, myofibroblasts, endothelial cells, and bone marrow-derived cells. Tumor microenvironment or tumor-stroma interaction has been associated with not only tumor progression but also efficacy of chemotherapy or radiotherapy 29.
Previous reports and our findings suggest that analysis of gene expression profiles of tumor cells and surrounding stromal cells may be useful for a comprehensive understanding of not only tumor progression but also the responsiveness of chemoradiotherapy.
Because of higher recurrence rate, adjuvant treatments including chemotherapy or radiotherapy may be needed for gastric cancer patients treated with CRT followed by surgery 2-4. Although our results are based on a small number of patients and are very preliminary, gene expression profiles in residual cancer cells and stromal cells may provide significant information for predicting chemoradiosensitivity in recurrence of gastric cancer after CRT.
In conclusion, we showed that CRT may alter gene expression phenotypes related to chemoradiosensitivity in both gastric cancer cells and stromal cells. Gene expression analysis using post-CRT FFPE specimens may be useful when determining treatment regimens for disease recurrence after CRT followed by surgery.
Conflict of Interest
None declared.


