Inhibition of lipid metabolism exerts antitumor effects on rhabdomyosarcoma
Funding information
This work was supported by the grant received from Children's Cancer Association of Japan.
Abstract
Rhabdomyosarcoma exhibits tumor-specific energy metabolic changes that include the Warburg effect. Since targeting cancer metabolism is a promising therapeutic approach, we examined the antitumor effects of suppressing lipid metabolism in rhabdomyosarcoma. We suppressed lipid metabolism in rhabdomyosarcoma cells in vitro by administering an inhibitor of malonyl-CoA decarboxylase, which increases malonyl-CoA and decreases fatty acid oxidation. Suppression of lipid metabolism in rhabdomyosarcoma cells decreased cell proliferation by inducing cell cycle arrest. Metabolomic analysis showed an increase in glycolysis and inactivation of the pentose phosphate pathway. Immunoblotting analysis revealed upregulated expression of the autophagy marker LC3A/B-II due to increased phosphorylation of AMP-activated protein kinase, a nutrient sensor. p21 protein expression level also increased. Inhibition of both lipid metabolism and autophagy suppressed tumor proliferation and increased apoptosis. In vivo studies involved injection of human Rh30 cells into the gastrocnemius muscle of 6-week-old female nude mice, which were divided into normal chow and low-fat diet groups. The mice fed a low-fat diet for 21 days showed reduced tumor growth compared to normal chow diet-fed mice. Suppression of lipid metabolism disrupted the equilibrium of the cancer-specific metabolism in rhabdomyosarcoma, resulting in a tumor growth-inhibition effect. Therefore, the development of treatments focusing on the lipid dependence of rhabdomyosarcoma is highly promising.
1 INTRODUCTION
Rhabdomyosarcoma (RMS), the most prevalent malignancy among pediatric soft tissue tumors,1-3 arises from myogenic mesenchymal progenitors and occurs in various organs and tissues such as the bladder, gonads, nasopharyngeal cavity, paranasal sinuses, parameninges, orbit, and skeletal muscle.4, 5 While recent progress in combined modality therapy has slightly improved the prognosis of patients with RMS, long-term organ damage due to treatment-related toxicity has become a serious concern. Therefore, there is an urgent need to develop tumor-specific therapies with few side effects.
Rapidly proliferating cancer cells, especially solid tumor cells, are prone to hypoxia and nutrient starvation, resulting in metabolic reprogramming to maintain their enormous energy demands. It is widely known that glucose uptake is higher in cancer cells than in normal cells. In addition, cancer cells synthesize ATP primarily via glycolysis in the cytoplasm, which does not require oxygen, rather than oxidative phosphorylation in mitochondria, even in an oxygen-rich environment. This phenomenon was first proposed by Otto Warburg approximately 100 years ago, and later named as the Warburg effect or “aerobic glycolysis.”6, 7 Moreover, cancer cells activate the pentose phosphate pathway (PPP), a branched pathway from glycolysis, to increase nucleic acid supply in order to maintain their rapid proliferative capacity, and NADPH synthesis to cope with oxidative stress.8, 9 It has been reported that glycolysis is significantly upregulated compared with normal myocytes in the alveolar-type RMS cell line Rh30.10 Pyruvate kinase M (Pkm) is involved in the synthesis of pyruvate, the final product of glycolysis, and has two splicing variants, Pkm1 and Pkm2.11 Pkm1-derived pyruvate is preferentially destined for the mitochondrial tricarboxylic acid (TCA) cycle, while Pkm2-derived pyruvate is predominantly destined for lactate production. Most cancer cells significantly express Pkm2, and Rh30 is no exception.12 Therefore, the glucose taken up by RMS cells is mostly used for lactate synthesis, not glucose oxidation in the mitochondria. However, at the same time, it has been shown that the mitochondrial TCA cycle in Rh30 is enhanced, suggesting that energy substrates other than glucose, such as glutamic acid and fatty acids, may be oxidized.10 Recently, it has been reported that lipids are indispensable in some types of cancer cells, such as breast and prostate cancer cells.13, 14 Both lipid anabolism and catabolism are important metabolic pathways, with lipid anabolism (such as energy storage and lipid synthesis) being essential for cell membrane construction, while lipid catabolism (such as ATP synthesis by fatty acid oxidation) being critical for energy generation.
Thus, we hypothesized that suppression of lipid metabolism in RMS exerts an antitumor effect through an imbalance in cancer-specific energy metabolism. In the present study, we verified this hypothesis using both in vitro and in vivo experiments.
2 MATERIALS AND METHODS
2.1 Cell culture
We used the following human alveolar RMS (ARMS) cell lines: SJ-Rh30 (Rh30)15 and Rh41 (kindly provided by Peter J. Houghton, M.D.; Greehey Children's Cancer Research Institute, University of Texas Health Science Center, San Antonio TX, USA)16 and the human embryonal RMS (ERMS) cell lines, RD (Japanese Collection of Research Bioresources Cell Bank), and KP-RMS-KH (KH).17-19 Cells were cultured in DMEM supplemented with 1% FBS and 1% penicillin-streptomycin at 37℃ in a 5% CO2 incubator; 1% FBS was used to imitate the living environment typical of various solid tumors, where nutrients and growth factors are likely to be deficient due to the inadequate vascularization.
2.2 Animals and diets
Five-week-old female BALB/c nu/nu nude mice (n = 10, bodyweight 16–18 g) were purchased from Japan SLC, Inc. (Hamamatsu, Japan). All experiments and procedures were conducted in accordance with the Institutional Animal Care and Use Committee guidelines. Animal experiments were approved by the Committee for Animal Research of Kyoto Prefectural University of Medicine (Authorization No. M2019-516). We injected 5 × 10⁶ luciferase-positive Rh30 cells into the right gastrocnemius muscle of the mice. After confirming tumor engraftment, the mice were randomly divided into two groups: one was fed a normal chow diet (NCD; fat content 12.0%/kcal) and the other was fed a low-fat diet (LFD; fat content 1.3%/kcal). These diets were prepared by CLAIR Japan Inc. (Tokyo, Japan). Animals received food and sterile water ad libitum. Food intake was measured during the experiments. Tumor growth was monitored with in vivo bioluminescence imaging. The mice were intraperitoneally injected with D-luciferin (150 mg/kg) 10 min before imaging and then anesthetized with 2% isoflurane during imaging. Images were captured with an IVIS Lumina Series III (PerkinElmer, Inc., Waltham, MA, USA) and Living Image v.2 (PerkinElmer, Inc.) was used to quantify regions of interest (ROIs) on the displayed images in photons per second (ph/s). These animal experiments were performed in accordance with the Animal Research Reporting In Vivo experiments (ARRIVE) guidelines.
2.3 Inhibitory reagents
The malonyl-CoA decarboxylase inhibitor MCDi (CBM-3001106) was kindly provided by Gary D. Lopaschuk.20, 21 Bafilomycin A1 (Baf A1) was purchased from Cayman Chemical (Ann Arbor, MI, USA). These reagents were dissolved in DMSO. In all experiments, the percentage of DMSO was less than 0.1%.
2.4 WST-8 cell viability assay
To assess cell viability, WST-8 colorimetric assays were performed using the Cell Counting Kit-8 (Nacalai Tesque, Kyoto, Japan) according to the manufacturer's protocol. The cells were seeded in 96-well plates in 100 µl culture medium for 24 h and the necessary reagents were added. Cell viability was determined by measuring the optical density (OD) at 450 nm with a microplate reader (MultiskanTM JX; Thermo Labsystems, Santa Rosa, CA, USA).
2.5 Cell cycle analysis
To examine the effects of MCDi on the cell cycle, we cultured RMS cells with MCDi (10 µM) or DMSO for 24 h. The cells were then isolated by scraping, washed with PBS, and incubated at room temperature (22–25℃) with propidium iodide for 30 min to stain the DNA. We determined DNA content using a FACS Calibur flow cytometer (BD Biosciences, San Jose, CA, USA) and analyzed the status of the cell cycle using FlowJo v.9 (FlowJo LLC, Ashland, OR, USA), as described previously.1
2.6 Apoptosis analysis
We analyzed cell death after Annexin V-FITC/propidium iodide staining using a TACS annexin-V apoptosis detection kit (R&D BioSystems, Minneapolis, MN, USA) according to the manufacturer's instructions. Data were analyzed with FlowJo.
2.7 Quantitative real-time PCR (qRT-PCR)
To determine the mRNA expression levels, we extracted total RNA from RMS cells and tumor tissues were removed from xenograft models using a NucleoSpin RNA II kit (Macherey-Nagel, Duren, Germany). cDNA was synthesized using ReverTra Ace qPCR RT Master Mix (Toyobo, Osaka, Japan). We prepared the working solution for qRT-PCR with TB Green Premix Ex Taq II (Tli RNaseH Plus) (Takara, Shiga, Japan) and analyzed it using the AB 7500 Real-Time PCR System (Applied Biosystems, Tokyo, Japan). The PCR steps were as follows: initial denaturation at 95℃ for 30 s, followed by 40 cycles of 95℃ for 5 s, and 60℃ for 34 s. The PCR primer sequences are shown in Table S1. β-actin was used as the internal standard.
2.8 Western blot
RMS cells were administered MCDi or DMSO and incubated for 24 h. Cells were then lysed with RIPA lysis buffer (Nacalai Tesque). The products obtained by homogenization were centrifuged at 10,000×g for 5 min at 4℃ and the supernatants were collected. Protein concentrations were measured with a Bio-Rad protein assay kit (Bio-Rad, Tokyo, Japan). The proteins were electrophoresed on 4%–20% sodium dodecyl sulfate polyacrylamide gels followed by transferring to PVDF membranes and blocking with Blocking One (Nacalai Tesque). Can Get Signal solutions 1 and 2 (Toyobo) were used to diluted the primary and secondary antibodies, respectively. The membrane was incubated with primary antibodies against total AMP-activated protein kinase (AMPKα) (1:1000), phospho-AMPKα (Thr172) (1:1000), tuberous sclerosis 2 (TSC2) (1:1000), phospho-TSC2 (1:1000), p70S6kinase (p70S6K) (1:1000), phospho-p70S6K (1:1000), Waf-p21 (p21) (1:1000), LC3A/B (1:1000), and β-actin (1:5000). All abovementioned primary antibodies were purchased from Cell Signaling Technology (CST; Danvers, MA, USA). The secondary antibody was dissolved with HRP-conjugated donkey anti-rabbit immunoglobulin G (IgG) to 1:10,000 (for AMPK, p-AMPK, TSC2, p-TSC2, p70S6K, p-p70S6K, p21, LC3A/B) (GE Healthcare, Tokyo, Japan) or HRP-conjugated sheep anti-mouse IgG (for β-actin) (GE Healthcare). Antibody binding was measured using an enhanced HRP-luminol chemiluminescence system. Raw western blot data are represented in Figure S1.
2.9 Immunofluorescence microscopy
Cells were cultured on Falcon 8-well Culture Slides (354118, BD Falcon, Corning, Inc.), then fixed with 4% paraformaldehyde for 20 min at room temperature, permeabilized with 0.1% Triton X-100, washed with PBS, and blocked with Blocking One Histo (Nacalai Tesque). Then, they were incubated with anti-LC3A/B antibody (1:100) overnight at 4℃ then with Alexa Fluor 488-conjugated goat anti-rabbit IgG (H+L) cross-absorbed secondary antibody (A-11008, 1:200, Life Technologies, Tokyo, Japan) for 2 h at with shading. Nuclei were stained with HardSet Antifade Mounting Medium with DAPI (H-1500, Vector Laboratories) for 15 min. Slides were imaged with a KEYENCE BZ-X710 fluorescence microscope (Keyence Corp.).
2.10 Immunohistochemistry
Immunohistochemical staining was performed as described previously.22 Briefly, tumors removed from the xenografted mice were fixed with 4% paraformaldehyde, embedded in paraffin, sliced to a thickness of 4 µm, and placed on glass slides. After deparaffinization and rehydration, tissue antigens were retrieved with citrate buffer (pH 6), and endogenous peroxidase activity was inhibited by incubating the tissue sections with 3% H2O2 for 10 min. The sections were then blocked with Blocking One Histo (Nacalai Tesque) and incubated with mouse anti-Ki67 antibody (M7240, DAKO, Glostrup, Denmark) (1:100) for 20 min at room temperature. Incubation with the secondary antibody (HRP-conjugated goat anti-mouse IgG antibody; ab214879, pre-diluted, Abcam, Cambridge, UK) was performed for 30 min. Hematoxylin (8656, Sakura Finetek, Tokyo, Japan) was used for counterstaining the nucleus. The signals were detected by DAB (K3468, DAKO).
2.11 Metabolomics analysis
We performed metabolomic analysis using C-Scope (Human Metabolome Technologies), according to the recommended protocol.23 Rh30 cells administered with DMSO or MCDi for 24 h were used as samples. In brief, after washing twice with 5% mannitol solution, 800 µl methanol, and 550 µl of 8 µM internal standard were added to the cells. Next, the cells were centrifuged at 4℃, 2300 × g for 5 min. The supernatants were then collected by centrifugation through a 5 kDa-cutoff filter at 4℃, 8100 × g for 3 h. The concentrations of all charged compounds were measured by capillary electrophoresis time-of-flight mass spectrometry (CE-TOFMS) and capillary electrophoresis tandem mass spectrometry (CE-QqQMS; CE-MS/MS) according to a previously described method.24
2.12 Statistical analysis
All data are presented as the mean ±standard deviation (SD). To compare the means between groups, we used a two-tailed t-test in Figures 1, 2, 3 and 5 (n = 3 or 4). Mann–Whitney's U-test was performed for the analysis in Figure 6 (n = 5 in each group). Differences with a p-value <0.05 were considered statistically significant.
3 RESULTS
3.1 Inhibition of lipid metabolism by MCDi suppressed cell proliferation and induced cell cycle arrest in RMS cells
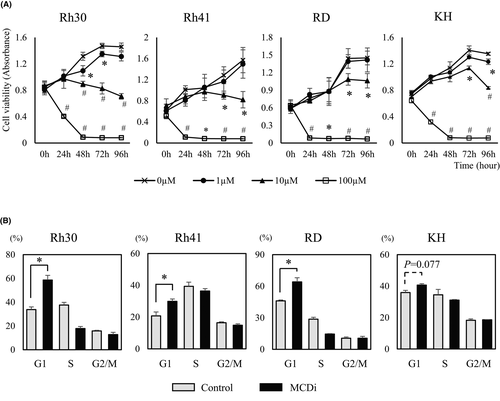
We first investigated the effect on tumor growth suppressing lipid metabolism with the MCDi.20, 21 Administration of MDCi to the ARMS cell lines Rh30 and Rh41, and the ERMS cell lines RD and KH, resulted in concentration- and time-dependent inhibition of growth (Figure 1A). Notably, the mRNA expression level of carnitine palmitoyltransferase (CPT) 1 isozymes, the target of malonyl-CoA, was different in each cell line (Figure S2). It has been reported that PAX3-FKHR (PAX3-FOXO1), a fusion gene characteristic of ARMS, is involved in the transcription of CPT1A and regulates tumor cell infiltration and metastasis.25 MCDi administration increases the level of malonyl-CoA, which inhibits CPT1 and reduces fatty acid uptake in mitochondria.26 In this study, the inhibitory effect of MCDi on tumor growth was similar for both ARMS and ERMS. Furthermore, the effect of inhibiting lipid metabolism on the cell cycle was examined. Administration of 10 µM MCDi-induced G1 cell cycle arrest in Rh30, Rh41, and RD with statistically significant differences. In case of KH, there was no significant difference, although the G1 phase cell population tended to increase (p = 0.077) (Figure 1B).
3.2 Metabolomic analysis revealed that inhibition of lipid metabolism affects tumor-specific energy metabolism in RMS cells
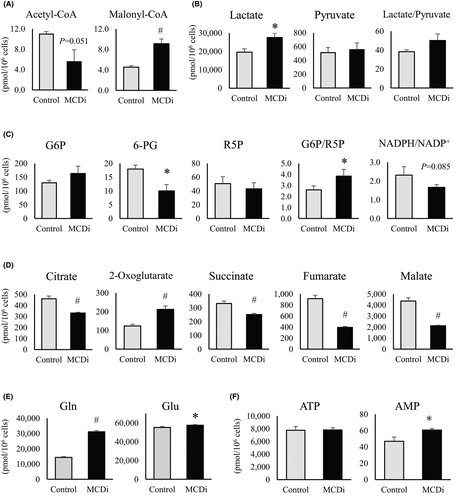
We performed a metabolomic analysis of Rh30 cells treated for 24 h with DMSO or 10 µM MCDi. Reflecting the action of MCDi, a significant increase in malonyl-CoA levels and decrease in acetyl-CoA levels were observed (Figure 2A). The promotion of lactic acid synthesis was confirmed (Figure 2B). Moreover, a markedly decreased level of 6-phosphogluconate (6-PG) along with a declining NADPH/NADP+ ratio (p = 0.085) and a significantly increased 6-PG/ribose 5-phosphate (R5P) ratio indicated inactivation of the PPP (Figure 2C). The levels of TCA cycle intermediate metabolites, except for 2-oxoglutaric acid (2-OG), were significantly reduced by the suppression of lipid metabolism (Figure 2D). Both glutamine (Gln) and glutamate (Glu) levels were significantly increased by the administration of MCDi (Figure 2E), suggesting that the increase in 2-OG was a result of the replacement pathway for glutamine degradation. There was no difference in the amount of ATP, although AMP levels were significantly increased in MCDi-treated cells (Figure 2F).
Next, we compared the mRNA expression levels of key enzymes located at the junction of glycolysis to determine whether the changes in these metabolites due to MCDi administration occurred similarly in other RMS cell lines. Lactate dehydrogenase A (LDH-A), an enzyme that converts pyruvate to lactate, did not show a significant change (Figure 3A); however, the expression of pyruvate dehydrogenase (PDH) kinase (PDHK4), which inhibits PDH conversion of pyruvate to acetyl-CoA, was significantly increased in all cell lines due to the inhibition of lipid metabolism (Figure 3B). In addition, the mRNA expression of glucose 6-phosphate dehydrogenase (G6PD), the first rate-limiting enzyme in the PPP which converts glucose 6-phosphate (G6P) to 6-phosphogluconic acid (6PG), was significantly reduced (Figure 3C). These results indirectly demonstrate that the suppression of lipid metabolism by MCDi administration caused similar metabolic changes in all four RMS cell lines.

3.3 Inhibition of lipid metabolism promotes autophagy signaling via the AMPK-mTOR pathway and increases p21 expression
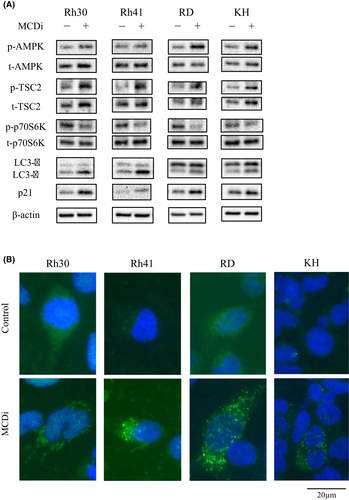
Western blot analyses were performed to assess the protein expression level of AMPK, which is an important intracellular energy sensor. After the administration of DMSO or 10 µM MCDi for 24 h, the phosphorylation of AMPK was increased (Figure 4A), as were AMP levels (Figure 2F), which activate AMPK. Moreover, inhibition of lipid metabolism increased the phosphorylation level of TSC2 located downstream of AMPK. Further, the phosphorylation of p70S6K, located downstream of mTORC1, was reduced. Expression of p21, a cell cycle suppressor, was also increased. Moreover, LC3A/B-II protein levels were increased after MCDi administration (Figure 4A). Usually, when autophagy is promoted, LC3-I is converted into its phosphatidylethanolamine-conjugated form, LC3-II, which is a key factor in the maturation of autophagosome. Immunofluorescence staining revealed that inhibition of lipid metabolism increased LC3 puncta in the cytoplasm of RMS cells, indicating the formation of autophagosomes (Figure 4B).
3.4 Inhibiting both lipid metabolism and autophagy suppresses tumor cell proliferation with increased apoptotic cell death
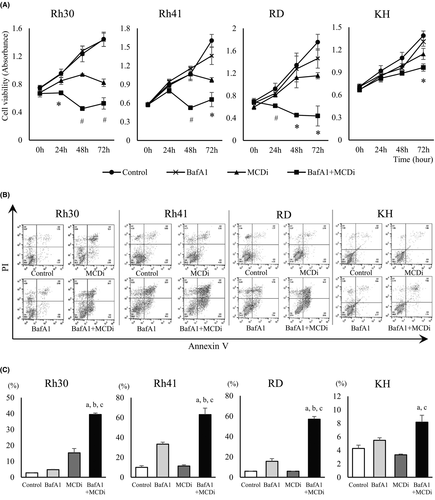
Then we investigated whether the autophagy induced by the inhibition of lipid metabolism was a tumor-protective response or the cytotoxic event known as autophagic cell death. BafA1 inhibits the late phase autophagy by preventing the maturation of autophagic vacuoles through the inhibition of fusion between autophagosomes and lysosomes. When MCDi and BafA1 were used together, cell proliferation was suppressed to a greater degree in combination group than individually (Figure 5A). Analysis revealed that the annexin V-positive cell population increased following concomitant administration, suggesting further induction of apoptotic cell death (Figure 5B and C).
3.5 A fat-restricted diet suppresses RMS growth in an orthotopic xenograft mouse model through decreasing lipid metabolism
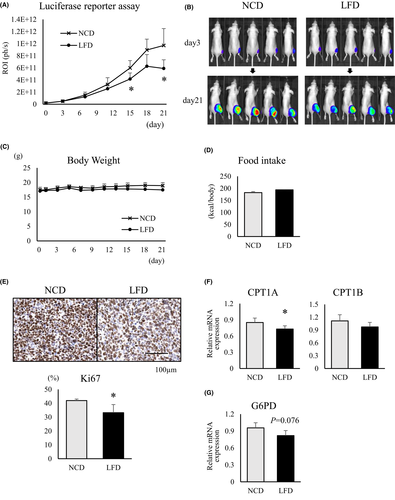
After confirming the engraftment of transplanted luciferase-positive Rh30 cells in a xenograft mouse model, the bioluminescence of the tumor cells was evaluated over a 3- week period after initiation of NCD or LFD feeding. LFD-fed mice had lower tumor-related bioluminescence intensities than NCD-fed mice (Figure 6A). At 21 days after diet change, the tumor sizes of LFD-fed mice were smaller than those of NCD-fed mice (Figure 6B). During the observation period, there was no significant difference in body weight and calorie intake between the NCD- and LFD-fed mice (Figure 6C and D). Mice were euthanized to excise the tumor mass and perform IHC staining for Ki67. The Ki67-positive rate was significantly lower in tumor samples from LFD-fed mice than from NCD-fed mice (Figure 6E). Moreover, comparison of the mRNA expression levels of CPT1 isozymes, which are rate-limiting enzymes for lipid metabolism in mitochondria, showed that in LFD-fed mice, expression of CPT1A mRNA was significantly lower than in tumors from NCD-fed mice, and CPT1B expression tended to decrease as well (Figure 6F). In addition, G6PD mRNA expression was relatively reduced in LFD-fed mice compared to NCD-fed mice (p = 0.076) (Figure 6G).
4 DISCUSSION
Therapeutic approaches that specifically target tumors and have few systemic side effects are important for cancer treatment. In recent years, many researchers have focused on therapeutic strategies targeting tumor-specific energy metabolism. However, there are few studies on the metabolism of childhood cancers, especially RMS. The present study yields novel findings concerning a therapeutic strategy for RMS, focusing on lipid metabolism.
The Warburg effect has been previously reported to occur in RMS.10, 12 The use of stable isotopes to analyze intracellular metabolism revealed that glucose uptake was significantly increased and lactate synthesis was enhanced in the Rh30 cell line compared to normal myocytes, demonstrating upregulated glycolysis in RMS.10 Moreover, the mitochondrial TCA cycle was upregulated in Rh30, indicating that energy sources other than glucose, such as glutamic acid and fatty acids, were also essential for the TCA cycle. Thus, we hypothesized that suppressing lipid metabolism in RMS would upset the balance of tumor-specific energy metabolism, or the Warburg effect, leading to an antitumor effect.
Metabolomic analysis revealed that most intermediates in the mitochondrial TCA cycle were significantly reduced by the administration of MCDi, as would be expected if fatty acid oxidation was inhibited. 2-OG was the only TCA cycle intermediate metabolite that showed increased levels, likely owing to the anaplerotic pathway, which takes up glutamate from the cytoplasm into the mitochondria.27 Metabolomic analysis further revealed that the PPP was downregulated and nucleic acid synthesis was suppressed in MCDi-treated RMS. AMPK is a key nutrient sensor that controls various intracellular signals by reflecting the nutritional status in both normal and tumor cells.28 Recently, AMPK has been reported to suppress the expression of G6PD, the rate-limiting enzyme in the first stage of PPP, by inactivating the transcriptional activities of cyclic AMP-response element-binding protein (CREB) and CREB-regulated transcriptional coactivator-1 (CRTC-1).29, 30 In our study, the inhibition of lipid metabolism in RMS cell lines increased AMPK phosphorylation, reflecting the intracellular low-energy state, and suppressed the expression of G6PD mRNA. This suggests that the inhibition of lipid metabolism suppressed the PPP in RMS cells via the AMPK-CRCT1-CREB-G6PD pathway. Inhibition of lipid metabolism-induced cell cycle arrest in the G1 phase and increased the expression of p21 in all RMS cell lines. p21 is a major target of p53 activity and is thus associated with cell cycle arrest. In RMS cells, especially Rh30, Rh41, and RD cell lines, the tumor suppressor protein p53 is either mutated or deleted, and therefore its function is suppressed.31-33 Inhibition of lipid metabolism suppressed the PPP in RMS cells, which might induce G1 arrest by promoting p21 expression via a p53-independent pathway.34, 35 Overall, we propose that the imbalanced tumor-specific energy metabolism due to the suppression of lipid metabolism leads to an antitumor effect in RMS cells.
Autophagy facilitates the production of energy substrates required for cells to maintain their survival during starvation and breaks down the waste products accumulated inside cells, such as abnormal proteins and organelles with reduced function.36, 37 While various signals control autophagy, AMPK is a major factor that induces autophagy, especially under nutrient deprivation.38 mTORC1 is a major suppressor of autophagy signaling.39 As mentioned above, AMPK inhibits mTORC1 through the activation of TSC2, and also directly activates the unc-51-like autophagy activating kinase (Ulk1), followed by the induction of autophagy signals.40, 41 Autophagy is present not only in normal cells but also in cancer cells.37, 42 In this study, the suppression of lipid metabolism increased AMPK phosphorylation in RMS cell lines, resulting in activation of the autophagy pathway. Additionally, western blotting and immunofluorescence staining confirmed increased expression of LC3-II, which is a component of the autophagosome membrane and is therefore considered an autophagy marker.
Previous studies have shown that the role of autophagy in tumors, whether beneficial or harmful, is complex and depends on the type of cancer. The advantage of autophagy in cancer cells is its protective role against various environmental stressors, and blocking this compensatory response increases cancer cell death.43, 44 However, activation of autophagy itself induces autophagic cell death in cancer cells.45 This type of programmed cell death is defined by reduced cancer cell death due to inhibition of autophagy. It has been reported that several therapeutic approaches induced autophagy in RMS. In addition, when the increased autophagy was suppressed, apoptotic cell death was induced.46, 47 Consistent with these previous studies, we found that suppression of lipid metabolism in RMS-induced autophagy. Moreover, inhibition of autophagy led to promotion of apoptosis. Therefore, autophagy plays a tumor-protective role in RMS, and combination therapy by suppressing both lipid metabolism and autophagy may be promising as a therapeutic strategy.
Based on the results of in vitro experiments, we examined the lipid dependence of RMS in orthotopic xenograft models by restricting dietary exogenous fats. Comparison between NCD- and LFD-fed mice showed no significant difference in body weight and total calorie intake during the observation period. However, bioluminescence imaging showed significantly suppressed tumor growth in LFD-fed mice compared to NCD-fed mice. Since calorie restriction was not involved, the difference in exogenous lipid uptake between the two groups was considered the cause of this difference. Moreover, CPT1A mRNA expression was significantly decreased in the tumors of LFD-fed mice, suggesting that not only the uptake of exogenous lipids, but also the import of fatty acids, into mitochondria were reduced. A significant decrease in the expression of Ki67, a cell cycle-related protein, was observed in LFD-fed mice, indicating that the reduced lipid metabolism led to suppression of the cell cycle. PPP might also have been affected, as the expression of G6PD mRNA tended to decrease. Thus, our in vivo experiments showed that the reduced exogenous lipid supply due to LFD-affected lipid metabolism in RMS and exerted a tumor growth inhibitory effect.
Recently, there have been reports that a high-fat diet (HFD) promotes the growth of several types of tumors. In colorectal cancer, an increased level of HFD-derived palmitic acid induced the activation of hormone-sensitive lipase through the upregulation of cAMP/PKA signaling, which was promoted by increasing β2 adrenergic receptor expression, enhancing the supply of fatty acids as an energy substrate in tumor cells; this affected the metabolic phenotype and made the tumor more malignant.48 HFD also increased the population of myeloid-derived suppressor cells, which have been reported to be facilitators of tumor growth, resulting in the stimulation of inflammation in the tumor microenvironment and affecting the malignancy of the tumor.49, 50 In other words, the availability of a large amount of fatty acids contributes to tumor growth in various ways. Like normal cells, cancer cells have lipid droplets in their cytoplasm, which enable them to adjust to adverse conditions such as starvation and oxidative stress.51 Furthermore, many lipid metabolism-related enzymes are associated with undesirable characteristics of cancer cells, such as invasion and metastasis.52 High lipid availability is advantageous for tumor cells, whereas low lipid content may be disadvantageous for cancer growth; however, there have been few reports indicating that the suppression of lipid utilization exerts an antitumor effect.
This study included certain limitations. In the in vitro experiments, we only compared the effects of using a drug that suppresses intracellular lipid metabolism, and did not compare the effects on inhibiting the utilization of the exogeneous lipids, such as by reducing the fat content in the medium. The in vivo experiments in this study were conducted in mice, and the effects of lipid metabolism inhibition on humans need to be assessed. Further studies are warranted to identify the master key regulator that plays a central role in mediating the changes in the metabolic balance, in response to the suppression of lipid metabolism.
In conclusion, the present study revealed that inhibition of lipid metabolism suppressed the PPP in RMS. As a result, the synthesis of nucleic acids essential for the growth of cancer cells and antioxidants required for maintaining oxidative balance decreased, leading to inhibition of tumor growth inhibitory due to cell cycle arrest. It has been suggested that AMPK might play a key role in this effect. Autophagy signaling induced by the AMPK-mTOR pathway has been thought to be a tumor-protective response in RMS. This is because apoptotic cell death was induced via inhibition of autophagy, which was promoted by suppressing lipid metabolism. Including the experimental results in mouse xenograft models, we report for the first time that RMS relies on lipid metabolism to maintain its growth. Therefore, we believe that reducing lipid intake is a promising therapeutic strategy of RMS.
ACKNOWLEDGMENTS
The authors thank Peter J. Houghton, M.D. of the Greehey Children’s Cancer Research Institute, University of Texas Health Science Center, San Antonio, TX, USA, for providing the cell lines Rh30 and Rh41. The authors are grateful to Yasuhiro Kawabe and Youhei Sugimoto for teaching experimental techniques. This work was supported by the grant received from Children’s Cancer Association of Japan. The authors would like to thank Editage (www.editage.com) for English language editing.
CONFLICT OF INTERESTS
The authors have no conflict of interests.
ETHICAL APPROVAL STATEMENT
Our animal experiments were approved by the Committee for Animal Research of Kyoto Prefectural University of Medicine (Authorization No. M2019-516), and performed in accordance with the Animal Research Reporting In Vivo experiments (ARRIVE) guidelines.
Open Research
Data Availability Statement
The data that support the findings of this study are available from the corresponding author, KK, upon reasonable request.


