Clustering of prostate cancer healthcare pathways in the French National Healthcare database
Abstract
Background
Healthcare pathways of patients with prostate cancer are heterogeneous and complex to apprehend using traditional descriptive statistics. Clustering and visualization methods can enhance their characterization.
Methods
Patients with prostate cancer in 2014 were identified in the French National Healthcare database (Système National des Données de Santé—SNDS) and their data were extracted with up to 5 years of history and 4 years of follow-up. Fifty-one-specific encounters constitutive of prostate cancer management were synthesized into four macro-variables using a clustering approach. Their values over patient follow-ups constituted healthcare pathways. Optimal matching was applied to calculate distances between pathways. Partitioning around medoids was then used to define consistent groups across four exclusive cohorts of incident prostate cancer patients: Hormone-sensitive (HSPC), metastatic hormone-sensitive (mHSPC), castration-resistant (CRPC), and metastatic castration-resistant (mCRPC). Index plots were used to represent pathways clusters.
Results
The repartition of macro-variables values—surveillance, local treatment, androgenic deprivation, and advanced treatment—appeared to be consistent with prostate cancer status. Two to five clusters of healthcare pathways were observed in each of the different cohorts, corresponding for most of them to relevant clinical patterns, although some heterogeneity remained. For instance, clustering allowed to distinguish patients undergoing active surveillance, or treated according to cancer progression risk in HSPC, and patients receiving treatment for potentially curative or palliative purposes in mHSPC and mCRPC.
Conclusion
Visualization methods combined with a clustering approach enabled the identification of clinically relevant patterns of prostate cancer management. Characterization of these care pathways is an essential element for the comprehension and the robust assessment of healthcare technology effectiveness.
Abbreviations
-
- AHC
-
- agglomerative hierarchical clustering
-
- CEREES
-
- Comité d'Expertise pour les Recherches, les Études et les Évaluations dans le domaine de la Santé
-
- CNIL
-
- Commission nationale de l'informatique et des libertés
-
- CRPC
-
- castration-resistant prostate cancer
-
- ENCePP
-
- European Network of Centres for Pharmacoepidemiology and Pharmacovigilance
-
- HSPC
-
- nonmetastatic hormone-sensitive prostate cancer
-
- ICD10
-
- International Classification of Diseases, 10th revision
-
- LTD
-
- long-term disease
-
- mCRPC
-
- metastatic castration-resistant prostate cancer
-
- mHSPC
-
- metastatic hormone-sensitive prostate cancer
-
- PAM
-
- partitioning around medoids
-
- PSA
-
- prostate-specific antigen
-
- SNDS
-
- Système National des Données de Santé
-
- SSA
-
- state sequence analysis
-
- TRATE
-
- transition rate
1 INTRODUCTION
Prostate cancer is the most common cancer in men [1]. Patients progress gradually from nonmetastatic hormone-sensitive prostate cancer (HSPC) to metastatic castration-resistant prostate cancer (mCRPC), potentially going through intermediate stages such as metastatic HSCP (mHSPC) or castration-resistant prostate cancer (CRPC). These different stages come with adapted management strategies, evolving according to the patient's conditions and the state of the art [2-5]. Though guidelines are mainly built on randomized clinical trial results, real-world studies also contribute to generating evidence. Observational studies are particularly useful for understanding how treatments are used in daily practice and what their impact is on patient health in uncontrolled conditions [6]. The CAMERRA—TherapeutiC strAtegy in MEtastatic castration-Resistant pRostate cAncer: target population and changes between 2012 and 2014—study was set up to assess the evolution of mCRPC management in France between 2012 and 2014 [7-11]. As a secondary result, CAMERRA shed light on the heterogeneity of patients' journeys for the same stage of prostate cancer, and the complexity of their characterization and evaluation. Patient healthcare pathways consist of many components—drug exposure, laboratory tests, medical procedures, hospitalizations, visits, and so on—whose combinations are complex to apprehend using traditional descriptive statistics. This problematic also exists in numerous other research areas such as social sciences, when it comes to visualizing the life trajectories of a population (e.g., arrival on the job market, [12] family live pathway [13]). In recent years, the rise of unsupervised machine learning—such as clustering methods—has allowed researchers to reveal patterns or subgroups within heterogeneous data so that each generated cluster has greater homogeneity than the whole [14]. Clustering methods differ in the way they measure similarities and build groups. Centroid-based algorithms (e.g., partitioning around medoids—PAM) characterize a cluster by the most central subject belonging to the cluster, its medoid [15, 16]. Agglomerative hierarchical clustering (AHC), starts with singleton clusters (i.e., cluster of one subject) at the bottom level to end with a single cluster encompassing the whole population, minimizing a chosen criterion, whereas divisive hierarchical clustering works oppositely [15, 17]. Other approaches exist (e.g., density-based [18] and model-based algorithms [19]) but are less used because of their complexity [20]. Whatever the one used, the combination of these unsupervised clustering approaches to visualization methods like state sequence analysis (SSA) offers the possibility to efficiently identify and characterize homogenous healthcare pathways of patients with chronic diseases in real-life settings [21-24]. The objective of this article is to illustrate how clustering and visualization methods can enhance the characterization of healthcare pathways of patients with prostate cancer.
2 MATERIALS AND METHODS
2.1 Study design
Patients with prostate cancer in 2014 were identified in the Système National des Données de Santé (SNDS), that is, the French National Healthcare database and their healthcare data were extracted with up to 5 years of history and 4 years of follow-up. Four exclusive cohorts of incident patients were constituted, prioritizing the most advanced disease stage: (1) HSPC, (2) mHSPC, (3) CRPC, (4) mCRPC [7]. To synthesize the large amount of information defining a healthcare pathway, “macro-variables” were built, based on specific prostate cancer healthcare encounters over the whole study period. The combination of the values of these macro-variables on seven time periods of 6 months (i.e., seven semesters) constitutes patients' healthcare pathways. Clustering methods were then applied to define consistent groups of similar pathways among each stage-based prostate cancer cohort.
2.2 Data source
The SNDS covers more than 99% of the French population—nearly 67 million inhabitants—from birth (or immigration) to death (or emigration), even if a subject moves, changes occupation, or retires [25]. Using a unique pseudonymized identifier, it merges reimbursed outpatient claims from all French healthcare insurance schemes with hospital-discharge summaries from public and private hospitals, and the national death registry. The SNDS captures general characteristics (e.g., gender, year of birth, area of residence); registration for long-term disease (LTD) with the associated International Classification of Diseases, 10th revision (ICD10) code, qualifying for full insurance coverage; outpatient encounter details (e.g., medical and paramedical visits, procedures and laboratory tests performed, drugs dispensed, medical devices); inpatient details (e.g., hospital discharge ICD10 primary and secondary diagnosis codes, procedures and laboratory tests performed, innovative or expensive drugs and medical devices invoiced in addition to the hospitalization, length of the hospital stay). For each expenditure, dates, associated costs, and prescriber and caregiver information are provided. The SNDS content is fully described in the scientific literature [25-27]. Though, neither medical indications nor laboratory tests or imaging results are recorded, the level of details of the captured information enables accurate characterization of patient healthcare journeys [28].
2.3 Study population
Prevalent prostate cancer cases in 2014 were identified among men alive, aged at least, 40 years, and covered by the general health insurance scheme in 2014 (nearly 88% of the French population) based on LTD, specific prostate cancer drugs dispensing or procedures, and hospital stays for prostate cancer over the 5-year history period. A validated algorithm was then applied to detect castration resistance and metastasis management, and so mCRPC status. The detailed description of the inclusion criteria as well as the case-identifying algorithm are published elsewhere [7].
2.4 Macro-variables construction
Fifty-one healthcare encounters (see Supporting Information: Appendix 1) deemed specific to prostate cancer management by clinicians were preselected and transformed into binary variables using clinically relevant thresholds. Correlation between these variables was assessed over the whole study period to summarize the overall information into a reduced number of macro-variables. The ClustofVar R package was used to group variables based on their correlation to fictive central variables with the k-means algorithm, each group of variables being called a “macro-variable” [29]. Macro-variables content was then reviewed by a clinical expert and the relevance of variables poorly correlated was discussed. It was decided to either remove (n = 12) or switch variables between clusters (n = 10) to improve the clinical pertinence (see Supporting Information: Appendix 1). This approach led to the creation of four macro-variables matching the following prostate cancer clinical concepts (Table 1): (1) surveillance, (2) local treatment, (3) androgenic deprivation, and (4) advanced treatment.
| Surveillance |
| Prostate-specific antigen test |
| Prostate biopsy |
| Prostate magnetic resonance imaging |
| Local treatment |
| Brachytherapy |
| Intensity modulated radiotherapy |
| Non-intensity modulated radiotherapy |
| Radical prostatectomy |
| Pelvic or iliac lymphadenectomy |
| Prostatic adenectomy |
| Cryotherapy |
| High Intensity Focalized Ultrasounds |
| Transurethral resection of the prostate |
| Androgenic deprivation |
| Bicalutamide |
| Leuprorelin |
| Triptorelin |
| Cyproterone |
| Goserelin |
| Degarelix |
| Orchiectomy |
| Testicular pulpectomy |
| Advanced treatment |
| Abiraterone acetate |
| Docetaxel |
| Cabazitaxel |
| Enzalutamide |
| Hospitalization for metastasis management |
| Clodronic acid |
| Zoledronic acid |
| Hospitalization with palliative cares |
| Radiofrequency ablation of liver metastases |
| Denosumab |
| Estramustine |
| Buserelin |
| Flutamide |
| Nilutamide |
| Strontium 89 |
| Samarium 153 |
| Radium 223 |
| Kyphoplasty |
| Laminectomy |
2.5 Pathways construction
A patient's pathway was defined by the combination of macro-variables status over each of the seven semesters. For a given semester, the status of a macro-variable was declared if at least one of its encompassed binary variables had the value “1.” As most of the surveillance actions related to prostate cancer are conducted yearly, the Surveillance macro-variable was assessed based on a 1-year interval, combining semesters as follows: Semesters 1 + 2, Semesters 3 + 4, Semesters 5 + 6, and the seventh semester was assessed alone. For instance, a patient with “Surveillance” state on Semester 1 but not on Semester 2 and another patient with “Surveillance” state on Semester 2 but not on Semester 1 were finally considered under “Surveillance” during the whole year. Thus, for each semester, 16 possible combinations existed, named states (Supporting Information: Appendix 2). SSA methods were used to generate a visual representation of these states composing healthcare pathways.
2.6 Clustering of healthcare pathways
To identify patterns of healthcare pathways, clustering methods were run across the four cohorts: HSPC, mHSPC, CRPC, mCRPC [7]. Patients were left-aligned from the start of the selected incident status, and the duration of follow-up was truncated to a total of seven semesters. First, the optimal matching method from TraMineR R package was used to calculate distances between sequences of states of patients [30]. A distance is defined by the sum of the specific costs associated with the operation required to convert a sequence into another one. Three operations are possible: substitution, insertion, or deletion of state. The costs associated with each of these operations were derived from the observed transition rates (displayed as the transition rate [TRATE] method in TraMineR package) [30]. By this method, the cost of insertion and deletion was set to 1, while the cost of substitution was set according to the probability of transition between the states based on the assumption that the more transitions there are, the more similar these states are (Supporting Information: Appendix 3). The cost will decrease as the transition between states i and j will be frequent. Second, the PAM algorithm implemented in the R package WeightedCluster was applied to create homogeneous groups based on previously calculated distances. The number of clusters by cohort was chosen based on a compromise between clinical meaning and the silhouette metric. The silhouette metric supports the assessment of clustering quality by measuring how similar a sequence is to its own cluster (cohesion) compared with other clusters (separation). The value of the silhouette ranges from −1 to 1. The closer the value is to 1, the more well-matched the sequence is to its own cluster and the more poorly matched to neighboring clusters (see Supporting Information: Appendix 4) [15, 31].
3 RESULTS
3.1 Distribution of healthcare pathways states among incident cohorts
- a.
HSPC incident cohort (n = 24,927),
- b.
mHSPC incident cohort (n = 4918),
- c.
CRPC incident cohort (n = 1257),
- d.
mCRPC incident cohort (n = 4384).
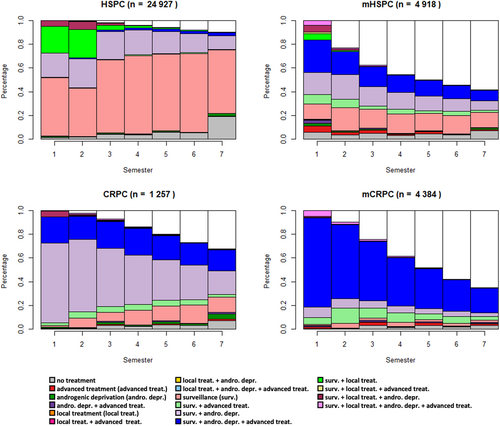
For each incident cohort, Figure 1 shows the distribution of healthcare pathways states by semester.
3.1.1 HSPC incident cohort
The HSPC incident population was characterized by nearly 50% of patients under surveillance at the beginning of the follow-up, progressively increasing up to 70%. From the 15 other potential states, only three were well represented (“surveillance & androgenic deprivation,” “surveillance & local treatment,” and “surveillance & local treatment & androgenic deprivation”), covering a total of 50% over the two first semesters. From the third semester, the “Local treatment” states disappeared.
3.1.2 mHSPC incident cohort
For the mHSPC cohort, the distribution of states was characterized by a high heterogeneity, especially over the first semester where more than 10 states were represented. From the third semester onward, 40% of the cohort population was censored. This proportion reached up to 60% over the last semester. Each other main state (“surveillance,” “surveillance & androgenic deprivation & advanced treatment,” and “surveillance & androgenic deprivation”) decreased from 20% to 10% between the beginning and the end of the follow-up.
3.1.3 CRPC incident cohort
Among the incident CRPC cases, approximately 70% were in the “Surveillance & androgenic deprivation” state during the first semesters, this rate decreased to 20% during the last semesters. The “surveillance & androgenic deprivation & advanced treatment” state remained stable, around 20%, all over the time period. The proportion of censored patients gradually increased to 30% in the seventh semester of follow-up.
3.1.4 mCRPC incident cohort
The incident mCRPC states distribution was firstly dominated by the “surveillance & androgenic deprivation & advanced treatment” (80%), then declining to 20% by the last semester. On the opposite, the censored population grew from 10% up to 60% between the second and seventh semesters.
3.2 Clustering of the healthcare pathways
3.2.1 HSPC incident cohort
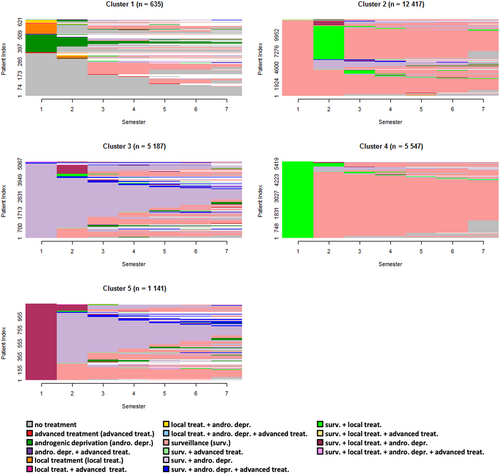
Healthcare pathways for HSPC incident cases were divided into five groups (Figure 2), with a silhouette metric of 0.09. Cluster 1 was the smallest (n = 635). It grouped many patients with no treatment or with androgenic deprivation with or without local treatment over the first semesters and no subsequent treatment over the follow‑up. Clusters 2 and 4 represented nearly 72% of the whole cohort and was mainly made of patients who received a local treatment followed by surveillance (Cluster 4, n = 5547), or who received a local treatment after a period of surveillance (Cluster 2, n = 12,417). Cluster 5 (n = 1141) was principally made of patients with “surveillance & local treatment & androgenic deprivation treatment” over the first semester, followed by heterogeneous pathways mainly composed of “surveillance & androgenic deprivation treatment.” Finally, Cluster 3 (n = 5187) was similar to Cluster 5 but without local treatment over the first semester.
3.2.2 mHSPC incident cohort
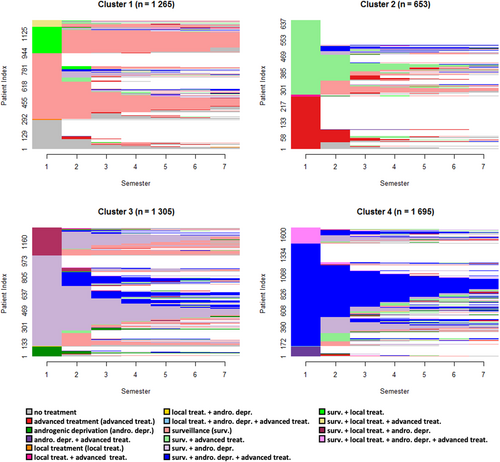
The clustering method identified four subgroups among the incident mHSPC cases (Figure 3), for a silhouette metric of 0.24. Cluster 1 (n = 1265) consisted of patients under surveillance who received, for some of them, a local treatment at the beginning of follow-up. Cluster 2 encompassed 653 patients with advanced treatment (± surveillance), subsequently censored after one or two semesters. Cluster 3 (n = 1305) was the most heterogeneous and included patients undergoing surveillance and androgenic deprivation, some with local treatment in the first semesters. Finally, Cluster 4 (n = 1695) showed cases with surveillance, androgenic deprivation, and advanced treatment.
3.2.3 CRPC incident cohort
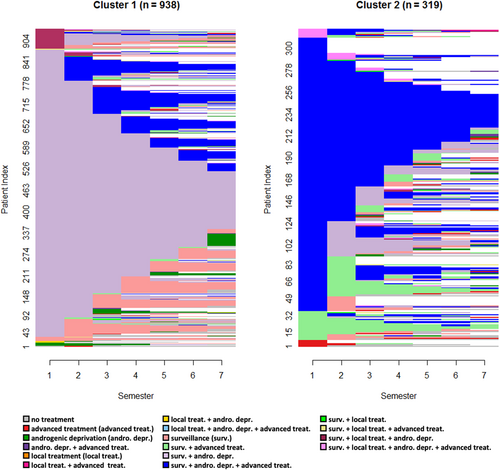
Patients with incident CRPC were divided into two clusters for a silhouette metric of 0.33 (Figure 4), where heterogeneity was still present. The majority of the population undergoing surveillance and androgenic deprivation was represented in Cluster 1 (n = 938), where several transitions to surveillance only, or to advanced treatment were also observed. Cluster 2 (n = 319) gathered patients with “surveillance & androgenic deprivation & advanced treatment” over the first semester, and for whose advanced treatment was mainly maintained during follow-up.
3.2.4 mCRPC incident cohort
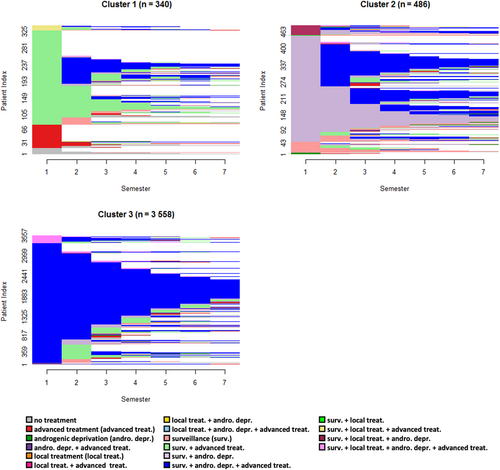
The 4384 patients forming the mCRPC incident cohort were allocated between three clusters (silhouette = 0.38) with sizes ranging from 340 to 3558 (Figure 5). Cluster 3 was the largest, consisting mainly of patients receiving advanced treatment with androgenic deprivation. Patients in Cluster 2 mostly had “surveillance & androgenic deprivation” as a first-semester state, and gradually progressed to states with advanced treatment. In contrast to Cluster 3, patients in Cluster 1 received advanced treatment in their first semester but without androgenic deprivation, and with a high level of censoring over the follow-up.
4 DISCUSSION
The greatest challenge of this work was to summarize the extensive SNDS data to a limited number of macro-variables over fixed time frames, so that can be analyzed using unsupervised machine learning. The combination of the modalities of these macro-variables over time gave rise to patient healthcare pathways, which clustering methods allowed to congregate into homogeneous groups, according to the stage of prostate cancer.
The whole study period was used to build macro-variables regardless of the prostate cancer stage. An alternative approach would be to derive macro-variables from each prostate cancer cohort, which might enable a more granular characterization of healthcare pathways by decoupling their matching to the specific disease stages. However, this potential improvement of the intracluster heterogeneity would be made at the expense of the intercluster comparability.
Over the follow-up semesters, the observed repartition of states including surveillance, local treatment, androgenic deprivation, and advanced treatment appears to be consistent with HSPC, CRPC, and mCRPC status defined in the frame of the CAMERRA study. The heterogeneity of states observed over the first semester of the mHSPC cohort can be explained by the lack of specificity of the macro-variable “advanced treatment” which encompasses multiple metastatic-related treatments (e.g., denosumab and zoledronic acid) but also mCRPC (e.g., docetaxel and abiraterone acetate) and CRPC specific ones (e.g., enzalutamide), but may also reflect a high disparity in terms of cancer management in real-life settings. This may also explain why the state “advanced treatment” is observed over the first semester of the CRPC cohort.
The anticipated complexity of prostate cancer patient management motivated the early combination of macro-variable status into states composing single healthcare pathways, to simplify the clustering process and its interpretation. The alternative—that is, the construction of a pathway for each macro-variable, followed by dedicated similarity computations, and their final sum [23]—could have required an important computing time without potential benefit in terms of clustering quality. The choice of the TRATE method combined with PAM to perform clustering of healthcare pathways was motivated by its capacity to take into account the likeness between medical states over time. The calculation of distances in TRATE partially relies on the probability of transition between states, which is not the case in other optimal matching approaches deriving the same cost for all substitutions [30]. For instance, the distance between the states “surveillance” and “surveillance & local treatment & androgenic deprivation & advanced treatment” was higher than the distance between “no treatment” and “surveillance” because the second transition was more usual.
Clustering is an empirical exercise. Even though some metrics exist to measure the quality of a cluster partition (e.g., silhouette), its validity and relevance depend above all on the clinical interpretation that can be made from it. In the present case, the clustering process enabled the drafting of relevant clinical patterns across the different cohorts, although in almost all cohorts a cluster gathered heterogeneous pathways that may echo cancer recurrence, or delayed or disrupted management in real life caused by intercurrent independent conditions or patient environment.
In the HSPC cohort, two clusters were allocated to patients with local treatment and active surveillance, which may reflect groups with low risk [32]. Patients with intermediate‑high risk were grouped in Cluster 5, where androgenic deprivation was observed. When present, almost no pharmacological treatments followed local treatment—presumably transurethral resection of the prostate—in Cluster 1, tending to indicate watchful waiting. Clusters 1 and 3 of the mHSPC cohort showed local treatment, probably for locoregional recurrence, followed respectively by surveillance or androgenic deprivation, echoing respectively low or intermediate-high progression risk. In Cluster 2, the high number of censored patients and the absence of androgenic deprivation suggest a palliative approach with advanced treatment to alleviate pain (e.g., laminectomy). Cluster 4 presented patients undergoing advanced treatments. In the CRPC cohort, the clustering process distinguished patients with advanced treatment (e.g., estramustine) from those with androgenic deprivation only. As for mCRPC, Cluster 1 comprised palliative care patients, while Clusters 2 and 3 hosted mainly patients undergoing advanced treatment, respectively with or without delay. Whatever the cohort considered, the number of clusters and the number of patterns that can be observed within clusters clearly show that patients' pathways are multiple and heterogeneous. This diversity is the direct consequence of treatment decisions combined with the hazards of real life. Although these pathways may consist of the same elements (e.g., drugs and procedures), their variations may have an impact on the effectiveness of cancer management. Describing them is the first step toward their optimization.
The “surveillance” macro-variable is the only one relying on a 1-year interval. This choice is based on French guidelines for posttreatment prostate cancer surveillance, which recommend prostate-specific antigen (PSA) testing on a semiannual or annual basis according to disease stage and seriousness [33]. Though, this facilitated healthcare pathway clustering by reducing surveillance sequences heterogeneity, in some situations it may hide the reality of care (e.g., the start of watchful watching) and may limit the interpretation of some sequences.
In a general way, the choice of the time unit to process healthcare pathways is a challenging question. Short time intervals enable distinguishing punctual care, which improves the accuracy of the representation of patients' journeys. However, this higher level of detail introduces more heterogeneity in the clustering process, and may lead to high computing time and potentially barely interpretable results. The choice of a 6‑month interval to define pathway states was motivated by the progressive character of prostate cancer and the long survival time of most patients [1]. However, a shorter time scale may be valuable when analyzing healthcare pathways of rapidly evolving patients with severe profiles, to allow a more detailed characterization.
5 CONCLUSION
This work illustrates that visualization methods such as SSA combined with a clustering approach enable the identification of clinically relevant patterns of prostate cancer management. These healthcare pathways are the direct result of medical decisions made with regard to the social characteristics and the health status of patients, together with the hazards of real life. Combined with the identification of baseline patient risk factors, which are potential confounders, the characterization of these care pathways is an essential element for the comprehension and the robust assessment of healthcare technology effectiveness, and so the improvement of patient health.
AUTHOR CONTRIBUTIONS
Roméo Baulain: Conceptualization (equal); data curation (equal); formal analysis (equal); methodology (equal); visualization (equal); writing – original draft (equal). Jérémy Jové: Conceptualization (equal); data curation (equal); formal analysis (equal); methodology (equal); validation (equal); visualization (equal); writing – review and editing (equal). Dunia Sakr: Conceptualization (equal); data curation (equal); formal analysis (equal); methodology (equal); validation (equal); visualization (equal); writing – review and editing (equal). Marine Gross-Goupil: Conceptualization (equal); investigation (equal); validation (equal); writing – review and editing (equal). Magali Rouyer: Conceptualization (equal); project administration (equal); writing – review and editing (equal). Marius Puel: Formal analysis (equal); visualization (equal); writing – review and editing (equal). Patrick Blin: Conceptualization (equal); investigation (equal); writing – review and editing (equal); writing – review and editing (equal). Cécile Droz-Perroteau: Funding acquisition (equal); project administration (equal); resources (equal); validation (equal); writing – review and editing (equal). Régis Lassalle: Conceptualization (equal); investigation (equal); methodology (equal); supervision (equal); validation (equal); writing – review and editing (equal). Nicolas H. Thurin: Conceptualization (equal); investigation (equal); methodology (equal); supervision (equal); validation (equal); writing – original draft (equal).
ACKNOWLEDGMENTS
The authors received no financial support for the research, authorship, and publication of this article. However, the example used was drawn from the TherapeutiC strategy in Metastatic castration-Resistant pRostate cAncer (CAMERRA) study, which was funded by Janssen-Cilag, France, and carried out by the Bordeaux PharmacoEpi platform under the supervision of a Scientific Committee.
CONFLICT OF INTEREST
Jérémy Jové, Régis Lassalle, Dunia Sakr, Magali Rouyer, Patrick Blin, Cécile Droz-Perroteau, and Nicolas H. Thurin are researchers at Bordeaux PharmacoEpi, a research platform of Bordeaux University and its subsidiary the ADERA, which performs financially supported studies for public and private partners in compliance with the ENCePP Code of Conduct. Marine Gross-Goupil declares personal fees and nonfinancial support from Janssen, Sanofi, Astellas, Ipsen, Amgen, and Pfizer. The remaining authors declare no conflict of interest.
ETHICS STATEMENT
This work relies on the CAMERRA study, which was approved by the national data protection agency (CNIL)—reference: 2029676—after the review of the protocol by a specific committee in health data research (CEREES).
INFORMED CONSENT
This work is based on data from the SNDS. Patients were informed of the creation of this database and the possible reuse of their data for research purposes on the websites of hospitals, health insurance organizations, mutual insurance companies, and so on, and through posters on the premises and/or via documents handed out.
Open Research
DATA AVAILABILITY STATEMENT
Access to SNDS data is regulated by French law and requires procurement of consent from the French data protection authority (CNIL). Any researcher from a European entity can submit an access request to the Health Data Hub (https://www.health-data-hub.fr).


