METTL5 stabilizes c-Myc by facilitating USP5 translation to reprogram glucose metabolism and promote hepatocellular carcinoma progression
Abstract
Background
Hepatocellular carcinoma (HCC) is one of the most prevalent cancers in the world, with a high likelihood of metastasis and a dismal prognosis. The reprogramming of glucose metabolism is critical in the development of HCC. The Warburg effect has recently been confirmed to occur in a variety of cancers, including HCC. However, little is known about the molecular biological mechanisms underlying the Warburg effect in HCC cells. In this study, we sought to better understand how methyltransferase 5, N6-adenosine (METTL5) controls the development of HCC and the Warburg effect.
Methods
In the current study, quantitative real-time polymerase chain reaction and Western blotting were used to detect the expression of METTL5 in HCC tissues and cell lines. Several different cell models and animal models were established to determine the role of METTL5 in glucose metabolism reprogramming and the underlying molecular mechanism of HCC. Glutathione-S-transferase pulldown, coimmunoprecipitation, RNA sequencing, non-targeted metabolomics, polysome profiling, and luciferase reporter assays were performed to investigate the molecular mechanisms of METTL5 in HCC cells.
Results
We discovered that METTL5 drove glucose metabolic reprogramming to promote the proliferation and metastasis of HCC. Mechanistically, upregulation of METTL5 promoted c-Myc stability and thus activated its downstream glycolytic genes lactate dehydrogenase A (LDHA), enolase 1 (ENO1), triosephosphate isomerase 1 (TPI1), solute carrier family 2 member 1 (SLC2A1), and pyruvate kinase M2 (PKM2). The c-Box and ubiquitin binding domain (UBA) regions of ubiquitin specific peptidase 5 (USP5) binded to c-Myc protein and inhibited K48-linked polyubiquitination of c-Myc. Further study revealed that METTL5 controled the USP5 translation process, which in turn regulated the ubiquitination of c-Myc. Furthermore, we identified cAMP responsive element binding protein 1 (CREB1)/P300 as a critical transcriptional regulator of METTL5 that promoted the transcription of METTL5 in HCC. In patient-derived tumor xenograft (PDX) models, adenovirus-mediated knockout of METTL5 had a good antitumor effect and prolonged the survival of PDX-bearing mice.
Conclusions
These findings point to a novel mechanism by which CREB1/P300-METTL5-USP5-c-Myc controls abnormal glucose metabolism and promotes tumor growth, suggesting that METTL5 is a potential therapeutic target and prognostic biomarker for HCC.
List of abbreviations
-
- HCC
-
- hepatocellular carcinoma
-
- m6A
-
- N6-methyladenosine
-
- mESC
-
- mouse embryonic stem cell
-
- DMEM
-
- Dulbecco's Modified Eagle Medium
-
- FBS
-
- foetal bovine serum
-
- MEM
-
- Minimum Essential Medium
-
- RT
-
- room temperature
-
- PBS
-
- phosphate-buffered saline
-
- DAPI
-
- 4′,6-diamidino-2-phenylindole
-
- qRT-PCR
-
- quantitative real-time polymerase chain reaction
-
- SDS-PAGE
-
- sodium dodecyl sulfate-polyAcrylamide gel electrophoresis
-
- sgRNA
-
- single guide RNA
-
- OD
-
- optical density
-
- IPTG
-
- isopropyl β-D-thiogalactoside
-
- METTL5
-
- methyltransferase 5, N6-adenosine
-
- LDHA
-
- lactate dehydrogenase A
-
- ENO1
-
- enolase 1
-
- TPI1
-
- triosephosphate isomerase 1
-
- PKM
-
- pyruvate kinase M1/2
-
- SLC2A1
-
- solute carrier family 2 member 1
-
- KEGG
-
- Kyoto Encyclopedia of Genes and Genomes
-
- i.v.
-
- intravenous
-
- i.p.
-
- intraperitoneal
-
- PDX
-
- Patient derived xenografts
-
- NCG
-
- Non Obese Diabetes/ShiLtJGpt-Prkdcem26Cd52Il2rgem26Cd22/Gpt
-
- RNA-seq
-
- RNA sequencing
-
- RIN
-
- RNA integrity number
-
- ECAR
-
- extracellular acidification rate
-
- OCR
-
- oxygen consumption rate
-
- LIHC
-
- Liver hepatocellular carcinoma
-
- WT
-
- wild type
-
- ChIP
-
- chromatin immunoprecipitation
-
- CHX
-
- cycloheximide
-
- TEM
-
- transmission electron microscopy
-
- TCGA
-
- The Cancer Genome Atlas
-
- GTEx
-
- Genotype-Tissue Expression
-
- GEO
-
- Gene Expression Omnibus
-
- KO
-
- knockout
-
- GSEA
-
- Gene set enrichment analysis
-
- PCA
-
- principal component analysis
-
- OXPHOS
-
- oxidative phosphorylation
-
- GC
-
- gas chromatography
-
- EdU
-
- 5-ethynyl-2'-deoxyuridine
-
- CCK-8
-
- cell counting kit-8
-
- mtDNA
-
- mitochondrial DNA
-
- RONS
-
- reactive oxygen–nitrogen species
-
- TEM
-
- transmission electron microscopy
-
- UCSC
-
- University of California, Santa Cruz
-
- co-IP
-
- co-inmunoprecipitation
-
- MS
-
- mass spectrometry
-
- USP5
-
- ubiquitin-specific peptidase 5
-
- LC
-
- liquid chromatography
-
- EMT
-
- epithelial-to-mesenchymal transition
1 BACKGROUND
Hepatocellular carcinoma (HCC) is a most commonly diagnosed cancer worldwide, ranking fifth in terms of incidence and third in terms of mortality [1, 2]. Despite significant advances in surgery, targeted therapy, and emerging immunotherapy strategies in recent years, the 5-year overall survival rate for patients with HCC remains less than 40% [3]. Novel tumor biomarkers are therefore urgently required to enhance HCC early diagnosis and molecular targeted therapy strategies to raise HCC patient survival rates.
Metabolic reprogramming affects the occurrence and developmentof cancers [4-6]. Glycolysis is the primary energy source for tumor cell proliferation even under aerobic conditions [7]. Warburg effect is a phenomenon predominantly observed in cancer cells wherein cells ferment glucose to lactic acid using glycolysis even in the presence of oxygen [8, 9]. The Warburg effect was identified for the first time in liver cancer and is responsible for regulating cell proliferation, immune vasion, invasion, metastasis, angiogenesis, and drug resistance [10, 11]. The activation of the Warburg effect in cancer cells has been identified as a hallmark of cancer, but the precise molecular mechanism remains unknown.
The N6-methyladenosine (m6A) modification is one of the most abundant internal modifications in messengerRNA (mRNA), transferRNA (tRNA), and ribosomalRNA (rRNA). It regulates RNA splicing and influences the stability and translation of modified RNAs [12, 13]. Methyltransferase 5, N6-adenosine (METTL5) is an 18S rRNA methyltransferase that increases protein translation activity in cancer and is essential for tumorigenesis and the determination of cell fate [14, 15]. Previous research has shown that mouse embryonic stem cells (mESCs) lacking METTL5 have a low translation rates and diminished differentiation potential [16]. Furthermore, it has been reported that METTL5 promoted tumorigenesis in breast and pancreatic cancer and that METTL5 deficiency resulted in significantly reduced global translation and S6K activation [17, 18]. Although the aberrant expression of METTL5 has been demonstrated to play critical roles in regulating biological processes, its functions and molecular mechanisms in regulating sophisticated metabolic reprogramming in HCC remain poorly understood. Therefore, to ascertain whether METTL5 is significantly linked to the reprogramming of glucose metabolism, we jointly analyzed data from multiple levels of transcriptomics and metabolomics. In this investigation, we sought to identify the clinical relevance of METTL5 in HCC and to clarify the molecular processes underlying METTL5-mediated glucose metabolism and HCC development.
2 MATERIALS AND METHODS
2.1 Clinical specimens and cell culture
HCC tissues and paired nontumorous tissues were collected from the sample database of Wuhan University Zhongnan Hospital (Wuhan, Hubei, China), and all patients provided written informed consent. According to the guidelines of the Declaration of Helsinki, this study was approved by the Ethics Committee of Wuhan University Zhongnan Hospital (KELUN2017082 and KELUN2020100). All HCC tissues included in this study were morphologically typical HCC. The cases that could be classified as combined hepatocellular-cholangiocarcinoma were excluded.
The human embryonic kidney cell line HEK-293T, HCC cell lines Huh-7, HCC-LM3, SNU-182, Hep-3B, and Hep-G2 were purchased from the Stem Cell Bank of the Chinese Academy of Sciences (Shanghai, China). The human normal liver cell line MIHA were purchased from Synthgene (Nanjing, Jiangsu, China). HEK-293T, MIHA, Huh-7, HCC-LM3, SNU-182, and Hep-G2 cells were cultured in Dulbecco's Modified Eagle Medium (DMEM; Gibco, Waltham, MA, USA) supplemented with 10% foetal bovine serum (FBS, Gibco). Hep-3B cells were cultured in Minimum Essential Medium (MEM; Gibco) supplemented with 10% FBS, 1% GlutaMAX (100×, Gibco), 1% nonessential amino acids (100×, Gibco) and 1% sodium pyruvate solution (100 mmol/L, Gibco). These cells were cultured in a 37°C incubator with 5% CO2. The cell lines were authenticated via short tandem repeat profiling and showed no mycoplasma contamination.
2.2 Immunofluorescence and immunohistochemical staining
Immunofluorescence and immunohistochemical staining were performed as described previously [19]. For immunofluorescence, sections were fixed using 4% paraformaldehyde at room temperature (RT) for 15 min. Then, sections were fixed in 4% donkey serum/phosphate-buffered saline (PBS) for 30 min at RT. Afterwards, sections were incubated in the primary antibody overnight at 4°C. The next day, sections were stained with the secondary antibody in 0.5% donkey serum/PBS for 1 h at RT in the dark, and then sections were mounted with mounting medium (with 4′,6-diamidino-2-phenylindole [DAPI, Sigma-Aldrich, St Louis, MO, USA]). The following primary antibodies and secondary antibodies used for immunofluorescence were listed in Supplementary Table S1.
For immunohistochemistry, the tissues were fixed, embedded, and sectioned. Xylene and ethanol were used to deparaffinize and rehydrate the paraffin-embedded tissues. For antigen retrieval, slides were steamed for 15 min in Tris- ethylenediaminetetraaceticacid (EDTA) buffer (pH 9.0; abcam, Cambridge, MA, USA). Then, slides were incubated in 0.3% H2O2-methanol (Aladdin, Shanghai, China) in the jar for 10 min. Slides were blocked with 4% donkey serum/Tris buffer solution and Tween 20 (TBST) for 1 h. Afterwards, slides were incubated in the primary antibody overnight at 4°C followed by incubation with the biotinylated secondary antibody for 60 min. Slides were incubated for 30 min with VECTASTAIN Elite ABC Reagent (Vectorlabs, Burlingame, CA, USA) and then reacted with peroxidase substrate solution 3, 3′-diaminobenzidine (DAB, Vectorlabs) until desired stain intensity develops. The dehydrated (70% ethanol-xylene substitute) slides were air-dried and then mounted with neutral tree gum (Solaibao, Beijing, China). The following primary antibodies and secondary antibodies used for immunohistochemistry were listed in Supplementary Table S1.
2.3 RNA extraction and quantitative real-time polymerase chain reaction (qRT-PCR)
Total RNA was extracted using TRIzol Reagent (ThermoFisher, Waltham, MA, USA). Denaturing agarose gel electrophoresis was used to assess RNA integrity and purity. Reverse transcription experiments were performed using HiScript II Q RT SuperMix (Vazyme, Nanjing, Jiangsu, China) and then cDNA was obtained. qRT-PCR was performed using 2× ChamQ Universal SYBR qPCR Master Mix (Vazyme). qRT-PCR reactions were carried out using the ABI 7500 system (Applied Biosystems; Foster City, CA, USA). Each 20 uL reaction mixture contained 2 μL of DNA extract, 1 μL of forward and reverse of each gene-specific primer, 10μl SYBR (Vazyme), and 6μL ddH2O. Thermal cycling conditions consisted of a first step of denaturation at 95°C for 10 min, followed by 40 cycles of denaturation for 10 s at 95°C, 57°C annealing for 25 s, and 72°C extensions for 20 s. β-actin was used as internal references, and the data were analyzed using 2−ΔΔCT. The sequences of the qRT-PCR primers used in the present study were were synthesized by Tsingke Biotech (Beijing, China) and listed in Supplementary Table S2.
2.4 Western blotting analysis
Western blotting were performed as described previously [19]. Briefly, total proteins were extracted using Radioimmunoprecipitation assay buffer (RIPA) buffer (Beyotime Biotechnology, Shanghai, China). Total protein concentrations in supernatants were quantified using Bicinchoninic Acid Assay (BCA) protein assays (Beyotime Biotechnology). Then proteins were separated by sodium dodecyl sulfate polyacrylamide gel electrophoresis (SDS-PAGE) (10%, 12.5%, and 15%) and transferred onto polyvinylidene fluoride (PVDF) membranes (Millipore, Billerica, MA, USA). Then, membranes were blocked for 1-2 h with 5% nonfat dry milk (Biosharp, Hefei, Anhui, China) and incubated with the various primary antibodies below overnight at 4°C. Subsequently, the membranes were incubated with the secondary antibodies. Protein bands were detected with enhanced chemiluminescence (ECL) detection reagent (GE Healthcare, Amersham, Buckinghamshire, UK). The gray value of each band was calculated and analyzed using ImageJ software (National Institutes of Health, Bethesda, MD, USA). All antibodies used in the present study is listed in Supplementary Table S1.
2.5 co-immunoprecipitation (co-IP)
The cells were lysed with lysis buffers containing 1% NP-40 (Thermo Fisher Scientific, Waltham, MA, USA), 20mmol/L Tris-HCL (pH 7.4; Solarbio, Beijing, China), 5 mmol/L Sodium Pyrophosphate (Solarbio), and complete protease inhibitor mixture (Sigma-Aldrich), and incubated on ice for 1 h followed by centrifugation at 10000 rpm for 10 min at 4°C. Whole cell extracts were added to a fresh Eppendorf (Thermo Fisher Scientific) containing 20 μL of A/G sepharose beads (Thermo Fisher Scientific). After 1 h at 4°C, discarded the beads and keep supernatant for immunoprecipitation. Transfered the supernatant to a fresh Eppendorf tube containing either rabbit or mouse IgG control antibody (2 μg) or the relevant antibody (2 μg) plus A/G sepharose beads (40 μL). After rotated for overnight at 4°C, collected the antibody-bound A/G sepharose beads. Re-suspend the beads in 1 mL lysis buffer and washed three times. The beads were boiled for 5 min at 96°C. Analyse immediately by SDS-PAGE and western blotting or analyzed by Liquid Chromatography-Mass Spectrometry (LC-MS/MS; Thermo Fisher Scientific). All antibodies used in the present study is listed in Supplementary Table S1.
2.6 Ubiquitination analysis
HCC cells or HEK293T cells grown in 10 cm dishes were transfected with different ubiquitin plasmids (Shanghai Sangon Biotech, Shanghai, China) and the indicated plasmids (Shanghai Sangon Biotech). Cells are incubated for 36 h after transfection and MG132 (Beyotime Biotechnology, Shanghai, China) is added to the samples. Cells was further incubated for 3 h after MG132 addition. The next steps were the same as those used for co-IP.
2.7 Plasmids, siRNAs, lentiviral construction, and cell transfection
Primers and recombinant plasmids were synthesized by Sangon Biotech (Shanghai, China). Transfection was performed using a pcDNA3.1-METTL5 overexpression construct or the pcDNA3.1 empty vector. Subsequently, the cells were transfected with Lipofectamine 3000 (Invitrogen) and plasmids for 48 h.
METTL5 overexpression plasmids were purchased from Tsingke Biotech (Beijing, China). Lentivirus packaging plasmids (pMD2.G, psPAX2) were purchased from Addgene (Watertown, MA, USA). METTL5 overexpression plasmids and lentivirus packaging plasmids were co-transfected into HEK293T cells to generate lentivirus particles. Lentiviral particles were added to HCC cell lines with subsequent incubation for 48 h. Stable cell clones were obtained through selection on 2 μg/mL puromycin. Stable METTL5 overexpression cell lines were confirmed by qRT-PCR and Western blotting.
The siRNA was synthesized by GenePharma Company (Shanghai, China). siRNA transfection was performed using GenMute™ siRNA Transfection Reagent for cells (SignaGen Laboratories, Ijamsville, MD, USA). The sequences of the siRNA used in the present study were listed in Supplementary Table S2.
2.8 CRISPR/Cas9
The small guide RNA (sgRNA) sequences were designed using the CRISPR Design Tool from the Zhang Laboratory (http://crispr.mit.edu). Then, the sgRNA was inserted into lentiCRISPR V2 vectors (Addgene, Watertown, MA, USA). Lentiviruses were produced by transfecting HEK293T cells with the packaging plasmids pMD2.G (Addgene) and psPAX2 (Addgene) and lentiCRISPRv2-sgRNA METTL5 using the Lipofectamine 2000 reagent (Invitrogen). Virus particles were harvested at 24 h and 48 h and then filtered with 0.45 μm syringe filters (Millipore, Burlington, MA, USA). After adding polybrene (SantaCruz Biotech; SantaCruz, CA, USA), the viral supernatant was used to infect HCC cells. After selection with 2 μg/mL puromycin (Solarbio), the knockout efficiency was analyzed by performing qRT-PCR and Western blotting.
2.9 Protein expression and purification
Mutant METTL5 was generated using a QuikChange Site-Directed Mutagenesis Kit (Stratagene, La Jolla, CA, USA). The recombinant plasmid was transformed into competent E. coli BL21 (DE3) (Bioteke, Beijing, China), and the positive monoclones were inoculated into LB-Amp medium (Solarbio). The transformed bacteria were placed on a shaker (37°C, 100 rpm) for 3-5 h until they reached an optical density (OD) value of 0.6-0.8. Isopropyl β-D-thiogalactoside (IPTG; Solarbio) was added to induce protein expression, and the cultures were allowed to grow overnight at 16°C and 180 rpm. The next day, the bacteria were collected and lysed using an EmulsiFlex B-15 high-pressure homogenizer (Avestin, Ottawa, ON, Canada). Then, the lysate was centrifuged at 14000 rpm for 30 min at 4°C, and the supernatant was collected. The supernatant was mixed with Ni-NTA resin (Qiagen Inc., Valencia, CA, USA) and incubated at 4°C for more than 40 min. After extensive washing with buffers containing 10 mmol/L, 20 mmol/L and 50 mmol/L imidazole (Solarbio), the protein was eluted in buffer containing 250 mmol/L imidazole. The protein was purified using an AKTA system (AKTA purifier, GE Healthcare, Northampton, MA, USA).
2.10 CCK-8 assay and colony formation assay
CCK-8 assays were performed with a kit (HY-K0301, Shanghai, China). A colony formation assay was performed to quantify the colony-forming capacity of cells. Briefly, 1000 cells were counted and cultured for 2 weeks. Then, the cells were fixed with 4% paraformaldehyde for 0.5 h and stained with 0.5% crystal violet for 1 h. Photographs were obtained, and the stained colonies were counted.
2.11 Scratch wound-healing motility assay and transwell invasion assay
Scratch wound-healing motility assays and Transwell invasion assays were performed as described previously [20]. Briefly, for Scratch wound-healing motility assay, HCC cells were seeded in 6-well plates (1 × 10⁶ cells/well) and cultured in DMEM medium without FBS supplementation for 24 h. The artificial wound was created using a 10 μL sterile pipette tip. Images of the scratches were captured at 0 h and 24 h. Microscopic photographs were taken, and the ratio of the scratch area to the picture area was calculated to determine the cell migration rate.
Transwell invasion assays were performed with Matrigel-coated chambers (6.5 mm diameter, 8 μm pore size; Corning Life Sciences, NY, USA) in 24-well plates. In the serum-free medium on the upper chamber, 1 × 10⁵ cells were sown, however, the medium with 10% FBS was placed in the lower chamber. The cells holding the upper chamber were removed after a complete incubation of 48 h. The invaded cells were stabilized and stained with 4% PFA and 0.1% crystal violet solution.
2.12 Apoptosis and cell cycle analysis
Cells were grown to 80% confluence and then incubated in serum-free medium for 24 h. Apoptosis was detected with an Annexin V-FITC/PI Apoptosis Kit (Lianke, Hangzhou, Zhejiang, China). The cell cycle analysis was performed using a Cell Cycle Staining Kit (Lianke). After staining, the cells were analyzed using a flow cytometer (CytoFLEX; Beckman Coulter, Inc., Fullerton, CA, USA). The data were analyzed using FlowJo software Version 10.0.7 (FlowJo, LLC, Oregon, USA).
2.13 Terminal deoxynucleotidyltransferase-mediated dUTP-biotin nick end labeling (TUNEL) staining
Briefly, each tissue section was dewaxed, then added 20 μg/mL DNase free protease K (Beyotime Biotechnology, Hangzhou, Zhejiang, China), and acted at 37°C for 30 min. PBS wash was performed 3 times. Then, 50 μL TUNEL reaction mixture (Beyotime Biotechnology) was added to the samples and incubated for 60 min at 37 °C, protected from light. The slides were dried and sealed with anti-fluorescence quenching sealing tablets. The tissue sections were observed under a fluorescence confocal microscope (Leica Biosystems, Wetzlar, Hessen, Germany).
2.14 Mice and in vivo experiments
All mouse studies were approved by the Animal Ethics and Welfare Committee of Wuhan University Zhongnan Hospital (permit number: ZN2022005). The BALB/c nude mice at 6 weeks old were purchased from Gempharmatech (Guangzhou, Guangdong, China) and and maintained under specific-pathogen-free (SPF) conditions. Mice were euthanized when showed obvious signs of discomfort or when maximal tumor size reached 2000 mm3. Mice were sacrificed by CO2 euthanasia.
For in vivo experiments, the animals were randomized. Human HCC xenograft models were established in 6-week-old female BALB/c nude mice by subcutaneously injecting HCC-LM3 tumor cells (5 × 10⁶ in Matrigel). At the end of the experiment the mice were euthanized, and all the tumors were collected. We next generated a HCC-LM3 cell line harbouring the Luc luciferase reporter (HCC-LM3-Luc). For the construction of orthotopic HCC mouse models, 1 × 10⁶ HCC-LM3-Luc cells in 30 μL of PBS were injected into the left lobe of the liver in 6-week-old female BALB/c nude mice.
The mouse HCC lung metastasis model was injected tail vein injection (i.v.) with 1 × 10⁶ HCC-LM3-Luc cells. Mouse abdominal tumor metastasis models were injected intraperitoneal (i.p.) with 2 × 10⁶ HCC-LM3-Luc cells. The bioluminescence (BLI) of the tumor was measured using an optical imaging system (IVIS spectrum CT, Perkin Elmer, Waltham, MA, USA). For Patient derived xenografts (PDX) models, HCC tissue was rapidly cut into 3 × 3 × 3 mm3 fragments on ice and subsequently implanted subcutaneously in the right forelimb of an Non Obese Diabetes/ShiLtJGpt-Prkdcem26Cd52Il2rgem26Cd22/Gpt (NCG) mouse to amplify the tumor cells (first-passage PDX model). Then, the tumor was collected and cut into small pieces when it grew to 800-1000 mm3 and subcutaneously inoculated into the right forelimb of new NCG mice (second-passage PDX model). When those tumors reached ∼ 200 mm3, mice were randomly divided into two groups for the antitumor study and survival assessment.
2.15 RNA-sequencing (RNA-seq)
Briefly, total RNA was extracted from METTL5-WT and METTL5-KO HCC cell samples, and the concentration and purity of the extracted RNA were detected with a NanoDrop 2000 spectrophotometer (NanoDrop Technologies, Wilmington, DE, USA). RNA integrity was detected using agarose gel electrophoresis, and the RNA integrity number (RIN) was determined with an Agilent 2100 (Agilent Technologies, Palo Alto, CA, USA). For the transcriptome analysis, mRNA was isolated from total RNA via A-T base pairing of Oligo(dT) magnetic beads with poly(A) tails. Fragmentation buffer was added to randomly fragment the mRNA, and small fragments of approximately 300 bp were isolated with magnetic beads. The libraries were sequenced using the Illumina NovaSeq 6000 platform (Illumina, San Diego, CA, USA). Differentially expressed genes (DEGs) were defined as genes with a P value < 0.05 and an absolute log2 (fold change) > 1.
2.16 Mitochondrial morphology analysis
A mitochondrial morphological analysis was conducted to evaluate changes in oxidative phosphorylation (OXPHOS) levels in HCC cells. Briefly, cells were incubated with the specific fluorescent mitochondrial probe MitoSceneTM Green Ι (US Everbright, Suzhou, Jiangsu, China) or MitoTrackerTM Red (Beyotime Biotechnology, Shanghai, China) at 37°С for 30 min. Images were captured using a laser scanning confocal microscope (Leica Biosystems, Wetzlar, Hessen, Germany). The length of the mitochondria was measured using ImageJ analysis software.
2.17 Measurement of glucose consumption and lactate production
Glucose and lactate levels in the culture medium were measured using a colorimetric glucose uptake assay kit (AAT Bioquest, Sunnyvale, CA, USA) and an L-lactate assay kit (AAT Bioquest), respectively. Briefly, for glucose uptake assay, HCC cells were seeded at 5000 cells/well in a 96-well culture plate and incubated in 90 μl/well of Glucose Uptake Buffer (AAT Bioquest) for 1 h. Subsequently, cells were exposed to 10 μL/well of 2-deoxyglucose (2-DG; AAT Bioquest) for 40 min. Lastly, 50 μL of the Uptake Assay Mixture (AAT Bioquest) was added to each sample. The sample was detected using a TECAN SPARK 10M Microplate Reader (Tecan Group Ltd., Männedorf, Zürich, Switzerland) at Ex/Em = 570/610 nm.
For L-lactate assay, 50 μL L-Lactate working solution (AAT Bioquest) was added to each sample. The samples were incubated at room temperature for 2 h and absorbance was measured using a TECAN SPARK 10M Microplate Reader (Tecan Group Ltd.) at 575 nm/605 nm. The standard curve was used to determine lactate concentrations in the samples.
2.18 Measurement of extracellular acidification rate (ECAR)
The ECAR and oxygen consumption rate (OCR) in HCC cells were analyzed using an XFe96 Extracellular Flux Analyser (Agilent Tech, Santa Clara, CA, USA). Briefly, cells were seeded at a density of 4 × 10⁴ cells per well in medium supplemented with 2 mmol/L glutamine (for ECAR) or 2 mmol/L glutamine, 10 mmol/L glucose and 1 mmol/L pyruvate (for OCR). After equilibration of the temperature and pH, measurements were recorded with the analyser according to the manufacturer's protocol.
2.19 Untargeted metabolomics
The samples were separated using an Agilent 1290 Infinity LC ultrahigh-performance liquid chromatography HILIC column (Agilent Technologies, Santa Clara, CA, USA). The column temperature was 25°C; the flow rate was 0.3 mL/min; the injection volume was 2 μL; and the mobile phase composition was A: water + 25 mmol/L ammonium acetate + 25 mmol/L ammonia water; B: acetonitrile. The gradient elution program was as follows: 0-1 min, 95% B; 1-14 min, B linearly changed from 95% to 65%; 14-16 min, B linearly changed from 65% to 40%; 16-18 min, B maintained at 40%; 18-18.1 min, B linearly changed from 40% to 95%; and 18.1-23 min, B maintained at 95%. MassHunter Quantitative Analysis Software (Agilent, version 6.0) was used to analyse the data.
2.20 Liquid chromatography-Mass spectrometry (LC/MS)
Briefly, adding buffer S1 nuclease (Takara Biotechnology, Dalian, Liaoning, China), Alkaline Phosphatase (Takara Biotechnology) and Phosphodiesterase I (Sigma-Aldrich) into 1 μg RNA, then the mixture was incubated at 37°C. After the RNA was digested into nucleosides completely, the mixture was extracted with chloroform (Sigma-Aldrich). The resulting aqueous layer was collected for analysis with LC-MS/MS. The sample extracts were analyzed using an UltraPerformanceLiquid (UPLC)-MS/MS system (UPLC, ExionLC™ AD, Applied Biosystems 6500 Triple Quadrupole; oster City, CA, USA). The analytical conditions were as follows, LC: column, Waters ACQUITY UPLC HSS T3 C18 (1.8 μm; Waters, Milford, MA, USA); solvent system, water (2 mmol/L NH4HCO3): methanol (2 mmol/L NH4HCO3); gradient program, 95:5V/V at 0 min, 95:5V/V at 1 min, 5:95 V/V at 9 min, 5:95 V/V at 11 min, 95:5 V/V at 11.1 min, 95:5 V/V at 14 min; flow rate, 0.30 mL/min; temperature, 40°C; injection volume: 10 μL. The effluent was alternatively connected to an Electrospray Ionization-triple quadrupole-linear ion trap. A specific set of multiple reaction monitoring transitions were monitored for each period according to the metabolites eluted within this period.
2.21 Dual-luciferase assay
Luciferase reporter assay was performed using a Dual Luciferase Assay Kit (Promega, Madison, WI, USA). The wild type (WT) and mutant METTL5 were inserted into the pGL3- plasmid. Transient transfection was performed using Lipofectamine 3000 (Thermo Fisher, Carlsbad, CA, USA) according to the manufacturer's instructions. One or 2 days later, luciferase activity was measured with a Dual-Glo Luciferase Assay System (Promega), and Renilla luciferase activity was used to normalize the firefly luciferase activity.
2.22 Chromatin immunoprecipitation (ChIP) assay
ChIP assays were performed using a ChIP assay kit (Merck Millipore, Darmstadt, Germany). The samples were fixed with 1% formaldehyde in PBS and sonicated to obtain 200-500 bp DNA fragments. The sonicated samples were immunoprecipitated using 5 μg of anti-METTL5 or anti-IgG antibodies. A qRT-PCR analysis was performed after the elution of the immune complexes and reversal of crosslinks. The sequences of the qRT-PCR primers used in the present study are listed in Supplementary Table S2.
2.23 Polysome profiling
Briefly, cells were incubated with Cycloheximide (CHX; Sigma–Aldrich) for 5 min at 37°C. The medium was removed, and the cells were washed with PBS containing 100 μg/mL CHX. Next, 300 μL of Triton X-100-containing lysis buffer (Sigma–Aldrich) were added and incubated with the cells for 15 min. Each cell suspension was centrifuged at 13000 g for 15 min, and the supernatant was collected. Subsequently, a 10%-50% sucrose gradient was prepared in lysis buffer without Triton X-100. Cell lysates were loaded onto a sucrose gradient and centrifuged at 27500 rpm for 4 h at 4°C. The samples were then fractionated and analyzed with a Gradient Station (BioCamp, New Brunswick, Canada).
2.24 AAV production
For AAV-mediated CRISPR delivery, we used the pAAV-U6sgRNA(SapI)_hSyn-GFP-KASH-bGH (pX552) vector (Addgene) and pX551-CMV-SpCas9 vector (Addgene). The gRNA-coding sequences were cloned into pX552 using SapI (Thermo Scientific). Transgene plasmids were introduced using rep/cap plasmid and adenovirus helper plasmid (pAdΔF635; Applied Viromics, Fremont, CA, USA). We isolated associated AAV from the cell culture media of virus-producing HEK293T cells.
2.25 Transmission electron microscopy (TEM)
The morphology of samples was observed by TEM (JEOL JEM-1400 Plus, JEOL, Tokyo, Japan). Briefly, about 30 μL sample was pipetted onto a carbon-coated copper grid (Xinxing Braim, Beijing, China). At 5 min later, the sample was deposited, and a drop of 4% uranium acetate stain was added to the copper grid. After air-drying, the samples were observed by TEM.
2.26 Bioinformatic analyses
The mRNA expression and clinicopathological data were downloaded from the Cancer Genome Atlas Liver Hepatocellular Carcinoma (TCGA-LIHC) dataset. The Genotype-Tissue Expression (GTEx) data of normal liver tissues were downloaded from the GTEx website. The microarrays that contain gene expression data of HCC tissues and adjacent normal liver tissues were searched and downloaded from the Gene Expression Omnibus (GEO) database (GSE14520, GSE76427, GSE138178, GSE105130, GSE104310). METTL5 expression associations with tumor grade and individual cancer stages were analyzed in the TCGA analysis module of University of Alabama at Birmingham CANcer Data Analysis Portal (UALCAN). Kyoto Encyclopedia of Genes and Genomes (KEGG) analysis was performed using the KEGG pathway database. Gene set enrichment analysis (GSEA) was employed for the characterization of the DEGs identified by RNA-seq and performed by using GSEA software v3.0 with the default settings. Principal component analysis (PCA) was performed to examine intrinsic clusters of metabolomics data. The human METTL5 promoter sequence was predicted using the University of California, Santa Cruz (UCSC) genome bioinformatics program. Transcription factor binding sites were predicted using GeneCards, TFtarget, and JASPAR database.
2.27 Statistical analyses
All statistical analyses were performed using SPSS software (SPSS Standard, version 17.0, Chicago, IL, USA) or Prism software version 7.0 (GraphPad Prism version 8.3.1; GraphPad Software, www.graphpad.com). Student's t test was used to compare data from two groups. Survival analysis was performed using the Kaplan-Meier method. Spearman's rank coefficient was calculated to assess correlations. The independent prognostic factors in HCC were determined using univariate proportional hazards (Cox) regression and multivariate Cox regression. All experiments were repeated three times, unless specified otherwise, and P values of 0.05 were considered to indicate statistically significant differences.
3 RESULTS
3.1 METTL5 was upregulated in HCC and associated with poor prognosis
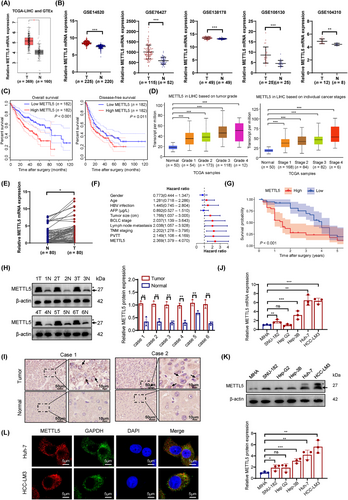
Analyses of TCGA-LIHC database and GTEx database revealed that METTL5 transcript levels were significantly upregulated in HCC (Figure 1A). Microarray data downloaded from the GEO database similarly showed that METTL5 was overexpressed in HCC (Figure 1B). Furthermore, we discovered that METTL5 transcript levels were significantly elevated in a wide range of cancers, particularly HCC (Supplementary Figure S1). According to Kaplan-Meier survival curves, HCC patients with high METTL5 expression had a poor prognosis (Figure 1C). Analysis of the UALCAN database revealed significant associations between METTL5 transcript levels and the tumor grade and stage (Figure 1D). A qRT-PCR analysis of METTL5 expression in 80 pairs of HCC tissues and adjacent normal tissues randomly extracted from the sample database of the Wuhan University Zhongnan Hospital showed significantly upregulated levels of the METTL5 transcript in HCC, and METTL5 expression was associated with the tumor size and TNM stage (Figure 1E and Supplementary Table S3). Multivariate Cox proportional hazard regression analysis revealed that patients with HCC presenting METTL5 overexpression experienced shorter overall survival, and METTL5 was an independent risk factor for shorter survival in HCC patients (Figure 1F and Supplementary Table S4). After dividing the patients with HCC into low- and high-METTL5-expression subgroups according to the median value, Kaplan-Meier analysis revealed that high METTL5 expression was closely associated with a poor prognosis for HCC patients (Figure 1G). Western blotting analysis and immunohistochemistry confirmed the upregulation of METTL5 protein levels in HCC tissues (Figure 1H-I). METTL5 mRNA and protein levels were increased in 5 HCC cell lines compared to the expression in MIHA human hepatocytes (Figure 1J-K). Confocal laser scanning microscopy uncovered that the METTL5 protein (red fluorescence) in HCC cells was predominantly cytoplasmic (Figure 1L). These findings suggested that METTL5 may serve as a potential biomarker for the diagnosis and treatment of HCC.
3.2 METTL5 enhanced the Warburg effect in HCC cells
We first constructed stable METTL5-knockout (KO) HCC cell lines (Huh-7 and HCC-LM3) using CRISPR/Cas9 technology to investigate the potential molecular mechanism of METTL5 in HCC (Figure 2A and Supplementary Figure S2A-B). Then, we constructed a Hep-G2 cell model that stably overexpresses METTL5 via lentiviral transduction (Supplementary Figure S2C). RNA-seq was performed to screen the genes that were expressed differentially in HCC cell lines after METTL5 knockout (Supplementary Figure S2D-E). The KEGG pathway analysis of differentially expressed mRNAs revealed a considerable enrichment of glycolysis (Figure 2B). GSEA performed on the transcriptome data revealed that METTL5 greatly increased the MYC signaling pathway and glycolytic signaling pathway (Supplementary Figure S2F). Consequently, a GSEA analysis of the TCGA database revealed a positive correlation between METTL5 and the MYC signaling pathway (Supplementary Figure S2G). Furthermore, we detected metabolites with a non-targeted metabolomics approach based on high-performance liquid chromatography-tandem mass spectrometry. The metabolomes of METTL5-KO cells differed significantly from those of METTL5-WT cells, as seen by the heatmap of metabolite abundance and PCA (Supplementary Figure S3A-B). According to metabolomic profiling, METTL5-KO generated significant changes in metabolism, including higher levels of tricarboxylic acid (TCA) cycle metabolites and lower levels of lactate (Figure 2C). Subsequently, we detected differentially expressed genes related to glycolysis in the RNA-seq data. METTL5 knockout in HCC cells significantly inhibited the expression of the glycolytic genes lactate dehydrogenase A (LDHA), enolase 1 (ENO1), triosephosphate isomerase 1 (TPI1), solute carrier family 2 member 1 (SLC2A1), and pyruvate kinase M2 (PKM2) at the mRNA and protein levels, while METTL5 overexpression exerted opposite effects (Figure 2D and Supplementary Figure S3C). In addition, analyses of the TCGA-LIHC database and 80 pairs of HCC tissues revealed a substantial positive correlation between METTL5 transcript levels and glycolytic gene expression levels (Supplementary Figure S4).
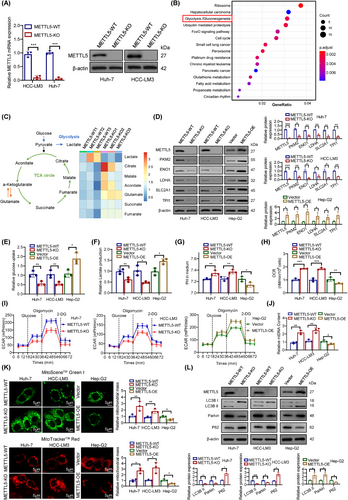
We subsequently measured glucose uptake and lactate production after knocking out METTL5 to systematically study whether METTL5 activation promoted aerobic glycolysis (the Warburg effect) in HCC. This glycolytic phenotype is inhibited by decreased glucose absorption and lactate generation. As expected, silencing METTL5 significantly reduced glucose uptake and lactate generation. It has been observed that the acidic tumor microenvironment (lower pH) is caused by lactate overproduction, which encourages tumor cells to metastasize [21]. Thus, decreased lactate synthesis limits the formation of acidic tumor microenvironments, as seen by increased medium pH. Additionally, the downregulation of glycolytic genes inhibited the conversion of mitochondrial OXPHOS to glycolysis in tumor cells. Enhanced OXPHOS leads to increased oxygen consumption [22]. Our results showed that METTL5 knockout suppressed glucose uptake and lactate generation, and increased the pH value and oxygen consumption of HCC cells, whereas METTL5 overexpression exerted the opposite effect (Figure 2E-H). We next measured the ECAR in HCC cells. METTL5 knockout significantly impaired glycolysis in HCC cell lines, whereas METTL5 overexpression produced the opposite results (Figure 2I). Furthermore, we monitored mitochondrial mass to assess the metabolic response; METTL5 knockout significantly increased the mitochondrial DNA (mtDNA) content in HCC cells, whereas METTL5 overexpression exerted the opposite effect (Figure 2J). Additionally, MitoSceneTM Green Ι and MitoTrackerTM Red staining showed that METTL5 knockout potentiated mitochondrial function in HCC cells, while METTL5 overexpression inhibited mitochondrial function (Figure 2K). It has been reported that reactive oxygen-nitrogen species (RONS) production and a hypoxic and acidic tumor microenvironment trigger mitochondrial dysfunction and enhanced mitophagy by the Warburg effect [23]. Mitophagy, a form of macroautophagy that degrades damaged mitochondria, is an adaptive response of mitochondria to various stresses and metabolic disturbances [24]. We further explored whether METTL5 regulates mtDNA and mitochondrial function through mitophagy. First, we analyzed the protein levels of autophagosome markers, such as P62, Parkin, microtubule associated protein 1 light chain 3 beta-1 (LC3B-I), and LC3B-II. P62 is a mitophagy adaptor protein, and its reduction indicates mitophagy [25]. Western blotting results showed that METTL5 knockout downregulated the expression of Parkin and LC3B-II but upregulated the expression of P62 (Figure 2L). After METTL5 knockout, TEM revealed a reduction in autophagosomes and mitophagosomes (Supplementary Figure S5). According to these findings, METTL5 increased glycolysis while decreasing mitochondrial OXPHOS in HCC cells, which was consistent with the Warburg effect.
3.3 c-Myc played an essential role in the reprogramming of glucose metabolism
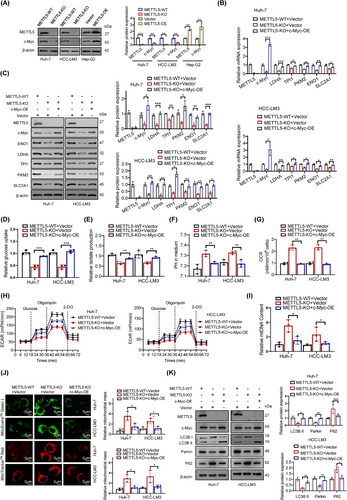
According to a previous study, transcription factors play a crucial role in regulating glycolytic metabolism [26]. We hypothesized that METTL5 promotes the transcription of glycolytic genes by inducing the expression of transcription factors. We used the UCSC and JASPAR databases to predict transcription factors that bind to the glycolytic genes LDHA, ENO1, TPI1, SLC2A1 and PKM2. Probably, c-Myc, hypoxia inducible factor 1 subunit alpha (HIF-1α) and MYC associated zinc finger protein (MAZ) were transcription factors for these glycolytic genes. Our results showed that METTL5 knockout reduced c-Myc protein expression but did not affect c-Myc, HIF-1α, or MAZ mRNA expression or HIF-1α and MAZ protein expression, which was consistent with the GSEA results (Figure 3A and Supplementary Figure S6A-B). Therefore, we suspect that c-Myc might be the hinge that links METTL5 to glycolysis. c-Myc overexpression attenuated the METTL5 knockout-mediated downregulation of glycolytic genes (Figure 3B-C), downregulation of glucose uptake and lactic acid production (Figure 3D-E), upregulation of pH and oxygen consumption (Figure 3F-G), and downregulation of the ECAR (Figure 3H). Additionally, c-Myc overexpression attenuated the METTL5 knockout-mediated increases in mitochondrial respiration and mass (Figure 3I-K). These results supported the hypothesis that METTL5 modulated c-Myc expression to regulate glycolytic activity.
3.4 METTL5 promoted ubiquitin-specific peptidase 5 (USP5) translation in an m6A-dependent manner
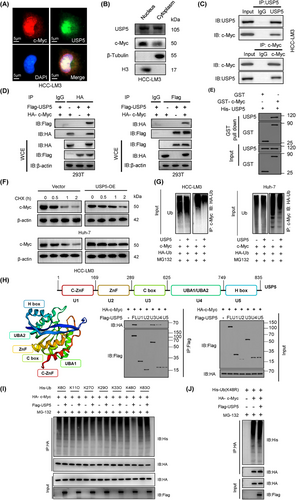
Based on our results, METTL5 knockout significantly reduced c-Myc protein expression. Moreover, the polysome fractionation analysis showed that the translation of c-Myc was not significantly altered in METTL5-KO cells (Supplementary Figure S6C). According to previous reports, multiple ubiquitin-conjugating enzymes (ubiquitin ligases) and deubiquitinating enzymes interact and regulate c-Myc degradation via the proteasome system [27, 28]. We evaluated c-Myc protein stability using the translation inhibitor CHX and confirmed that METTL5 extended the half-life of the c-Myc protein (Figure 4A). Pretreatment with the proteasome inhibitor MG132 prevented the ease in c-Myc stability (Figure 4B), indicating that METTL5 knockout destabilized c-Myc, leading to its degradation by the proteasome. Subsequent ubiquitination assays showed that METTL5 overexpression decreased the ubiquitination and degradation of c-Myc (Figure 4C).
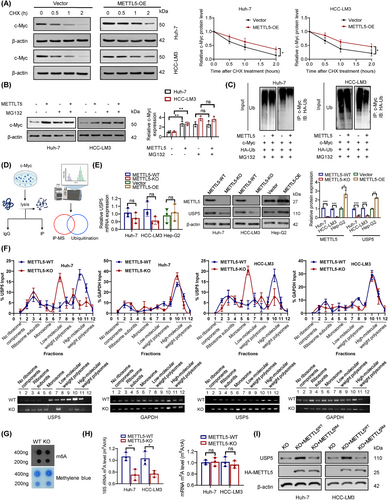
We performed co-IP and MS to identify potential proteins that interact with c-Myc in HCC and to investigate how METTL5 knockout promotes c-Myc ubiquitination and degradation (Figure 4D). We were unable to identify any METTL5 peptides that interacted with c-Myc. Interestingly, however, we found that USP5, F-box and WD repeat domain containing 7 (FBW7), F-box protein 32 (FBXO32), S-phase kinase associated protein 2 (SKP2), USP7, USP37, USP28, USP36, and tripartite motif containing 32 (TRIM32) strongly interacted with c-Myc (Supplementary Figure S6D-E). Moreover, METTL5 knockout reduced USP5 protein expression but did not significantly alter the expression and translation levels of other deubiquitination- and ubiquitination-related proteins (Figure 4E and Supplementary Figure S6E-F).
METTL5 regulates ribosome function by methylating 18S rRNA, and METTL5-KO cells have about 30% fewer proteins than parental control cells [17]. We used extracts from METTL5-WT and METTL5-KO cells to perform polysome fractionation analysis to determine whether METTL5 has an impact on USP5 translation. The results demonstrated that METTL5 knockout had no effect on the profile of GAPDH mRNA, whereas USP5 mRNA was transferred from the heavier polysomal fractions to the lighter fractions (Figure 4F). This result suggested that METTL5 knockout inhibited USP5 mRNA translation. Consequently, we investigated whether USP5 translational activity is dependent on METTL5 methylase activity. After METTL5 knockout, the m6A level of total RNA decreased significantly, as demonstrated by dot blots (Figure 4G). After separation of rRNA and mRNA, LC/MS showed that METTL5 knockout significantly reduced the m6A level of 18S rRNA but had no effect on the m6A level of mRNA (Figure 4H and Supplementary Figure S7A). Moreover, the m6A methylation level of c-Myc did not differ between METTL5-KO cells and METTL5-WT cells (Supplementary Figure S7B). Then, we constructed a METTL5 mutant without enzymatic activity (“NPPF” to “APPA”, Mut; Supplementary Figure S7C-D). Intriguingly, overexpression of hemagglutinin (HA)-METTL5-WT attenuated the effect of METTL5 knockout on USP5, but overexpression of HA-METTL5-Mut did not rescue USP5 protein expression (Figure 4I). Thus, the translation of USP5 is directly dependent on METTL5 18S rRNA methyltransferase activities. It has been reported that the METTL3-METTL14 complex, a well-known mRNA m6A methyltransferase complex, also mediates DNA m6A methylation (m6dA) in vitro [29]. However, no report has indicated whether METTL5 is involved in DNA methylation. In both METTL5-WT and METTL5-KO cells, we detected modifications in the m6da region of genomic DNA. We were unable to detect m6dA changes following METTL5 knockout (Supplementary Figure S8A). Using a dual luciferase reporter assay, we subsequently determined that METTL5 had no effect on USP5 promoter activity (Supplementary Figure S8B). Our results indicated that METTL5 was a pure RNA methylase and exhibitd no regulatory effect on DNA methylation.
3.5 METTL5-mediated c-Myc stabilization required USP5-dependent deubiquitination
We hypothesized that METTL5 stabilizes c-Myc through USP5. USP5 is a deubiquitinating enzyme that is essential for the stability and function of proteins. The substrates of the deubiquitinating enzyme USP5 mediate essential biological functions, including cell survival, proliferation, and death. However, no reports have described how USP5 deubiquitinates c-Myc. USP5 knockdown significantly reduced c-Myc protein levels in HCC cell lines (Supplementary Figure S9A). We then investigated whether USP5 stabilizes c-Myc through deubiquitination. Immunofluorescence colocalization and nucleoplasmic separation demonstrated that c-Myc is localized in the nucleoplasm and USP5 is present in both the cytoplasm and nucleoplasm (Figure 5A-B), indicating that c-Myc and USP5 are mostly colocalized in the nucleus. Subsequently, the interaction between USP5 and c-Myc was shown using endogenous and exogenous co-IP assays (Figure 5C-D). Glutathione-S-transferase (GST) pulldown assays further confirmed that GST-c-Myc purified from bacteria, but not GST, pulled down recombinant His-USP5 (Figure 5E and Supplementary Figure S9B). Importantly, USP5 overexpression significantly increased c-Myc protein stability while decreasing c-Myc ubiquitination (Figure 5F-G). Pretreatment with the proteasome inhibitor MG132 inhibited this increase in c-Myc levels (Supplementary Figure S9C). USP5 is an ∼120 kDa protein with five distinct domains: two ZnF domains (1-168; 169-289), a C Box domain (290-624), a UBA1/UBA2 domain (625-749), and a H box domain (750-835). To investigate which domain of USP5 interacted with c-Myc, 293T cells were cotransfected with different domains of Flag-USP5 and HA-c-Myc, and our results showed that only U3 and U4 directly bonded to the c-Myc protein (Figure 5H). Moreover, USP5 inhibited c-Myc polyubiquitination at the K48 linkage but not at other linkages (Figure 5I). When K48 ubiquitination sites were mutated (K48R), USP5-mediated ubiquitination of c-Myc was abolished (Figure 5J). These results indicated that USP5 specifically binds to c-Myc and protects c-Myc from polyubiquitination-mediated degradation. Finally, overexpression of USP5 in the presence of METTL5 knockout abrogated the effect of METTL5 on c-Myc (Supplementary Figure S9D). These data suggest that METTL5-mediated c-Myc stabilization necessitates USP5-dependent deubiquitination. Furthermore, we used immunohistochemistry and Western blotting to determine the amounts of METTL5, c-Myc, and USP5 protein in HCC tissue samples. According to the correlation study, METTL5 protein levels were positively linked with USP5 and c-Myc protein levels (Supplementary Figure S10A). METTL5, USP5, and c-Myc were shown to be strongly expressed in HCC tissues when compared to nearby normal liver tissues (Supplementary Figure S10B). Finally, analyses of the TCGA-LIHC database and 20 pairs of HCC tissues showed that USP5 and c-Myc transcript levels were positively correlated with glycolytic gene expression levels (Supplementary Figure S11, Supplementary Figure S12).
3.6 METTL5 promoted HCC growth and metastasis
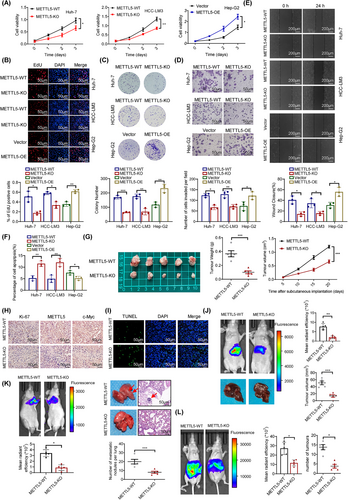
We next examined the effects of METTL5 knockdown and overexpression on HCC cell proliferation and migration to further explore the function of METTL5 in HCC. CCK-8, EdU, and colony formation assays revealed that METTL5 knockout significantly reduced cell proliferation and that METTL5 overexpression increased proliferation (Figure 6A-C and Supplementary Figure S13A-B). Transwell and scratch healing assays revealed that METTL5 knockout inhibited cell invasion and migration and that METTL5 overexpression increased invasion and migration (Figure 6D-E and Supplementary Figure S13C-D). Cancer cells must undergo epithelial-to-mesenchymal transition (EMT) in order to commence metastasis. We therefore investigated if METTL5 had an effect on EMT in HCC cells. qRT-PCR and Western blotting results revealed that METTL5 knockout downregulated the expression of mesenchymal markers (N-cadherin, fibronectin, and vimentin) but upregulated the expression of E-cadherin. In contrast, its overexpression showed the opposite effects (Supplementary Figure S14). These results indicated that METTL5 promoted EMT. Additionally, METTL5 deletion greatly enhanced apoptosis rates but had no effect on the cell cycle (Figure 6F and Supplementary Figure S15). We constructed HCC subcutaneous xenograft models, orthotopic HCC mouse models, tail vein injection lung metastasis models and abdominal metastasis models to further study the effect of METTL5 in vivo. Tumor growth and weight in the METTL5-KO group were significantly lower than those in the METTL5-WT group (Figure 6G). Immunohistochemistry analysis showed that the METTL5-KO group had lower Ki-67 and glycolytic genes expression than the METTL5-WT group (Figure 6H and Supplementary Figure S16A). TUNEL labeling revealed that the METTL5-KO group had a considerably higher apoptosis rate than the METTL5-WT group (Figure 6I). In orthotopic HCC mouse models, the METTL5-KO group exhibited considerably slower tumor growth and lower glycolytic genes expression than the METTL5-WT group (Figure 6J and Supplementary Figure S16B). The lung metastasis tumor models and abdominal tumor metastasis models showed that METTL5 knockout significantly reduced the mean bioluminescence intensity of metastatic foci and the number of metastatic nodules (Figure 6K-L). Based on these results, METTL5 promoted the proliferation and invasion of HCC cells in vitro and in vivo.
3.7 The tumor-promoting function of METTL5 depended on c-Myc-mediated reprogramming of glucose metabolism
Because abnormal glucose metabolism is related to the progression of HCC, we sought to further determine whether c-Myc is a downstream effector of METTL5-mediated HCC progression. We overexpressed c-Myc in the METTL5-KO cell line to test this hypothesis. A series of phenotypic tests revealed that c-Myc overexpression reduced the suppression of Huh-7 and HCC-LM3 cell proliferation and invasion in the absence of METTL5 (Figure 7A-E). We further verified the role of c-Myc in METTL5-mediated HCC progression in nude mice and found that the effects of METTL5 knockout were indeed reversed by c-Myc overexpression (Figure 7F-I). These results demonstrated that c-Myc was important for the in vitro development and metastasis of HCC mediated by METTL5.
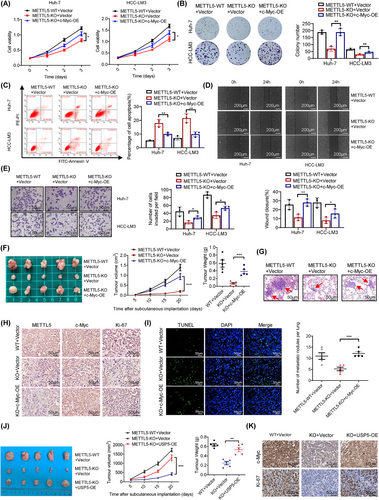
Finally, we overexpressed USP5 in the METTL5-KO cell line to determine the pivotal role of UPS5. A series of phenotypic experiments showed that USP5 overexpression attenuated the inhibition of proliferation and invasion of Huh-7 and HCC-LM3 cells in the absence of METTL5 (Supplementary Figure S17). Furthermore, we verified the involvement of USP5 in METTL5-mediated HCC progression in vivo and discovered that USP5 overexpression reversed the inhibitory effects of METTL5 knockdown on c-Myc expression and proliferation (Figure 7J-K). These data suggested that USP5 was essential for METTL5-mediated cancer-promoting function in HCC.
3.8 cAMP responsive element binding protein 1 (CREB1)/P300 promoted METTL5 transcription
An in silico investigation was carried out using the GeneCards, UCSC, and JASPAR databases to identify potential upstream transcription factors associated with METTL5 upregulation in HCC (Supplementary Figure S18A). CREB1, E74 like ETS transcription factor 1 (ELF1), and CCAAT enhancer binding protein beta (CEBPB) were the major transcription factors for METTL5, and CREB1 was chosen for further study because CREB1 knockdown reduced METTL5 mRNA and protein expression (Figure 8A-B), but ELF1 or CEBPB knockdown did not (Supplementary Figure S18B). The DNA-binding motif of the CREB1 transcription factor was obtained from JASPAR (Figure 8C and Supplementary Figure S18C). We generated a series of truncated METTL5 promoter-luciferase constructs to clarify the CREB1-mediated transcription of METTL5. The luciferase reporter assay showed that the promoter region from base pairs 1400 to 2100 in the METTL5 gene contained a CREB1-responsive site (Figure 8C). Therefore, we constructed METTL5-WT and METTL5-Mut promoter luciferase reporter vectors by sequentially mutating the predicted METTL5 promoter sequence between bases 1554 and 1565. CREB1 overexpression increased the relative luciferase activity of the METTL5-WT vector but minimally affected the luciferase activity of the METTL5-MUT vector (Figure 8D). In addition, ChIP studies demonstrated that the METTL5 promoter region interacted with CREB1 (Figure 8E). CREB1 enhances METTL5 expression in HCC via binding to the METTL5 promoter region, as indicated by these results.
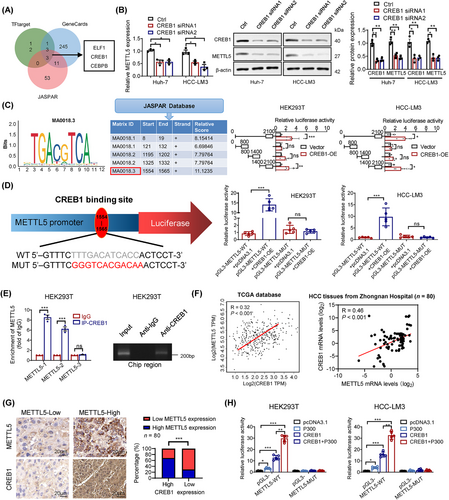
In addition, we investigated the crucial regulatory role of CREB1 in HCC aerobic glycolysis. Analyses of the TCGA-LIHC database revealed that CREB1 transcript levels were significantly upregulated in HCC (Supplementary Figure S19A). qRT-PCR and Western blotting analysis verified the upregulation of CREB1 mRNA and protein levels in HCC tissues (Supplementary Figure S19B-C). In addition, studies of the TCGA-LIHC database showed that CREB1 transcript levels were positively correlated with glycolytic gene expression levels (Supplementary Figure S19D). CREB1 knockdown in HCC cells significantly inhibited the expression of the glycolytic genes LDHA, ENO1, TPI1, SLC2A1, and PKM2 at the mRNA and protein levels (Supplementary Figure S19E-F). Correlation analysis of results from the TCGA database and eighty pairs of HCC tissues from Zhongnan Hospital showed that METTL5 expression was positively correlated with CREB1 expression (Figure 8F-G).
It has been reported that E1A-binding protein p300 (p300) functions as a coactivator of the CREB1 transcription factors and directly interacts with CREB1 to enhance its activity [30]. The luciferase reporter test demonstrated that p300 might work independently to stimulate METTL5 transcription and CREB1 activity on the METTL5 promoter (Figure 8H). Notably, when coexpression of CREB1 and p300, METTL5 transcription was boosted up to 30-fold compared to the basal promoter alone. This amount is significantly more than additive, implying CREB1 and P300 have a functional synergy. This effect disappeared due to mutations in the binding sites of the METTL5 promoter. Additionally, the results of ChIP analysis showed that p300 was not able to bind to the METTL5 promoter region (Supplementary Figure S19G). Collectively, these results demonstrated that p300 functions as a CREB1 coactivator at the METTL5 promoter.
3.9 METTL5 knockout inhibited liver tumor growth in PDX models
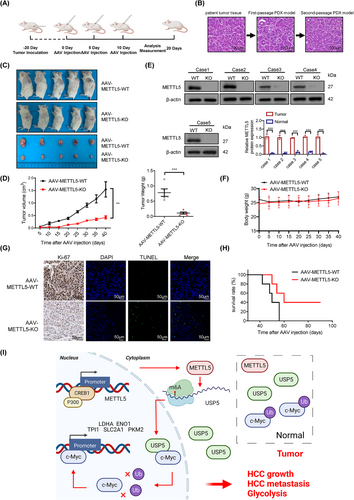
Because of the striking likeness to the actual clinical specimens from patients, PDXs are quickly becoming the gold standard for clinical drug research [31]. Hepatoma tissues dissected from a second-passage PDX model were implanted into NCG mice to assess whether METTL5 knockout exerted a similar effect on the PDX model (Figure 9A-B). Adenovirus-mediated knockout of METTL5 exerted a good antitumor effect (Figure 9C-D). METTL5 knockout efficiency was testified by Western blotting (Figure 9E).The body weights of all mice remained similar during the treatment period (Figure 9F). The AAV-METTL5-KO group exhibited lower Ki-67 expression and a higher apoptosis rate (Figure 9G). METTL5 knockout significantly increased the survival time (Figure 9H). When taken in context with the other results, the remarkable tumor-suppressive effect of METTL5 knockout in PDX models provides strong evidence for the enormous potential of METTL5 knockout for clinical development. Based on the collective data, we concluded that METTL5 was activated by CREB1/P300, which reduced c-Myc ubiquitination by facilitating USP5 translation, thus leading to HCC malignant progression (Figure 9I).
4 DISCUSSION
Since cancer cells proliferate and divide at an uncontrolled rate, their energy needs are higher [32]. The Warburg effect, which occurs during the development of cancer cells, causes an increase in glycolysis, which in turn maintains cell proliferation, doubles the energy supply, and creates an acidic milieu necessary for tumor cell dissemination and invasion [8, 9]. This pathological alteration in energy metabolism leads to epigenetic and genetic changes and produces a variety of severely impaired phenotypes, further enhancing the proliferation and invasiveness of cancer cells. In the present study, we found that METTL5 expression is upregulated in HCC and is associated with a poor prognosis. By reprogramming glucose metabolism, METTL5 upregulation promotes cell proliferation, metastasis, and EMT in HCC.
In recent years, a growing number of studies have revealed that RNA methylation alterations are aberrant in a variety of malignancies and that they play crucial roles in regulating tumor immunosuppression, migration, invasion, metastasis, proliferation, and chemotherapy resistance [12, 33]. METTL5, one of the best-studied 18S rRNA methyltransferases, is essential for embryonic development and plays critical roles in protein translation and polysome formation [14, 16]. Interestingly, in addition to m6A methyltransferase activity, METTL5 enhances protein translation in cancer, reduces apoptosis, and promotes cell cycle progression [17]. As shown in the present study, METTL5 is an rRNA m6A methyltransferase and is not responsible for the m6A modification of mRNA. These results were consistent with previously reported results. Then, we report here that METTL5 regulates glycolysis and cell proliferation in HCC through c-Myc. Our results showed that METTL5 enhances glycolysis in HCC cells and reduces mitochondrial OXPHOS by promoting c-Myc expression. Moreover, our investigation of clinical HCC specimens revealed that METTL5 and c-Myc levels were strongly positively associated among HCC samples, indicating that the combination of METTL5 and c-Myc may have genuine predictive value.
In numerous malignancies, c-Myc is highly activated and contributes to the regulation of the cell cycle, cell survival, glucose metabolism, proliferation, and metabolic reprogramming [34, 35]. As a protooncogene and a transcription factor, c-Myc regulates the transcription of more than 80 essential genes, thereby increasing glucose uptake or the expression of genes involved in the glycolytic pathway [36]. According to previous research, METTL5 promotes c-Myc expression in cancer but inhibits c-Myc expression in embryonic development [16, 18]. This contradiction could be due to differences in cell or tissue types. Additionally, the functions of METTL5 in the translation of specific mRNAs might provide additional explanations for the contradictory biological functions. The c-Myc protein is typically unstable with a very short half-life in cells [37, 38]. According to our findings, METTL5 prevented the proteasome-mediated degradation of c-Myc by increasing the translation of USP5. METTL5 rRNA methyltransferase activities are directly required for the translational regulation of USP5.
By controlling ubiquitination levels, USP5 regulates the stability, function, or location of various proteins involved in different cellular processes, such as DNA repair, transcription, epigenetic regulation, immune responses, the cell cycle, and mitosis [39-41]. Our results identified USP5 as a novel deubiquitinating enzyme for c-Myc, providing a potential mechanism governing the fate of c-Myc in HCC. Using a series of truncated USP5 fragments, we found that the C-Box and UBA regions of USP5 bind to the c-Myc protein. Further analyses indicated that USP5 inhibits K48-linked polyubiquitination of c-Myc.
Transcriptional regulation, including transcriptional activation/repression, occurs at the level of the gene promoter and is stringently controlled by stage-specific transcription factors. We aimed to identify the positive transcription factor regulating METTL5 expression in light of the discovery of METTL5 overexpression and its crucial carcinogenic consequences on HCC. Our findings show that CREB1 stimulates the transcription of METTL5, a key transcription factor involved in tumor growth.
Because the Warburg effect is the primary distinguishing feature of cancer cells, addressing the Warburg effect and its signaling cascade is emerging as a possible cancer treatment strategy. The tumor-suppressive activity of METTL5 knockout in PDX models indicated that adenoviral-mediated METTL5 knockout is a promising cancer therapeutic strategy.
This study has some limitations. First, the mechanism of METTL5 stabilized c-Myc might be cell or tissue-dependent and varies under certain circumstances differentiation because different tumors or stem cells have different gene expression levels. It is probable that METTL5 regulates c-Myc expression by several different mechanisms. Thus, further studies are required to obtain a more comprehensive understanding. Second, we utilized AAV vector-based gene therapy to inhibit METTL5 in the PDX model. However, the safety and efficacy of this therapeutic model should be more carefully evaluated before further clinical translation.
5 CONLUSIONS
Our findings provide new light on the cell-intrinsic effect of METTL5 overexpression on HCC, implying that, in addition to its well-known role in RNA methylation, METTL5 regulated the proliferation and migration of HCC cells via numerous pro-oncogenic USP5-c-Myc signaling cascades. Our findings provide novel insights into targets implicated in tumor metabolism and open the door for the future development of new treatment methods for HCC.
DECLARATIONS
AUTHOR CONTRIBUTIONS
Zhonglin Zhang and Yufeng Yuan conceived and designed the experiments. Hao Zhang, Haofeng Lu, Kequan Xu, and Xiang Jiang collected the clinical samples and patients’ information. Xiangdong Gongye and Jie Liu conducted the database searches and bioinformatics analysis. Yuke Jiang, Zhang Chen, Xi Chen, Weijie Ma, and Peng Xia performed the experiments. Peng Xia wrote the paper. Weijie Ma, Yuke Jiang, and Zhonglin Zhang participated in the revision of the draft. All authors read and approved the final paper.
ACKNOWLEDGEMENTS
We thank Pan Liu (Zhengzhou University, Zhengzhou, Henan, China) for supplying plasmids and Ming Tian (Wuhan University,Wuhan, Hubei, China) for providing comments on the manuscript.
COMPETING INTERESTS
The authors declare that they have no competing interests.
AVAILABILITY OF DATA AND MATERIALS
The data that support the findings of this study are available from the corresponding author upon reasonable request. The complete RNA-seq data were uploaded to the Gene Expression Omnibus (GSE203329, http://www.ncbi.nlm.nih.gov/geo).
ETHICS APPROVAL AND CONSENT TO PARTICIPATE
This study was approved by the Ethics Committee of Zhongnan Hospital of Wuhan University (permit number: KELUN2017082 and KELUN2020100). The tissue samples were obtained with written informed consent from each patient. All animal experiments were approved in accordance with the guidelines of the Animal Ethics and Welfare Committee of Wuhan University of Zhongnan Hospital (permit number: ZN2022005).
CONSENT FOR PUBLICATION
Not applicable.


