Role of Surface Terminations for Charge Storage of Ti3C2Tx MXene Electrodes in Aqueous Acidic Electrolyte
Graphical Abstract
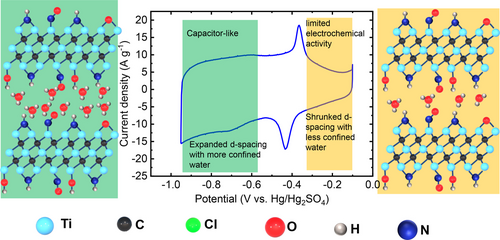
A transition from electrochemically inactive Cl-terminated Ti3C2 to fast, pseudocapacitive behavior is reported for N,O-terminated Ti3C2 MXene, attributed to the presence of confined water between the MXene layers. This study evidences the crucial role surface terminations and confined water in charge storage and reaction kinetics in MXene materials.
Abstract
In this study, we used 2-Dimmensionnal Ti3C2 MXene as model materials to understand how the surface groups affect their electrochemical performance. By adjusting the nature of the surface terminations (Cl-, N/O-, and O-) of Ti3C2 MXene through a molten salt approach, we could change the spacing between MXene layers and the level of water confinement, resulting in significant modifications of the electrochemical performance in acidic electrolyte. Using a combination of techniques including in-operando X-ray diffraction and electrochemical quartz crystal microbalance (EQCM) techniques, we found that the presence of confined water results in a drastic transition from an almost electrochemically inactive behavior for Cl-terminated Ti3C2 to an ideally fast pseudocapacitive signature for N,O-terminated Ti3C2 MXene. This experimental work not only demonstrates the strong connection between surface terminations and confined water but also reveals the importance of confined water on the charge storage mechanism and the reaction kinetics in MXene.
1 Introduction
Over the last decade, motivated by the urgent need for efficient electrochemical energy storage (EES) devices in the electric vehicle market, Li-ion battery technologies have been receiving increased attention due to their high energy density (~300 Wh kg−1).1a However, their slow charging rate (hours) due to diffusion-limited redox reactions is still a major bottleneck. To achieve simultaneous high power and high energy density, great efforts have been devoted to developing high-power materials, which store charges through fast, reversible redox reactions, enabling them to overcome the diffusion limitations of batteries and the capacity limitation of electrical double-layer capacitors.2
2D materials containing molecular layers of water in their structure are often reported to show rapid kinetics of ion transport for electrochemical energy storage applications (EES).3 For instance, layered materials containing structural water including RuO2,4 MnO2,5 V2O5,6 WO37 have evidenced fast proton transport in acidic or neutral electrolytes via confined water between the layers, resulting in enhanced electrochemical kinetics.3 For example, Augustyn et al. highlighted the critical role of confined interlayer water in enabling highly reversible, subsecond electrochemical proton intercalation in WO3 ⋅ nH2O.8 Additionally, they also reported that nanoconfined structural water mediates the interaction of the intercalated cation with the MnO2 layers, leading to ion intercalation that exhibits minimal potential dependence and structural change.5 Although these studies shed light on the key importance of structural and confined water on the redox kinetics, they did not consider the role of the surface chemistry of 2D materials, which, along with their structure and texture, can impact their electrochemical performance. In this paper, we used MXenes, a family of two-dimensional (2D) transition metal carbides or carbonitrides that have been intensively studied for energy storage applications,1b, 9 as model materials to study the role of the surface terminations on their electrochemical performance.
Surface terminations present on MXene surfaces have been reported to significantly influence their electrochemical performance,10 but the underlying mechanism is still elusive. For example, Li et al.11 reported the −Br- and −I-containing Ti3C2 MXenes exhibit distinct discharge platforms with considerable capacities in aqueous Zn-ion batteries. Liu et al.12 reported the introduction of the O surface group activates the pseudocapacitive redox reaction of Cl-terminated Ti2C MXene in the non-aqueous electrolyte. Br-terminated Ti3C2 MXene prepared from bromination of HF-MXene could achieve twice the capacity vs pristine F-terminated MXene during Li+ intercalation from non-aqueous electrolyte.13 Differently, R. Cheng et al. have shown that the ammonization treatment of HF−Ti3C2 MXene resulted in increased interlayer spacing and poor electrochemical behavior vs Li-ion intercalation in non-aqueous electrolyte compared to pristine HF-MXene.14 Moreover, it is well-established that surface terminations largely depend on the synthesis route and post-synthesis treatment.15 Over the past decades, aqueous solutions containing fluoride ions (HF,16 LiF+HCl9b) have remained the mainstream etching electrolyte for the parental MAX phase (noted HF-MXenes), this is why all the charge storage mechanism studies of MXene have been based on HF-MXenes,10 with surface functional groups limited to −F, −OH and −O, making it difficult to understand the influence of surface chemistry on the charge storage mechanism. In 2020, a molten salt etching synthetic route was proposed to enrich the variety of MXene surface functional groups, leading to a potentially unlimited number of MXene (MS-MXene) materials with distinct properties.15 Yamada et al.17 demonstrated that various halogen-terminated MS-MXene prepared using this molten salt route exhibit only poor electrochemical performance in aqueous electrolytes. While our recent research demonstrated a significant enhancement in electrochemical performance in aqueous electrolytes by modifying the surface termination of MS-MXene from Cl- to (N- and O-),18 it has raised several pivotal questions regarding the influence of surface chemistry (N- vs Cl-terminated MXenes) on MXene's electrochemical kinetics and charge storage mechanism. The current study aims to delve deeper into unraveling the causes behind this notable shift in electrochemical performance, how surface chemistry affects the electrochemical performance through confined water and gaining a comprehensive understanding of the associated mechanisms.
In this study, Cl-, N-, and O- terminated Ti3C2Tx MXene were prepared, and their electrochemical performances were measured in aqueous electrolytes to understand the effect of surface chemistry, and the role of the presence of confined water on MXenes’ charge storage properties. Although several modeling studies suggested that confined water and surface terminations play a key role in their electrochemical behavior,10, 19 the underlying mechanism is still elusive and lacks experimental confirmation. To address this gap, we employed a combination of electrochemical quartz crystal microbalance (EQCM) with in-operando XRD techniques to clarify the charge storage mechanism of N- and O-terminated Ti3C2Tx, which unravels the influence of surface chemistry on confined water and proves the importance of confined water on the electrochemical performance and charge storage mechanism of MXene. Beyond that, it offers new paths, based on the control of the surface chemistry, for developing the next generation of (2D) materials for energy storage devices operating in aqueous electrolytes.
2 Results and Discussion
2.1 Synthesis of MS-MXene with Various Surface Terminations
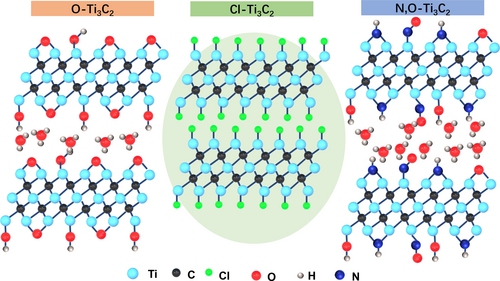
Schematic illustration of MS−Ti3C2Tx with various surface terminations. Ti3AlC2 MAX is immersed in NaCl+KCl molten salt containing the Lewis acidic FeCl2. The redox coupling reaction between Ti3AlC2 and dissolved FeCl2 leads to the formation of Cl−Ti3C2 MXene and Fe, such as reported in our previous work.18 After a physical magnet cleaning treatment, the pure Cl−Ti3C2 is annealed together with Li2O or/and Li3N to prepare O−Ti3C2, and N,O−Ti3C2.
2.2 Material Characterization of Ti3C2Tx
The annealing treatment in Li3N-containing molten salt electrolyte (equations 3 and 3’) induces a shift of the (002) peak from 2θ 8.0° to 7.0° (Figure 2a, blue plot), supporting an increase of the d-spacing from 11.0 to 12.5 Å; this result is another evidence that tuning the surface group is an effective route to control the interlayer distance of MXene, such as reported by Li et al. with the preparation of binary halogen terminated Ti3C2(ClBr) exhibiting a c-lattice parameter larger than individual Ti3C2Cl2 and Ti3C2Br2 MXene.11 In a previous work,18 we have shown that a Li3N annealing treatment resulted in the presence of N- and O-terminated MXene (termed as N,O−Ti3C2), as elemental analysis resulted in a composition of Ti3C1.95N0.80O1.11H0.46. In our previous work,18 N2 adsorption–desorption analysis has been conducted on both Cl−Ti3C2 and N,O−Ti3C2 to investigate changes in their specific surface area, porous volume, and pore size distribution. The results indicate that both samples exhibit similar specific surface areas (21.0 and 21.3 m2 g−1, respectively for Cl−Ti3C2 and N,O−Ti3C2) and total porous volume (0.065 and 0.071 cm3 g−1). This reveals that the improvement in electrochemical performance of N,O−Ti3C2 is mainly attributed to the modification of surface group instead of the increase of the surface area and porosity.
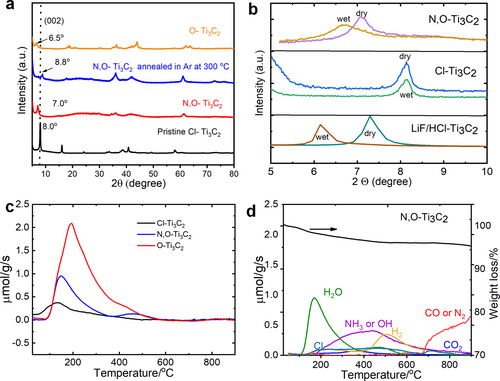
Material characterization of Ti3C2Tx with various surface terminations. (a) XRD patterns of Cl−Ti3C2 (black line), N,O−Ti3C2 (red line), N,O−Ti3C2 after annealing at 300 °C (blue line) and O−Ti3C2 (orange line). (b) XRD patterns of Cl−Ti3C2, N,O−Ti3C2 and LiF/HCl- Ti3C2 before and after immersion in 3 M H2SO4 for 2 h. (c) H2O evolution of Cl−Ti3C2, N,O−Ti3C2 and O−Ti3C2: the structured water is different depending on the surface terminations. (d) TPD-MS measurements at temperature range up to 900 °C of N,O−Ti3C2.
While the nitrogen groups come from the molten salt, O-containing terminations could originate from different sources: from initial Ti3AlC2 MAX21 but also from Li3N and LiCl partial reaction with moisture to form LiOH (see Figure S1), during the short exposure to air. In addition, for a better comparison of the elemental composition, O−Ti3C2 sample analysis has been performed by ICP technique and organic elemental analysis (for C, H, N, O, and S contents) (Table S2), revealing a composition of Ti3C1.34O3.25H0.12.
To further evidence the presence of O-containing surface groups, additional experiments were made to compare the spontaneous intercalation of water molecular behavior of LiF/HCl−Ti3C2, Cl−Ti3C2 and N,O−Ti3C2 and the results are shown in Figure 2b. LiF/HCl-MXene is well-known to be hydrophilic; it can incorporate additional structural water upon immersion in aqueous electrolyte for the stabilization of the structure and compensation of the surface charge for their ionic structural units.22 This is shown in Figure 2b, where a shift of the (002) peak to lower angle is observed for LiF/HCl−Ti3C2, after immersion in 3 M H2SO4 for 2 h, following H2O intercalation.23 A similar low angle shift of the (002) peak position was also observed for N,O−Ti3C2, suggesting a similar process. In contrast, Cl−Ti3C2 retains the same d-spacing suggesting spontaneous intercalation of water molecules does not occur, which might be due to the lack of hydrophilic terminations.23b However, Figure S2 shows that O−Ti3C2 maintains a similar d-spacing, likely due to its already sufficient expanded d-spacing achieved during the washing process.
In addition, a N,O−Ti3C2 sample was annealed under Ar atmosphere at 300 °C for 10 mins. As a result, the (002) peak shifted from 7.0 to 8.8° (Figure 2a, purple plot). This could be explained by the dehydration and the loss of pre-intercalated H2O during annealing, in agreement with Seredych et al24 who showed the release of entrapped structural water in LiF/HCl−Ti3C2 MXene at temperature of ∼320 °C after performing thermal treatment on MXene. Cl−Ti3C2 has also been annealed in Li2O-containing molten salt electrolyte, to exchange Cl and O atoms (equation 2): a shift of the (002) diffraction peak from 2θ 8.0° to 6.5° is then observed after annealing (see Figure 2a, red plot), which translated to an expansion of the interlayer distance from 11.0 to 13.5 Å. This suggests that the creation of O-terminations can induce the spontaneous intercalation of confined water adsorption and then the expansion of d-spacing. To support these assumptions, water contact angle (WCA) measurements (Figure S3) were further performed on the various MXene pellets, to stress out whether or not surface terminations are hydrophilic. The observed WCA values of 76°, 48°, and 37° for the Cl−Ti3C2, N,O−Ti3C2, and O−Ti3C2 samples, respectively, demonstrate a corresponding increase in hydrophilicity, consistent with the higher content of oxygen-containing polar groups.25
To get further insights into the surface chemistry, temperature-programmed desorption coupled with mass spectroscopy (TPD-MS) has been performed on the Cl−Ti3C2 (black line), N,O−Ti3C2 (orange line), O−Ti3C2 (red line) MXene samples. As shown in Figure 2c, the H2O evolution is different depending on the functionalization of the surface. Specifically, O−Ti3C2 has a higher content of confined H2O, which supports our speculation that the amount of confined water increases with an increase in O-containing surface terminations, and the presence of the confined H2O molecules is mainly controlled by the O surface termination groups. Differently, Cl−Ti3C2 MXene has the lowest content of water. Those results are in good agreement with the above XRD and water contact angle measurements. Moreover, the N,O−Ti3C2 exhibits another small water-loss peak above 400 °C. As reported by Seredych et al.,24 the water loss peak below 400 °C can be attributed to the multilayer water (weak water–water interaction) while the water loss peak above 400 °C can be associated with monolayer water bound to −NH3 and −OH groups (strong water–surface interaction). However, the water can be almost fully removed at 300 °C, which supports the conclusion that the shrunken d-spacing, as observed in Figure 2a, is associated with the removal of H2O.
Figure S4, Figure S5 and Figure 2d show the decomposition of the surface terminations present on the Cl−Ti3C2, O−Ti3C2 and N,O−Ti3C2 MXene surface. Cl−Ti3C2 only shows a release of Cl gas over the whole temperature range, with the main release of H2 gas occurring around 200 °C while O−Ti3C2 shows the presence of H2 and Cl gas. In contrast, N,O−Ti3C2 exhibits a new substantial weight loss peak centered at around 400 °C, corresponding to −NH3 or −OH groups, which is combined with a large H2 release centered at around 500 °C. Although it is difficult to quantify −NH3 or −OH due to the lack of standards, it seems more reliable that the peak is related to −NH3 since the HF-MXene26 with a large amount of −OH does not show as much H2 release in the 400–600 °C. It is reported that the release of H2 gas usually occurs in two different temperature ranges: molecular hydrogen trapped between MXene sheets in the 140–410 °C while a combination of −OH terminations at the 430–700 °C.24 Therefore, it's a mainly slow dissociation of the −NH3 group at the 200–600 °C, followed by a release of H2 gas at the 400–600 °C due to the combination of −NH3 groups.
A change in the MXene surface chemistry was also confirmed from zeta potential measurements in deionized water (pH=7). As shown in Figure S6, Cl−Ti3C2 has a positive zeta potential of ~+50 mV, whereas the zeta potential turns to negative values after surface termination exchange, with values of −40 and −48 mV for O−Ti3C2 and N,O−Ti3C2, respectively. This supports a significant change in the surface charge along with the termination groups and may result from the spontaneous chemisorption of cations on the MXene surface after immersion in the electrolyte.
A 2-probe resistance measurement set-up was used to measure the electric conductivity of MXene pellets with different surface terminations, as density functional theory27 calculations have shown that surface terminations affect MXenes′ density of states and thereby their electronic conductivity. As shown in Figure S7, the electronic conductivities are 69.1 and 62.4 S m−1 for the Cl−Ti3C2 and N,O−Ti3C2, respectively, while O−Ti3C2 exhibits a very low electronic conductivity of about 0.2 S m−1. This is consistent with the report by Mitra et al., showing that the O-terminated HF-MXene exhibits the lowest conductivity compared to those with F and OH.27
Overall, MXene with various surface terminations shows different properties regarding water confinement, electric conductivity, wettability, thermal stability, and even the surface charge.
2.3 Charge Storage Mechanism
The electrochemical performance of Cl−Ti3C2, N,O−Ti3C2, and O−Ti3C2 MXenes were evaluated in H2SO4 to understand the impact of surface terminations on the electrochemical behavior of MXene electrodes. Figure 3a shows that Cl−Ti3C2 has limited electrochemical activities, centered around a pair of redox peaks located at −0.58/−0.69 V vs. Hg/Hg2SO4. Such limited electrochemical activity could be explained by the lack of O-containing surface groups (see Figure S3 and Figure 2d), resulting in a hydrophobic surface.25 In contrast, as we recently showed,18 as-synthesized N,O−Ti3C2 shows a drastic change in its electrochemical signature, showing a mirror-like CV with a capacitive rectangular box profile, together with one pair of sharp redox peaks located at −0.35/−0.43 V vs. Hg/Hg2SO4. Such an improvement in the electrochemical performance could be explained by the expanded d-spacing due to the presence of confined water between the MXene layers, thanks to the introduction of N-terminations. In addition, various surface terminations in materials affect electronic states around the Fermi energy, as indicated by DFT calculations, resulting in changes to the electronic structure of MXene layers and influencing the overall electronic properties of the material.28 To support the role of confined water on the electrochemical performance, N,O−Ti3C2 sample was annealed at 300 °C in Ar to remove confined water. As shown in Figure 3b, the electrochemical activity of the annealed N,O−Ti3C2 was greatly reduced, indicating the key role of confined water on the electrochemical performance in H2SO4 electrolyte, which well agrees with previous simulation studies.26, 29
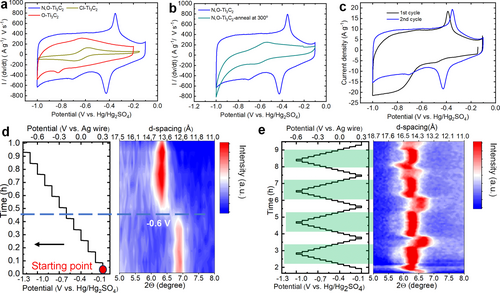
Electrochemical characterization and in operando X-Ray diffraction study. The electrode weight loading was kept similar for all measurements at about 1 mg.cm−2. Comparison of the Cyclic voltammetry data recorded at a potential scan rate of 20 mV s−1 of (a) Cl−Ti3C2, N,O−Ti3C2, O−Ti3C2; (b) N,O−Ti3C2 before (blue line) and after (green line) annealed at 300 °C under Ar atmosphere. Electrochemical characterization and in operando X-Ray diffraction study on N,O−Ti3C2: (c) Cyclic voltammetry (CV) of the first cycle and following reversible cycle at 50 mV s−1. In situ XRD maps of the (002) peak during chronoamperometry scans with stepped potential as a function of time of the (d) initial discharge and (e) consequent four reversible cycles.
As suggested in the XRD and TPD-MS results, O−Ti3C2 has a large d-spacing and a large amount of confined water. However, as shown in Figure 3a, the electrochemical performance of the O−Ti3C2 sample was found to be modest, in line with the very low conductivity of such material, with the presence of one pair of redox peaks at −0.55 and −0.68 V vs Hg/Hg2SO4, due to the presence of TiO2 as a result of the surface oxidation of Ti, as already reported.30 A similar set of redox peaks at −0.55/−0.66 V vs. Hg/Hg2SO4 observed for the N,O−Ti3C2 sample (Figure 3a) can then be assigned to the presence of O-containing surface groups. The other pair of redox peaks centered at −0.35/−0.43 V vs. Hg/Hg2SO4 is assumed to be associated with the contribution of N surface groups due to its absence in O−Ti3C2 and LiF/HCl prepared Ti3C2Tx. These findings evidence that the N-based functional group, −NHx, as revealed in Figure 2d, FTIR and CHNO elemental analysis from our previous work,18 plays a key role in boosting the electrochemical performance. The −NHx group polarity improves electrode wettability, facilitating surface redox charge transfer.31 As an active site, it aids electrochemical reactions and stabilizes the electrode structure through hydrogen bonding. Additionally, it modulates the material‘s electronic structure and offers a buffering effect in the acidic environment.31a Overall, the −NHx group optimizes ion transport, stability, and electrochemical activity in acidic conditions. Furthermore, the combination of N- and O-containing surface groups in MXenes acts in concert to offer highly accessible redox-active surface to electrolyte ions, possibly due to the presence of confined water, resulting in improved electrochemical performance in aqueous electrolyte.
Figure S9 shows the electrochemical impedance spectroscopy (EIS) measurements for N,O−Ti3C2, O−Ti3C2, and Cl−Ti3C2 electrodes at OCV. All the Nyquist plots show similar features with a high-frequency semicircle, possibly attributed to the small charge transfer resistance of the fast pseudocapacitive redox process—which turns out to be higher for O−Ti3C2, as it is more resistive—followed by a fast increase of the imaginary part of the impedance at low-frequencies. In the low-frequency region, the sharp (almost vertical) rise of the imaginary part of the impedance indicates a capacitive-like, non-diffusion limited behavior for both N,O−Ti3C2 and O−Ti3C2 electrodes. The smaller slope obtained for the pristine Cl−Ti3C2 electrode suggests ion transport limitation in agreement with the CV (Figure 3a). Figure S10 shows the Nyquist plots of N,O−Ti3C2, at different bias potentials. In the electroactive domain, that is in the −1.0 V/Ref to −0.15 V vs Ref/, the electrochemical behavior is in agreement with a (pseudo)capacitive behavior as can be seen from the increase of the imaginary part of the impedance at low frequencies. At −1 V Vs Ref, the Nyquist plot shows a charge transfer process, ascribed to the electrolyte decomposition as a result of the low cathodic overpotential (water reduction). Staircase potential electrochemical impedance spectroscopy (SPEIS) measurements were also performed for the N,O−Ti3C2 electrode polarized at various potentials to differentiate double-layer (see Figure S11), pseudocapacitance, and battery-like mechanisms. The electrode is held for 10 min at each potential (25 mV step). Phase is color plotted vs f and V: the high phase (absolute value) in red indicates more capacitive behavior. As shown in Figure S11, a (pseudo)capacitive behavior is visible over a large electrochemical potential window.
Interestingly, during the 1st discharge in 3 M H2SO4 electrolyte (Figure 3c), N,O−Ti3C2 sample does not show the reduction peak at −0.43 V vs. Hg/Hg2SO4; instead, a sudden cathodic current increase is visible from −0.60 V vs. Hg/Hg2SO4. The subsequent first anodic scan shows an oxidation peak at −0.35 V vs. Hg/Hg2SO4 and the following cycles show the expected set of reversible redox peaks at −0.35/−0.43 V vs. Hg/Hg2SO4. These results suggest that electrochemical activation occurs during the first cycle.
2.3.1 In situ XRD
Operando XRD study was performed on N,O−Ti3C2 after immersion in 3 M H2SO4 electrolyte for 2 h to track the change of the (002) peak position during polarization—corresponding to half of the c parameter. Chronoamperometry experiments were achieved with potential steps of 0.1 V, within the full potential range from −0.1 V to −1.0 V vs. Hg/Hg2SO4. During the 1st discharge, as shown in Figure 3d, the d-spacing remains constant when scanning from −0.1 V to −0.6 V vs. Hg/Hg2SO4; then, a sharp increase from 12.8 to 14.0 Å occurs at −0.6 V vs. Hg/Hg2SO4, which matches well with the rapid increase of the current density at −0.6 V vs. Hg/Hg2SO4 (Figure 3a). The expansion of the d-spacing of 1.2 Å could be associated with the intercalation of solvated protons26 (the radius of an H+ is 0.37 Å and 1.0 Å for H3O+, respectively), but excludes the possibility of intercalation of large SO42− since the radius of a sulfate ion is 2.42 Å.32 Moreover, to gain further insight into the cation contribution, the N,O−Ti3C2 sample was also tested in other SO42− based aqueous electrolytes, including 2 M Li2SO4 and 2 M MgSO4. The N,O−Ti3C2 in Li2SO4 and MgSO4 (Figure S12) shows double-layer charge storage, as indicated by an almost identical rectangle CV shape without any redox peaks, while the capacitance gets largely decreased. Such findings make it more evident the charge mechanism is highly likely driven by the cations, and thus SO42− anions are not involved in the reaction process.26
The d-spacing remains constantly expanded from −0.6 V to −1.0 V vs. Hg/Hg2SO4, suggesting that the electrochemical capacitive ‘activation’ is associated with the intercalation of water molecules in the confined interlayer spacing, as suggested by previous modeling results.33 After pre-cycling, the contour map of in situ XRD patterns in Figure 3e shows reversible interlayer “breathing” over the consequent four cycles with roughly similar d-spacing change. It is worth noting the abrupt shrinkage and expansion of the d-spacing both occur at the onset potentials of the anodic and cathodic peaks in the CVs, respectively. As shown in Figure 3e, the d-spacing remains constant at 14.0 Å during cathodic scan from −0.5 to −1.0 V vs. Hg/Hg2SO4 until the electrode was cycled back to −0.40 V vs. Hg/Hg2SO4—the onset potential of the anodic peak, an abrupt of d-spacing shrinkage from 14.0 to 13.1 Å is observed, supporting the extraction (respectively, insertion) of proton together with water molecules during oxidation (respectively, reduction). During reduction, at the onset potential of the cathodic peak (−0.35 V vs. Hg/Hg2SO4), the interlayer spacing suddenly jumps from 13.3 to 14.0 Å, which explains the significantly increased current density is due to the intercalation of sufficient water molecules together with the proton, emphasizing the key role of confined water for excellent performances. Interestingly, the maximum change of the d-spacing is 1.2 Å (from 12.8 to 14.0 Å) during the 1st discharge (reduction), which is larger than the d-spacing change of 0.9 Å (from 13.1 to 14.0 Å) observed during the following reversible discharge, indicating some water molecules remain trapped inside the layers after 1st discharge and further facilitate the (de)intercalation of ions.
2.3.2 EQCM
The EQCM technique was further used in the gravimetric mode to get access to the ionic and molecular species’ fluxes upon the reduction-oxidation of N,O−Ti3C2 MXene coated on a quartz crystal resonator used as a working electrode during polarization in a 3 M H2SO4 electrolyte. Figure 4 shows the CV profile (black lines) recorded at 50 mV ⋅ s−1 over the first cycle and the stable, reproducible electrochemical signature of the following 10th cycle (Figure 4b). In this plot, the blue lines correspond to the associated frequency response; the open circuit potential (OCP) indicated by the red dots is taken as the origin of the charge (Q=0). Both Figures show a frequency increase during the anodic scan and the other way around for the negative cathodic sweep, as indicated by the arrows. Similar to the previous CV curve test in Swagelok (Figure 3c), the first cycle in Figure 4a does not show any cathodic reduction peak but a sharp increase in the current density below −0.60 V vs. Hg/Hg2SO4 is observed during the first discharge while a small oxidation peak at −0.32 V vs. Hg/Hg2SO4 shows up upon the reverse sweep. In contrast, Figure 4b shows a capacitive rectangular box profile together with a pair of redox peaks at −0.35/−0.43 V vs. Hg/Hg2SO4 after pre-cycling. Figure S13 shows that the sharp redox peaks located at −0.35/−0.43 V vs. Hg/Hg2SO4 got activated during the cathodic scan below −0.80 V vs. Hg/Hg2SO4. This finding is consistent with the previous in situ XRD result showing the abrupt d-spacing expansion at −0.60 V vs. Hg/Hg2SO4 over the first discharge in Figure 3d, suggesting the intercalation of water needed to activate the redox peak at −0.35/−0.43 V vs. Hg/Hg2SO4.
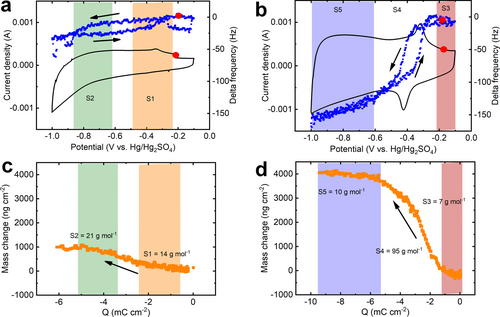
EQCM study of the N,O−Ti3C2 in 3 M H2SO4. CV profile and EQCM frequency response at 50 mV s−1 during (a) the first cycle and (b) the 10th reversible cycle. Electrode mass change versus charge during (c) the first discharge and (d) the 10th reversible discharge.
where ▵m (g cm−2) is the mass change of the coated quartz, Cf is the sensitivity factor of the crystal (g cm−2 Hz−1) and ▵f is the quartz resonance frequency (Hz). In this study, the Cf was calculated to be 24.0 ng ⋅ cm−2 ⋅ Hz−1.
Figure 4c and d show the change of the electrode weight vs. the charge passed in the electrode over the reduction process during the first discharge and following stable discharge, where the arrows indicate the scan directions. In Figure 4c, the mass increases slowly during the reduction, which is in line with a counter-ion mechanism: the negative charge in the electrode is balanced by cation intercalation. The shaded areas in Figure 4c represent the two different potential regions (S1 and S2) during the 1st reduction process as described in Figure 4a. According to Faraday's law, the average molecular weight per charge from the two potential regions (21 g ⋅ mol−1 in the purple region and 14 g ⋅ mol−1 in the orange region) is calculated to be about 18 g ⋅ mol−1, suggesting the insertion of about one H2O per H+ (H3O+).
As shown in Figure 4b and Figure S15a, the starting and ending points of the frequency and mass loops overlap, implying the electrode is under steady-state conditions, after the first cycle corresponding to an electrochemical activation, the reaction process is quite reversible. Firstly, on average, the frequency decreases during the MXene reduction which is in line with a counter-ion charge compensation (cations). Then, three electrochemical stages (S3–S5) were identified during the negative sweep, according to the different observed slopes (Figure 4d): (S3) Between −0.1 and −0.3 V vs. Hg/Hg2SO4, the average molar weight m/z estimated from a noisy signal is low <5 g ⋅ mol−1, supporting the insertion of mostly desolvated protons, which is consistent with the small d-spacing observed in Figure 3e and explains the low current density due to the lack of confined water. Below −0.35 V vs. Hg/Hg2SO4 in the (S4) region—the onset potential of the cathodic peak—a large increase in the m/z value (95 g ⋅ mol−1) is observed, corresponding to an intercalation of 5.0 H2O per H+. Such a large amount of water intercalation is very consistent with the abrupt expansion of the d-spacing previously observed in in situ XRD (Figure 3e). For potentials below −0.6 V vs. Hg/Hg2SO4, in the region (5), the solvation number of protons drops down, with 0.52 H2O interacted per H+. This process is reversible as, during the anodic scan, the weight decrease at the onset potential of the anodic peak follows the path of the cathodic process (Figure S16b), with the de-intercalation of about 5.3 H2O interacted per H+. Those results well agree with the abrupt contraction of d-spacing at the anodic oxidation peak region as observed in the previous in situ XRD result.
Figure 5 summarizes the results obtained. The shaded yellow area at high potentials shows a limited electrochemical activity of N,O−Ti3C2 MXene, associated with a shrunken d-spacing due to the lack of confined water. In contrast, the shaded green area in Figure 5 with improved electrochemical performance corresponds to N,O−Ti3C2 MXene with expanded d-spacing. Both the drastic jump/drop of the mass from EQCM and abrupt d-spacing changes from in situ XRD measurements support the evidence of (de)intercalation of solvated protons associated with a large amount (about 5) of water molecules starting from the sharp redox peak at −0.35/−0.43 V vs. Hg/Hg2SO4. These results reveal the importance of the presence of intercalated confined water molecules between the MXene layers, where fast access to the interlayer allows for rapid surface redox involving proton intercalation and a fast proton transfer process.
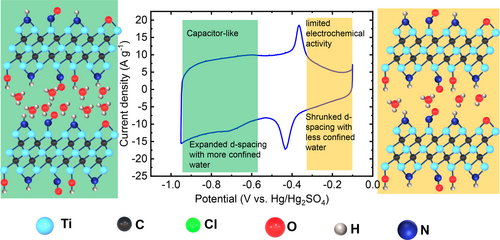
Schematic illustrating the transition from limited electrochemical behavior to a fast, capacitive-like charge storage mechanism in N,O−Ti3C2 in 3 M H2SO4. The presence of confined water between the MXene layers drives the transition.
The set of results reported here also experimentally confirms the key role of the presence of confined water in improving the reaction kinetics. Beyond MXene materials, it offers an efficient strategy, based on the incorporation of structural water inside layered materials by tuning the surface chemistry, for developing the next generation of high-power electrochemical energy-storage devices (EES) operating in aqueous-based electrolytes.
3 Conclusion
To underscore the pivotal role of functionalization, we transitioned the hydrophobic MS-MXene (Cl−Ti3C2) to a hydrophilic state (O−Ti3C2 and N,O−Ti3C2) and, crucially, the selection of nitrogen as a specific functional group initiated distinct interactions with protons and confined water. This enabled water intercalation, as evidenced by electrochemical quartz crystal microbalance combined with operando X-ray diffraction measurements, subsequently enhancing proton adsorption kinetics. Consequently, we observed a significant enhancement in MXenes’ performance. Our findings unequivocally highlight the profound relationship between the material's (MXenes) surface termination groups and their electrochemical attributes. It is proposed that the charge storage process is dominated by the intercalation of solvated proton and needs the presence of nanoconfined interlayer structural water. This work helps to understand how the interactions of surface terminations and nanoconfined water contribute to the high-power performance of MXene in acidic electrolytes and, offers new research paths to improve the performance of 2D materials (carbide, oxides, transition metal dichalcogenides …) operating in aqueous electrolyte.
Author Contributions
L. L., P. L. T., and P. S. proposed the concept, designed the experiments, and co-wrote the manuscript. L. L. performed the synthesis, material characterization, and electrochemical evaluation. E. R. performed the TPD-MS test.
Acknowledgments
L. L. was supported by ERC Synergy Grant MoMa-Stor#951513. P. S. and P. L. T. acknowledge the support from Agence Nationale de la Recherche (Labex Store-ex) and ERC Synergy Grant MoMa-Stor #951513. A CC-BY public copyright license has been applied by the authors to the present document and will be applied to all subsequent versions up to the Author Accepted Manuscript arising from this submission, in accordance with the grant's open access conditions.
Conflict of interests
The authors declare no conflict of interest.
Open Research
Data Availability Statement
The data that support the findings of this study are available from the corresponding author upon reasonable request.


