On the Role of Symmetry in Vibrational Strong Coupling: The Case of Charge-Transfer Complexation
Abstract
It is well known that symmetry plays a key role in chemical reactivity. Here we explore its role in vibrational strong coupling (VSC) for a charge-transfer (CT) complexation reaction. By studying the trimethylated-benzene–I2 CT complex, we find that VSC induces large changes in the equilibrium constant KDA of the CT complex, reflecting modifications in the ΔG° value of the reaction. Furthermore, by tuning the microfluidic cavity modes to the different IR vibrations of the trimethylated benzene, ΔG° either increases or decreases depending only on the symmetry of the normal mode that is coupled. This result reveals the critical role of symmetry in VSC and, in turn, provides an explanation for why the magnitude of chemical changes induced by VSC are much greater than the Rabi splitting, that is, the energy perturbation caused by VSC. These findings further confirm that VSC is powerful and versatile tool for the molecular sciences.
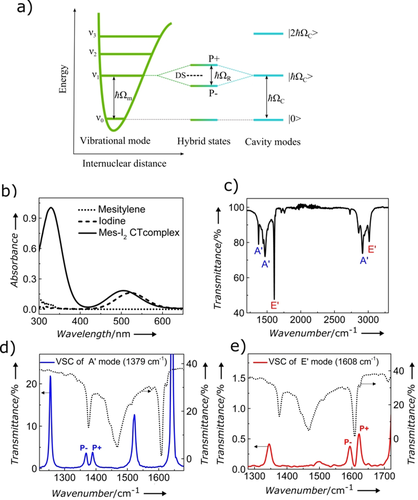
Molecular vibrations play a critical role in various chemical processes such as reactions, electron transfer, and charge transport, and much effort has been directed towards analyzing their effects, in particular by laser excitation of selected modes to influence the outcome.1-7 Nevertheless, such a technique is often limited by intramolecular vibrational-energy redistribution (IVR) in the sample, requiring cryogenic temperatures. An alternative approach is to use vibrational strong coupling (VSC), whereby a vibrational transition of a molecule is hybridized with the zero-point energy fluctuations of a cavity mode, that is, in the absence of any light source. This has been shown to strongly impact chemical reactivity8-13 and has the advantage that it occurs in the dark and, therefore, is not affected by IVR. VSC results in the formation of two so-called vibropolaritonic states, P+ and P−, separated in energy by the Rabi splitting ħΩR as illustrated in Figure 1 a.14 Depending on the reaction under consideration, reactivity has been found to either slow down or be catalyzed by VSC.8-13 Furthermore, it is possible to tilt the reactivity landscape to favor one product over another.11 Temperature studies revealed that the thermodynamics of activation, that is, ΔH≠ and ΔS≠, are strongly modified by VSC, sometimes even changing sign, reflecting a profound modification in the reactivity landscape. One of the puzzling elements of VSC is the fact that these thermodynamic changes are typically an order of magnitude larger than the energy perturbation (≤kB T) associated with the Rabi splitting of the coupled vibration. This suggests that VSC must be inducing a fundamental change that leads to the observed modification in chemical reactivity. The most likely candidate is symmetry, which lies at the heart of chemical reactivity, as illustrated, for instance, by correlation diagrams between reactants and products.15, 16

a) Schematic illustration of the strong coupling between a vibrational transition and a resonant Fabry–Perot (FP) cavity mode, leading to the formation of the hybrid vibropolaritonic states P+ and P− separated by the Rabi-splitting energy ħΩR and dark states (DS). b) Absorption spectra of mesitylene, iodide, and their charge-transfer complex. c) IR spectrum of mesitylene with the symmetry of the different vibrational modes. d), e) Example of a FP mode (blue line) splitting into P+ and P− by strongly coupling to an A′ (d) and E′ (e) vibrational mode.
 (2)
(2) , the non-bonding but interacting pair of D and A, and
  , the ionic pair forming a weak covalent bond. The excited state is described in the same terms:
 (3)
(3)It follows from this model that the transition energy between the ground- and excited states is Eif=ID+EA+Δ, where ID is the ionization potential of D, EA the electron affinity of A, and Δ a correction term that includes various effects such as changes in the equilibrium position in the Morse potential, London dispersion forces, and the exchange integral. This charge-transfer transition gives rise to intense bands in the UV spectrum (see, for example, Figure 1 b). Such peaks can be used to monitor their equilibrium [Eq. (1)] and determine KDA as well as the absorption coefficient ϵDA of the complex as explained further down.20 For the purpose of this study, we note that the IR spectrum of mesitylene has a number of vibrational transitions which correspond to normal modes which belong either to the symmetry class E′ or A′ (see Figure 1 c and the Supporting Information).21 These vibrations can be strongly coupled by placing a solution of the sample in a microfluidic Fabry–Perot (FP) cavity and tuning the spacing between the mirrors so that one of the cavity modes is in resonance at normal incidence with the vibration to be coupled (Figure 1 d,e). Under strong-coupling conditions, the original peak splits into two new peaks, which appear in the IR spectrum, reflecting the transitions to P+ and P−. The split peak is not in itself a proof of strong coupling, additionally, the separation of the peaks must be larger than the FWHM (full width at half maximum) of the IR-absorption peak and the cavity mode to achieve strong coupling, as will be illustrated in the next paragraphs. For further explanations about strongly coupled molecules, please see ref. 14.
 (4)
(4)where abs is the absorbance of the CT peak at 330 nm, l is the path length of the cavity and, [I2]0 is the initial iodine concentration.
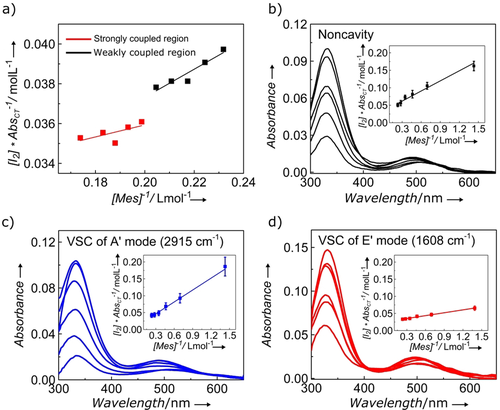
Figure 2 a shows the evolution of the plot according to Eq. (4) upon varying [Mes]0 values inside a cavity tuned to the 3017 cm−1 mode. As can be seen, two regimes can be distinguished with an abrupt discontinuity in between, akin to a phase transition. It was recorded over a small range to illustrate the sharpness of the transition. At low concentrations, the system behaves very much like it does in a normal cuvette, then suddenly upon reaching the strong-coupling condition, that is, the Rabi splitting is larger than the FWHM of the cavity mode and the vibrational band, a new slope is observed giving different values for KDA and ϵDA. Before discussing this observation in more detail, we analyze the effects of VSC of the different vibrational modes of Mes on the CT equilibrium.

a) Benesi–Hildebrand plot revealing the transition from weakly to strongly coupled regimes when the cavity is resonant with the E′ 3017 cm−1 vibration. b) Change in the absorption spectrum of the CT complex as a function of mesitylene concentration with (in the inset) the corresponding Benesi–Hildebrand plot for the out-of-resonance condition. c) The same for an A′ vibration at 2915 cm−1 strongly coupled to a resonant cavity mode. d) The same for an E′ vibration at 1608 cm−1 strongly coupled to a resonant cavity mode. Error bars show standard deviations of three or more experiments.
Figure 2 b–d shows the UV/Vis-spectral changes associated with equilibrium Eq. (1) and the resulting plots according to Eq. (4) for three different situations. For the non-cavity, KDA=0.40 (Figure 2 b), while it decreases fourfold to 0.09 for VSC of the 2915 cm−1 transition (Figure 2 c). In contrast, the complexation constant more than doubles to 1.01 for VSC of the 1608 cm−1 mode (Figure 2 d). Because the spectra are collected in the microfluidic cells with a very small path length (25 um), the changes in absorbances are also small and, additionally, they have to be corrected for background transmission. As a consequence, the spectra are noisy, and the Benesi–Hildebrand plots were averaged over a minimum of three experiments and analyzed at the 330 nm peak. The observed changes in the equilibrium constants are much larger than the ±10 % error in the experiments, as can be seen for the reference values in Table 1.
experiment |
vibrational mode |
K |
ϵDA(330 nm) |
|---|---|---|---|
mesitylene–iodine |
|
|
|
non-cavity[a] |
|
0.40±0.04 |
1.38±0.2 |
non-cavity[b] |
|
0.41±0.02 |
1.44±0.1 |
off-resonance |
|
0.47±0.05 |
1.68±0.2 |
off-resonance (d12)[c] |
|
0.40±0.04 |
1.56±0.2 |
on-resonance |
2915 (A′) |
0.09±0.01 |
3.82±0.4 |
|
1468 (A′) |
0.16±0.02 |
3.63±0.4 |
|
1379 (A′) |
0.15±0.02 |
4.70±0.5 |
|
3017 (E′) |
1.03±0.1 |
1.36±0.2 |
|
1608 (E′) |
1.01±0.1 |
1.52±0.2 |
|
1580 (d12, E′)[d] |
1.20±0.1 |
1.23±0.12 |
|
|
|
|
benzene–iodine |
|
|
|
non-cavity[a] |
|
0.15±0.02 |
0.65±0.05 |
off-resonance |
|
0.15±0.02 |
0.65±0.06 |
on-resonance |
3040 (E1u) |
0.62±0.06 |
0.53±0.05 |
|
1480 (E1u) |
0.65±0.06 |
0.45±0.05 |
- [a] Non-cavity experiment carried out in a 25 μm path-length cell, [b] non-cavity experiment carried out with a 1 mm path-length quartz cuvette, [c] experiment with mesitylene-d12, where the cavity mode was on resonance only with the C−H stretching vibrational mode of heptane at 2915 cm−1, and [d] on-resonance with the E′ vibrational mode of mesitylene-d12.
By further coupling other normal vibrations, it becomes clear that coupling A′ modes lead to large decreases in KDA while E′ modes under VSC lead to increases, as summarized in Table 1. Additionally, it can be seen that the magnitude of change for both symmetries is mostly independent of the frequency of the coupled mode and the type of vibration. We also note that the Benesi–Hildebrand plots are linear over the range of [Mes]0 concentrations used in these experiments. This is remarkable considering the fact that the Rabi splitting is proportional to the square root of [Mes]0,14 indicating again that the VSC-modified values of KDA are only determined over the range of the study by the symmetry once the strong-coupling regime is reached. In other words, at the onset of strong coupling, the symmetry factors responsible for changes to KDA are established and the complexation equilibrium was not impacted further with the increase in the Rabi-splitting energy in the studied range. These findings are further confirmed by the fact that deuterated mesitylene gives very similar results for both uncoupled and coupled conditions (Table 1 and Figure S2 D in the Supporting Information) despite the large isotope-induced shift in the vibrational frequencies. Furthermore, the absence of vibrational modes in the 2500–3200 cm−1 region of deuterated mesitylene (Figure S2 A) allowed us to study the impact of the VSC of the C−H stretching mode of heptane (solvent) on the CT equilibrium. Coupling the solvent vibrations alone did not shift the complexation equilibrium (off-resonance (d12) in Table 1 and Figure S2 D, black line) in the present experiments. We have also checked the case of benzene–I2 complexation under VSC which only has E modes in the accessible wavelength range (Figure S4). It displays the same trend as the E′ modes of the Mes–I2 system (see Table 1 and the Supporting Information).
Another interesting feature of the results summarized in Table 1 lies in the variations in the CT-absorption cross-section ϵDA at 330 nm induced by VSC. Again, symmetry is playing a role, since changes are very large only when coupling the A′ vibrations, with ϵDA increasing by as much as a factor of 3. A possible explanation can be probably be found in the various conformations that the CT complex can take. The conformations of such complexes have been extensively studied and discussed.18, 22 For instance, of all the possible conformers for the benzene–I2 complex, it has been established that the most likely ones are the “oblique” with the I2 axis at an oblique angle above the benzene ring, the “above carbon” and the “above bond” where the I2 is oriented perpendicular to the aromatic plane above a C atom or a C−C bond, respectively. These are also favored on symmetry considerations.18 Furthermore, a detailed theoretical study22 shows that only those three conformers have significant oscillator strengths and, therefore, will contribute to the CT band. At the same time, there are large differences between them. In solution at room temperature, it is reasonable to assume that the Mes–I2 complex fluctuates between such conformations, since the ΔG° of complexation is on the order or less than kB T (Table 2). With this in mind, the increase in ϵDA observed for the Mes–I2 complex under VSC could be explained by the fact the coupling favors a high-oscillator-strength conformer over the others. Interestingly, according to quantum-chemical calculations on the benzene–I2 complex, the oscillator strength of the CT complex increases as the axial I2 position shifts towards the C−C bond of the benzene ring.22 This suggest that the increase in ϵDA for the A′ mode of mesitylene under VSC corresponds to a lowering of the axial symmetry of the Mes–I2 complex, and thereby destabilizes the complex, as observed by KDA.
experiment |
ΔHo |
ΤΔSo |
ΔGo |
|---|---|---|---|
non-cavity |
−19.6 |
−21.8 |
2.2 |
VSC, E′ mode (1608 cm−1) |
−13.4 |
−13.5 |
0.1 |
VSC, A′ mode (2915 cm−1) |
−39.7 |
−45.6 |
5.9 |
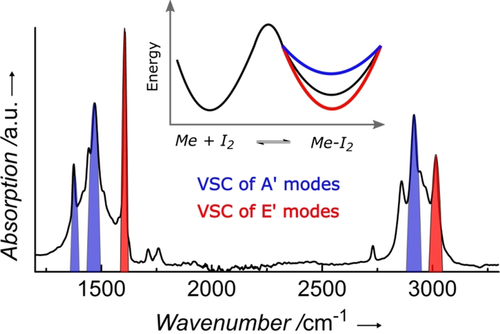
We have analyzed the temperature dependence of the reaction to extract the ΔH° and ΔS° values of the complexation outside the cavity and under VSC for the two symmetries (Figure S3). The results, summarized in Table 2, show that ΔH° and ΔS° change significantly, way beyond the Rabi splittings which are all less than kB T (<2.5 kJ mol−1). While earlier thermodynamic values reported for reactions under VSC only considered the change in the barrier, that is, the activation energy, these changes reflect the relative modification ΔG° of the ground-state energy of the reactants and the products. In other words, it is surprising to see that the ground-state energy can be modified and tilted in both directions simply by splitting the vibrational transition through VSC as illustrated in Figure 3.

IR absorption spectrum of the mesitylene coupled vibrations with their symmetries E′ (red) and A′ (blue), together with the consequences on the CT equilbrium landscape of the mesitylene–I2 complexation process in the inset. The latter shows the shift in the Gibbs free energy of the products vs. the reactants due to vibrational symmetry under VSC with the same colour code. While the activation barrier might also be changed, it was too small to affect equilibrium and could not be observed in these experiments.
As can be seen in Figure 2 a, the onset of strong coupling totally changes the properties of the system as it switches from one set of eigenstates to a new one incorporating the polaritonic states. Thermodynamic data confirms the other findings of this study, namely that the energetic perturbation induced by the Rabi splitting in the ladder of eigenstates cannot account for the changes observed. By selectively coupling vibrational modes, the central role of symmetry in the complexation under VSC is revealed by this study. It is well known that the correlation of symmetry between reactants and products influence the rate and outcome of chemical reactions.15, 16 Additionally, as analyzed by Bader,16 the symmetry of vibrations plays a key role in favoring a reaction pathway over another through the interaction between vibrational and electronic manifolds. VSC must be modifying the symmetries of the correlation diagram of the CT complexation via such vibronic interactions. In this particular case studied here, both reactants and the complex are of A symmetry, as pointed out by Mulliken.18 According to Bader,16 a vibration of the same A symmetry in the reaction landscape will favor the complex. Since E′-symmetry vibrations under VSC favor complexation while A′ vibrations do not, our results point to the fact that the onset of strong coupling leads to a change in the symmetry-correlation diagram. In the end, this is perhaps not so surprising since the molecular transition is hybridized with the electromagnetic field of the cavity to give a polaritonic wavefunction with a node (P−) at the lowest energy level, modifying the orbital interactions and the correlation diagram.
While the influence of polaritonic states on material and chemical properties is now well established, so far, the central focus of the analysis was on the energetics as it was not possible to see the role of symmetry in view of the complexity of the systems studied.8-14, 23-41 With this simple and highly symmetrical CT-complexation reaction, the key role of symmetry in strong coupling has now become very apparent. As shown here, VSC can either favor or destabilize the equilibrium complexation depending on the symmetry of the coupled vibration, suggesting that such perturbations of the symmetry-correlation diagram between reactants and products might be at the origin of the acceleration and inhibition of the reactions studied to date under VSC.8-13 By the capacity to selectively couple specific vibrations, VSC is a unique tool to analyze the influence of vibrations and symmetry classes on chemical reactivity. It also suggests that symmetry could be another parameter in strongly coupled materials and solid-state systems.
Acknowledgements
We acknowledge support of the International Center for Frontier Research in Chemistry (icFRC, Strasbourg), the ANR “ERA-NET QuantERA” – Projet “RouTe” (ANR-18-QUAN-0005-01), the ANR Equipex Union (ANR-10-EQPX-52-01), CSC (ANR-10-LABX- 0026 CSC) within the Investissement d'Avenir program ANR-10-IDEX-0002-02. T.W.E. acknowledges the support of the ERC (project no 788482 MOLUSC). Y.P. thanks the support of the China Scholarship Council (201808370031).
Conflict of interest
The authors declare no conflict of interest.


