Direct Measurement of Charge Regulation in Metalloprotein Electron Transfer
Abstract
Determining whether a protein regulates its net electrostatic charge during electron transfer (ET) will deepen our mechanistic understanding of how polypeptides tune rates and free energies of ET (e.g., by affecting reorganization energy, and/or redox potential). Charge regulation during ET has never been measured for proteins because few tools exist to measure the net charge of a folded protein in solution at different oxidation states. Herein, we used a niche analytical tool (protein charge ladders analyzed with capillary electrophoresis) to determine that the net charges of myoglobin, cytochrome c, and azurin change by 0.62±0.06, 1.19±0.02, and 0.51±0.04 units upon single ET. Computational analysis predicts that these fluctuations in charge arise from changes in the pKa values of multiple non-coordinating residues (predominantly histidine) that involve between 0.42–0.90 eV. These results suggest that ionizable residues can tune the reactivity of redox centers by regulating the net charge of the entire protein–cofactor–solvent complex.
The net electrostatic charge (Z) of a protein, that is, the sum of electrostatic contributions from side chains, tightly bound solvent, co-solvent, buffer ions, and organic or metal cofactors, affects the rate and/or free energy of several chemical processes including molecular recognition,1, 2 catalysis,3 and possibly electron transfer (ET).4-6 The long range over which electrostatic forces act in the interior of a protein (and to a lesser extent, in the exterior) provides a qualitative rationale for these effects.1 A rigorous quantitative understanding remains elusive because the net charge of a folded protein in solution has been measured for just a few proteins.7 This void is analytical in nature. Biochemistry is flush with tools to measure the mass, catalysis, and structure of proteins, but there are few to measure the net charge of a folded protein in solution at pH≠pI.1
The absence of direct measurements of the net charge of proteins at different metal oxidation states has left a few fundamental questions unanswered in bioinorganic chemistry. For example, will the net charge of metalloproteins fluctuate by approximately one unit when cycling between Mn+ and M(n+1)+, or do metalloproteins tightly regulate net charge during ET, that is, reorganize H+ or OH− to adjust to the new electrostatic environment? Charge regulation refers to the adjustment in the pKa value of ionizable functional groups in response to changes in the electrostatic environment of that group. Will the magnitude of charge regulation vary greatly from protein to protein? Could this negative feedback of charge account for a significant fraction of the protein's redox potential (E°)?8 The exact mechanisms by which non-coordinating amino acid residues affect the E° value of metal centers remain poorly understood.9 Or does the regulation of charge occur with ET—at least for some amino acid residues—and contribute to its reorganization energy (λT) according to Marcus theory?10-12 The kinetic parameters of ET in proteins, that is, the inner-sphere and outer-sphere reorganization energies (λi and λo), are difficult to measure directly and are inferred from the quadratic relationship (predicted by Marcus theory) between experimentally measured rates and ΔG° of ET in proteins or through resonance Ramen absorption spectroscopy (for λi).10, 11, 13
In this study, we used “protein charge ladders”1 and capillary electrophoresis (CE) to measure the ΔZ values of metalloproteins during single ET. We studied three model systems: 1) holo-myoglobin (Mb) upon ET from sodium dithionite to Fe3+ hemeb; 2) holo-cytochrome c (Cyt c) upon ET from Fe2+ hemec to potassium ferricyanide; and 3) holo-azurin (Az) upon ET from sodium dithionite to Cu2+.
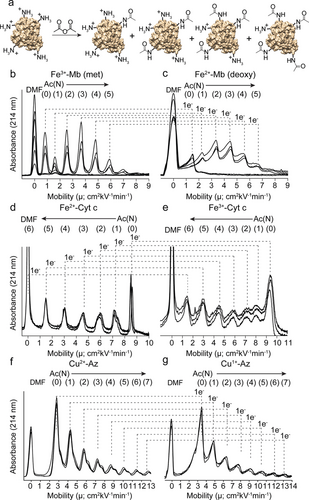
Protein charge ladders consist of electrostatic isomers of a protein prepared by acetylation of its surface Lys-ϵ-NH3+ groups; they possess similar sizes and structures, but systematically altered net charges (Figure 1 a).1 The electrophoretic mobility of each “rung” can be used to determine the net charge of the non-acetylated protein, or “zeroth” rung (Figure 2). A protein charge ladder, when analyzed with CE, is the only self-calibrating, internally consistent tool for rapidly measuring the net charge of a folded protein in solution.14 The timescale of analysis is typically 2–15 min.

a) Acetylation of lysine to generate protein charge ladders. b–g) Replicate capillary electropherograms of protein charge ladders of oxidized and reduced Mb (b, c), Cyt c (d, e), and Az (f, g). Dimethylformamide (DMF) was added as a neutral marker of electroosmotic flow. Numbers above each peak or “rung” in the electropherogram indicate the number of acetylated lysine residues, Ac(N). Only three replicate electropherograms are shown (for all others, see Figure S4).

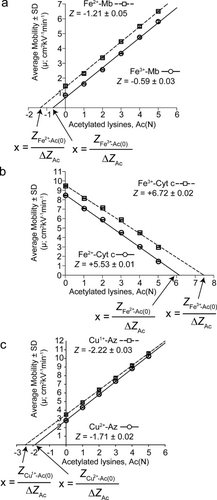
Plots of the average mobility versus Ac(N) for a) Fe3+-Mb (n=9) and Fe2+-Mb (n=9), b) Fe3+-Cyt c (n=10) and Fe2+-Cyt c (n=10), and c) Cu2+-Az (n=10) and Cu1+-Az (n=10).
Protein charge ladders of Fe3+-Mb (or “met-Mb”), Fe2+-Cyt c, and Cu2+-Az were generated by acetylation of Lys-ϵ-NH3+ residues with acetic anhydride (Figure 1 a), resulting in a distribution of between zero and eight Lys-ϵ-NHCOCH3 residues (see the Supporting Information, Figure S1). The acetylated residues were shown by tandem mass spectrometry to be a mixture of all Lys-ϵ-NH3+ and N-terminal α-NH3+ (Figure S2).15
To generate charge ladders of reduced Mb and Az (Fe2+-Mb/“deoxy-Mb” and Cu1+-Az), a charge ladder of each oxidized protein was reduced with 100 molar equivalents of sodium dithionite (Na2S2O4).16 The large molar excess of Na2S2O4 ensures complete reduction, as well as the removal of any Fe2+-Mb species with coordinated oxygen.17 In the case of Cyt c, transfer of Fe3+-Cyt c to tris-glycine buffer (i.e., CE running buffer for Cyt c; see the Supporting Information) leads to the photoreduction of Fe3+-Cyt c to Fe2+-Cyt c.18 Thus we generated charge ladders of Fe3+-Cyt c by oxidizing charge ladders of Fe2+-Cyt c using five molar equivalents of potassium ferricyanide (K3[Fe(CN)6]).19 The oxidation state and purity of each protein were confirmed before and after CE by UV/Vis spectrophotometry (Figure S3) based on the characteristic spectra for each species (see the Supporting Information).
We first measured the net charge of Fe3+-Mb and Fe2+-Mb at pH 7.4 (Table 1). To properly identify the zeroth rung, replicate CE electropherograms of Fe3+-Mb charge ladders were overlaid with electropherograms of non-acetylated Fe3+-Mb (Figures 1 b and S4 a); similar overlays are shown for Fe2+-Mb (Figures 1 c and S4 b; see the Supporting Information and Figure S5 for a detailed discussion of peak broadening in electropherograms). Linear plots of the electrophoretic mobility (μ) of each rung versus the number of acetylated lysine residues in that rung (Ac(N)) were extrapolated to the x intercept to determine the net charge of unmodified Fe3+-Mb and Fe2+-Mb (Figure 2 a). The x intercept of this plot is equal to the quotient of the net charge of the zeroth rung (ZAc(0)) and the change in charge associated with each acetylation (ΔZAc).7 The net charge of non-acetylated Fe3+-Mb was determined from the protein charge ladders to be ZFe(III)-Mb=−0.59±0.03 (Figure 2 a and Table 1). The measured net charge of Fe2+-Mb is ZFe(II)-Mb=−1.21±0.05 (Figure 2 a and Table 1). Thus the measured difference in the net charge of Mb upon reduction of Fe3+ to Fe2+ is −0.62±0.06 units, instead of the formal value of −1.00 units. The Mb polypeptide therefore regulates its net charge upon the reduction of its iron redox center by 38±6 %. To further confirm that the oxidation state did not change as a result of electrophoretic separation of the reducing agent from the protein, we measured the net charge of the most rapidly reoxidizing protein, Fe2+-Mb, with 1 mm dithiothreitol in the capillary running buffer. The net charge did not change significantly compared to Fe2+-Mb without dithiothreitol (ZFe(II)-Mb=−1.23±0.03; n=3), indicating that the residual dithionite concentration present in each injected sample was adequate to prevent the reoxidation of Mb during the brief period of electrophoretic separation.
|
Protein |
ZCE |
ZPredicted[a] |
|
|---|---|---|---|---|
|
Fe3+-Mb (H2O/OH−) |
−0.59±0.03 |
+4.34 |
|
|
Fe2+-Mb |
−1.21±0.05 |
+2.81 |
|
|
Fe3+-Cyt c |
+6.72±0.02 |
+10.78 |
|
|
Fe2+-Cyt c |
+5.53±0.01 |
+9.95 |
|
|
Cu2+-Az |
−1.71±0.02 |
−1.34 |
|
|
Cu1+-Az |
−2.22±0.03 |
−2.02 |
|
- [a] Values of ZPredicted were determined by numerical solutions to the Poisson–Boltzmann equation using finite-difference methods, as described in the Supporting Information.
The measured net charge of Fe2+-Cyt c (Figures 1 d, e and S4 c, d) is ZFe(II)-Cyt c=+5.53±0.01, and that of Fe3+-Cyt c is ZFe(III)-Cyt c=+6.72±0.02 (Figure 2 b and Table 1). The difference in net charge upon single ET of Cyt c is −1.19±0.02 units. Therefore, Cyt c does not undergo classical charge regulation per se, but undergoes a larger than expected change in net charge upon ET. Rung (6) in the electropherogram of Fe2+-Cyt c co-migrated with the DMF peak (ZAc(6)≈0), and was not included in the calculation of Cyt c net charge. As expected, the relative mobility of the rungs of Cyt c is reversed compared to Mb and Az because Cyt c is a net positively charged protein (unlike Mb and Az). Cytochrome c was therefore separated on a positively charged capillary, reversing the electroosmotic flow (see the Supporting Information). The measured net charge of Az (Figures 1 f, g and S4 e, f) is ZCu(II)-Az=−1.71±0.02 and ZCu(I)-Az=−2.22±0.03 (Figure 2 c and Table 1). The net charge of Az therefore changes by −0.51±0.04 upon single ET (49±4 % regulation of net charge).
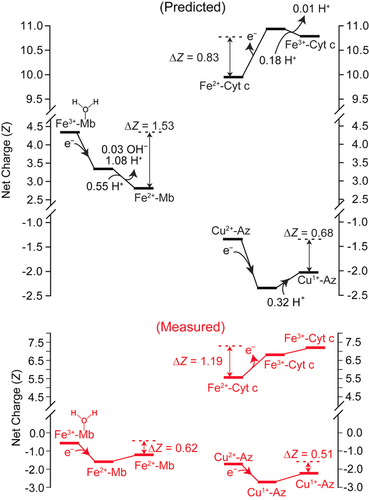
To identify the residues or cofactors that are most likely responsible for charge regulation, that is, those that undergo the largest changes in charge, we calculated the pKa values of all ionizable residues and cofactors of each protein in both redox states from their corresponding X-ray crystal structures. These calculations utilized numerical solutions of the Poisson–Boltzmann equation based on finite-difference methods.20 This analysis predicted −1.53 units for Mb, −0.83 units for Cyt c, and =−0.68 for Az. These values correspond well with the measured ΔZ values for Cyt c and Az, but not for Mb (Table 1), even though we accounted for the pKa value of the water molecule coordinated to Fe3+-heme in met-Mb, which dissociates upon reduction.17
A structural and biophysical discussion of the residue and cofactor functional groups predicted to undergo significant changes in charge (defined as ΔZ>0.01 for any individual functional group) upon ET in Mb, Cyt c, and Az can be found in the Results and Discussion Section in the Supporting Information (Figures S6–S9). These mechanisms are summarized in Figure 3. Briefly, in all three proteins, every ionizable functional group experiences at least a minor change in pKa value upon the change in oxidation state, but only residues with very large changes in pKa or residues with pKa values near 7.4 significantly change in ΔZ; these residues are fewer in number. Reduction of Mb results in significant changes in ΔZ (defined as ΔZ>0.01) of all non-coordinating histidine residues (H24, H36, H48, H64, H81, H82, H97, H113, H116, and H119), α-NH3+-G1, and the coordinating H2O in Fe3+-Mb (Figures S6, S9 a, b and Tables S1 and S2). In Cyt c, oxidation results in significant changes in the ΔZ values of K13, H33, Y48, Y97, and α-NH3+-G1 (Figures S7 and S9 c, d and Tables S3 and S4). Most of the ΔZ values associated with ET in Az (ca. 99 %) can be accounted for by the predicted increase in the pKa values of both non-coordinating histidine residues (H35, H83) and α-NH3+-A1 (Figures S8 and S9 e, f and Tables S5 and S6); the protonation of H35 upon ET has been observed experimentally.8, 21

Comparison of experimentally and theoretically determined values of charge regulation.
The free energy required for the predicted adjustments of the pKa values of all residues upon single ET (ΔΔGz) was calculated to be large: ΔΔGz=0.90 eV for Mb, ΔΔGz=0.50 eV for Cyt c, and ΔΔGz=0.42 eV for Az (calculated from the pKa values in Tables S1–S6, using the equation: ΔG=(2.3 RT)[pH−pKa]). This energy will contribute to the redox potential and/or reorganization energy, depending upon when the protonation occurs relative to ET. It is beyond the scope of this current study to determine the certainty with which fluctuations in the protonation of Mb, Az, and Cyt c occur after ET (affecting E°) or with ET (affecting λT). Previous studies of Az suggested that the protonation of H35, which we predict to account for approximately 43 % of charge regulation, occurs after reduction, and is coupled to slow conformational changes.8, 21 Moreover, substituting H35 in Az with Phe, Leu, or Gln lowered the bimolecular ET rate constant by a factor of up to two, and diminished E° by up to 50 mV.8 These results suggest that protonation of H35 does not contribute to λT, but occurs after ET, and therefore contributes to E° of Az. For Mb and Cyt c, far more residues were predicted to be involved in charge regulation, and it is possible that changes in protonation of some residues might occur in concert with ET. Similar mutagenesis studies on all non-coordinating residues that we found to be implicated in charge regulation are not available for Cyt c and Mb; however, replacing H64 in Mb (the “distal” histidine, which we predict to account for ca. 7 % of ΔZET) with non-ionizable residues increased the rate of ET by a factor of >10 and E° by 6–50 mV.22
Considering the importance of solvent reorganization in λT,5 we suspect that changes in the protonation of some residues might occur with ET, and make non-negligible contributions to λT. Insofar as the fluctuation in the pKa value of a residue might contribute to λT, we presume that it contributes primarily to λo (except for the acidic H2O bound to Fe3+ in Mb, which dissociates upon ET and would contribute to λi). According to semi-classical analyses of ET rates for ruthenium-modified Fe3+-Mb, the λT associated with its reduction is λT=1.48 eV.10 Thus, the values of ΔΔGz that we calculated for redox cycling in Mb (which are supported by measured values of ΔZ) could account for a maximum of about 61 % of λT. The ΔΔGz for Cyt c could account for about 42 % of λT (λT=1.2 eV according to semi-classical analyses of rates for ruthenium-modified Fe3+-Cyt c).10 Previous theoretical predictions suggest that λo comprises the majority of λT for Mb and Cyt c (87 % and 67 %, respectively; i.e., λo=1.29 and λi=0.19 eV for Mb and λo=0.8 and λi=0.4 eV for Cyt c).10 Therefore, the lower value of ΔΔGz for Cyt c, compared to Mb, could at least partially explain the lower value of λT for Cyt c compared to Mb.
In as much as λo comprises a majority of λT for other proteins—and contributions of λi are a minority—it is reasonable to predict that the ΔΔGz values might correlate roughly (and linearly) with experimentally determined values of λT (if ΔΔGz contributes to λT). This correlation would not hold for proteins whose λi values comprise larger proportions of λT or for proteins where a majority of ΔΔGz contributes to E°. Although λT has been experimentally inferred (using ruthenium donors) for Az, Mb, and Cyt c, the relative contributions of λo and λi have only been theoretically predicted for Mb and Cyt c. Nevertheless, this trend is apparent from a comparison of predicted values of ΔΔGz and measured λT for six ET proteins (Figure S10 a), where ΔΔGz correlates linearly with λT (R2=0.76). There was only a weak correlation between ΔΔGz and E° for the same proteins (Figure S10 b; R2=0.22), as expected when considering that E° is controlled by multiple bioinorganic and biophysical factors, including ligand-field effects and protein net charge.9, 23 If ΔΔGz does not contribute significantly to λT in a protein, it would then contribute to E°, and the magnitude of ΔΔGz suggests that these contributions will be large. However, if changes in protonation occur long after ET, there is a possibility that they are entirely disconnected from ET parameters.
In conclusion, measurements of ΔZET with protein charge ladders and CE provide a rapid method for quantifying how proteins regulate their net charge during ET. The experimental and theoretical results of this study on Az, Cyt c, and Mb suggest that non-coordinating, ionizable residues (predominately histidine and N-terminal α-NH3+) can tune the reactivity of redox centers by charge regulation. The range of ΔΔGz values associated with ET in these proteins is large (0.42 to 0.90 eV), and will significantly affect rates of ET by altering E° and/or λT. Future studies will be required to discern which parameter of ET, that is, E° or λT, is predominantly affected by the ΔZET of specific ionizable residues during electron transfer.
Acknowledgements
Financial support for this research was provided to B.F.S. by the National Science Foundation (CHE: 1352122) and the Welch Foundation (AA-1854). Computational work was supported by the Edward R. Biehl Graduate Fellowship to H.Z., the SMU Dean's Research Council, and the American Chemical Society Petroleum Research Fund (57521-DNI6 to P.T.). Computational time was provided by the SMU Center for Scientific Computation.
Conflict of interest
The authors declare no conflict of interest.


