Developing a multimorbidity prognostic score in elderly patients with solid cancer using administrative databases from Italy
Abstract
Aims
To develop and to validate a Cancer Multimorbidity Score (CMS) predictive of mortality in elderly patients affected by solid tumor, by using population-based administrative Italian databases.
Methods
Through administrative databases of Lombardy Region (Northern Italy), a cohort of patients aged ≥65 years with a new diagnosis of solid tumor during the period 2009–2014 was identified. Sixty-one conditions and diseases, measured from hospital inpatient diagnosis and outpatient drug prescription within 2 years before cancer diagnosis in a training set randomly including 70% of the cohort patients were tested to predict 5-year mortality using a Cox regression model. Regression coefficients were used for assigning a weight to the predictive conditions, selected by the LASSO method. Weights were summed up in order to produce an aggregate score (the CMS). CMS performance was evaluated on a validation set, including the remaining 30% of the cohort patients, in terms of discrimination and calibration.
Results
The study cohort included 148,242 cancer patients. Thirty conditions were selected as independent predictors of 5-year mortality and were included in the computation of the CMS. The area under the receiving operating characteristics curve was 0.68, becoming 0.71 when considering 1-year mortality as outcome and reaching values of 0.74 and 0.81 when focusing on patients with breast and prostate cancer, respectively. A strong increasing trend in mortality was observed with increasing CMS value.
Conclusions
CMS represents a new useful tool for identifying high-risk elderly cancer patients in everyday clinical practice, as well as for risk adjustment in clinical and epidemiological studies.
1 INTRODUCTION
Most chronic diseases are more common among the elderly adults; therefore, both the number of morbidities and the prevalence of people with multimorbidity increase substantially with age.1 A large cross-sectional study conducted in Scotland showed that about 80% of individuals aged 65 years or older had at least one chronic condition, and about 60% had concomitant morbidities. In particular, cancer patients were likely to have comorbidities, including coronary heart disease, diabetes, chronic obstructive pulmonary disease, chronic pain, depression, and anxiety.1 Consistently, data from Medicare beneficiaries in the United States showed that, among cancer patients aged 65 years or over, about 40% had at least one, and 15% had two or more chronic conditions, including mainly cardiovascular illness, obesity and metabolic illness, mental health problems, and musculoskeletal conditions.2 In cancer patients, comorbidities may affect clinical outcomes by impacting on timing of cancer diagnosis, treatment choice, effectiveness and toxicity, quality of life and overall survival. The adverse impact on survival tends to increase with increasing severity of comorbidities.2
Several prognostic factors are currently used in order to predict survival in cancer patients. The modified Glasgow Prognostic Score (GPS), which combines C-reactive protein and albumin concentrations, has been shown to be associated with survival in patients with a variety of operable and inoperable cancers.3 The Eastern Cooperative Oncology Group (ECOG) performance status4 and the Karnofsky performance status5 assess the functional status of a patient in terms of ability to care for themselves, daily activity, and physical ability, and both are predictive factors of survival of cancer patients. However, prognostic scores specifically based on comorbidities of cancer patients are lacking.
The purpose of this study is of developing and validating a cancer multimorbidity score (CMS) predictive of mortality in elderly patients with solid tumor, by using population-based administrative databases of Italy.
2 METHODS
2.1 Data sources
Administrative databases of Lombardy Region, a Northern Italy region accounting for more than 10 million inhabitants, were used. In Lombardy, management of the National Health Service (NHS) has been associated since 1997 with an automated system of databases to collect health information such as (i) demographic and administrative data on NHS beneficiaries, including information on the date of entry (birth or immigration) and exit (death or emigration) during the entire time period available; (ii) hospital discharge records reporting information on primary diagnosis, up to five coexisting conditions and procedures coded according to the International Classification of Diseases, 9th Revision, Clinical Modification (ICD-9-CM) classification system; (iii) drug prescriptions reimbursed by the NHS coded according to the anatomical therapeutic chemical (ATC) classification system. Record linkage between databases is performed by means of an identification code assigned to each NHS beneficiary. In order to preserve the privacy of the beneficiaries, identification codes were de-identified, and the conversion table was deleted.
2.2 Cohort selection
The target population included all beneficiaries of the Lombardy Regional Health Service between 2007 and 2014 (almost 10 million individuals). Those with a hospital admission with a diagnostic code of solid tumor (ICD-9-CM codes 140–195, excluding 173, non-melanoma skin cancer) during the period 2009–2014 were identified, and the first hospital admission for cancer was labelled “index hospitalization.” Among these, we excluded those (i) beneficiaries of the NHS for less than 5 years before index hospitalization, (ii) with a diagnostic code of cancer (ICD-9-CM codes 140–208) or antineoplastic treatment (ATC codes L01) in the 5 years prior to the index hospitalization (i.e. for excluding prevalent cancer cases and multiple cancers), (iii) aged less than 65 years at index hospitalization, (iv) with evidence of metastasis (ICD-9-CM codes 196–198, 199.0) at index hospitalization or within the subsequent six months, (v) who died during index hospitalization.
2.3 Candidate predictors
The list of candidate predictors of mortality were selected starting from those included in common prognostic comorbidities scores, including the Charlson Comorbidity Index,6 the Chronic Disease Score,7 and the more recent Multisource Comorbidity Score8 and Chronic Related Score,9 the latter two being developed from Italian administrative databases. The list comprised 61 conditions and diseases, including infectious and parasitic disease (n = 1), endocrine, nutritional and metabolic diseases, and immune-related disorders (n = 11), diseases of the blood and and hematopoietic organs (n = 3), mental disorders (n = 8), diseases of the nervous (n = 6), circulatory (n = 10), respiratory (n = 6), digestive (n = 4), genitourinary (n = 3) systems, disease of the skin and subcutaneous tissues (n = 2), diseases of the musculoskeletal system and connective tissue (n = 2), and other conditions (n = 5). Of the 61 included conditions, 24 were traced from inpatient diagnostic codes only, seven from outpatients prescribed drugs only, and the remaining 30 from both diagnostic and therapeutic codes.
The list of candidate predictors, along with the corresponding codes is reported in the Table S1.
2.4 Score development
Independent predictors of 5-year all-cause mortality (i.e., the outcome of interest) were identified using the following procedure. First, a random sample of the study cohort including 70% of patients was randomly selected from the study cohort, forming a training (derivation) set. These patients were followed up from index hospitalization until the earliest date between death and censoring (i.e., emigration or 5 years after index hospitalization). Second, a Cox proportional hazard regression model was fitted to estimate the hazard ratios of the association between the selected covariates and time to death. Covariates included in the model were gender, age (calculated at index hospitalization), and the 61 candidate predictors. Predictors were included as dichotomous variables, with a positive value if the specific condition was recorded at least once in the two years before index hospitalization. Third, the least absolute shrinkage and selection operator (LASSO) method was applied for selecting the diseases/conditions independently predictive of 5-year mortality. LASSO selects variables correlated to the outcome by shrinking coefficients weights, down to zero for those not correlated to the outcome.10 Finally, the coefficients estimated from the model were used for assigning a weight to each selected covariate, by multiplying the corresponding regression coefficient by 10 and rounding it to the nearest whole number.11
For each patient, the obtained weights were multiplied by the corresponding dichotomous variables and were summed up in order to produce a total aggregate score. The score was categorized by assigning increasing values of 0, 1, 2, and 3 to the categories of the aggregate score of 0–4, 5–9, 10–14, and ≥15, respectively. The obtained score was called cancer multimorbidity score (CMS).
2.5 Model validation
Validity of CMS was investigated by applying the score to a validation set consisting of the cohort patients not randomly included in the training set (i.e., the remaining 30% of the cohort patients). Predictive performance was assessed using two different approaches. The first one is discrimination, which indicates how well the model can discriminate individuals with the outcome from those without the outcome. Discriminatory power was assessed using the receiver operating characteristic (ROC) curves, and the corresponding area under the curve (AUC) and 95% confidence intervals (CI).12 The second one is calibration, which ascertains the concordance between the model's predictions and observed outcomes. Predicted versus observed 5-year survival probabilities were displayed in a calibration plot. Ideally, the plot should follow a 45-degree line, showing that the predicted risks are equal to the observed outcome frequencies. We assessed the extent to which predictions were systematically too high or too low (referred to as calibration-in-the-large), and the recalibration slope, reflecting the slope of the calibration plot, that, ideally, should be equal to 1.13 Finally, the Hosmer-Lemeshow goodness-of-fit test modified by Yu et al14 was used for testing the null hypothesis of agreement between observed and predicted survival probabilities.
2.6 Secondary analyses
Secondary analyses were performed to evaluate the ability of CMS in predicting (i) 1-year all-cause mortality and (ii) both 5-year and 1-year all-cause mortality in three separated cohorts of patients with colorectal (ICD-9-CM codes 153, 154.0, 154.1), prostate (ICD-9-CM codes 185), and breast (ICD-9-CM codes 174) cancer.
3 RESULTS
During the period 2009–2014, we identified 403,661 individual with a diagnostic codes of solid tumor. After applying exclusion criteria, 148,242 patients were included in the study cohort (median age was 75 years, 55.9% were males). The flow chart of cohort selection is shown in Figure S1.
Of the 61 candidate predictors, 30 conditions were selected as independent predictors of 5-year mortality. In particular, cirrhosis and other chronic liver diseases, coagulation defects, disease of the respiratory system, insulin therapy, and dementia/Alzheimer mostly contributed to the total aggregate score (Table 1).
| Disease/condition | Prevalence rate (%) | Regression coefficient (SE) | Weight |
|---|---|---|---|
| Liver cirrhosis and other liver chronic diseases | 4.0 | 0.81 (0.02) | 8 |
| Coagulation defects | 0.4 | 0.49 (0.06) | 5 |
| Other diseases of the respiratory system | 8.4 | 0.47 (0.02) | 5 |
| Insulin therapy | 3.6 | 0.43 (0.02) | 4 |
| Dementia/Alzheimer | 1.7 | 0.41 (0.03) | 4 |
| Epilepsy and recurrent seizures | 2.5 | 0.33 (0.03) | 3 |
| Cystic fibrosis | 0.4 | 0.32 (0.06) | 3 |
| Chronic pain | 2.9 | 0.31 (0.02) | 3 |
| Psychosis | 1.7 | 0.28 (0.03) | 3 |
| Chronic obstructive pulmonary disease | 4.3 | 0.24 (0.02) | 2 |
| Other kidney disorders | 1.7 | 0.21 (0.03) | 2 |
| Cerebrovascular diseases | 5.0 | 0.20 (0.02) | 2 |
| Vascular diseases | 2.5 | 0.20 (0.03) | 2 |
| Anaemias | 17.5 | 0.19 (0.01) | 2 |
| Other diseases of the digestive system | 14.2 | 0.19 (0.01) | 2 |
| Diabetes without insulin therapy | 13.1 | 0.19 (0.01) | 2 |
| Disorders of fluid, electrolyte, and acid-base balance | 1.0 | 0.19 (0.04) | 2 |
| Parkinson's disease | 2.0 | 0.18 (0.03) | 2 |
| Corticosteroids | 13.9 | 0.17 (0.01) | 2 |
| Chronic kidney disease (with or without dialysis) | 2.6 | 0.17 (0.03) | 2 |
| Infectious and parasitic diseases (HIV infections, tuberculosis or other infectious and parasitic diseases) | 4.2 | 0.16 (0.02) | 2 |
| Heart failure | 3.8 | 0.14 (0.02) | 1 |
| Multiple sclerosis or other diseases of the nervous system and sense organs | 2.2 | 0.14 (0.03) | 1 |
| Depression | 12.9 | 0.12 (0.01) | 1 |
| Autoimmune disease (rheumatoid arthritis, rheumatoid psoriasis, anchylosing spondylitis, systemic sclerosis, systemic lupus erythematosus) or other diseases of the musculoskeletal system and connective tissue | 12.9 | 0.11 (0.01) | 1 |
| Other diseases of the circulatory system | 10.9 | 0.11 (0.02) | 1 |
| Oral anticoagulant agents | 7.5 | 0.09 (0.02) | 1 |
| Chronic respiratory disease only tracked by drug therapy | 13.4 | 0.08 (0.01) | 1 |
| Arrhythmia | 10.1 | 0.06 (0.02) | 1 |
| Gout | 8.5 | 0.06 (0.01) | 1 |
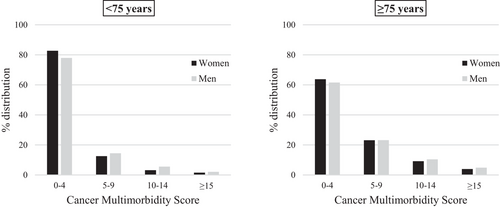
Overall, the distribution from the lowest (CMS values from 0 to 4) to the highest (CMS values ≥15) category of CMS was 70.9%, 18.6%, 7.3%, and 3.2%. No differences were observed in the distribution of CMS categories between males and females. In both sexes, older patients had on average higher CMS values (Figure 1).
The AUCs corresponding to the discriminant power of CMS in predicting 5-year and 1-year mortality were 0.68 (95% CI 0.67–0.69) and 0.71 (95% CI 0.70–0.72), respectively (Figure 2). Similar results were observed comparing the discriminatory power of CMS in predicting 5-years mortality in men (AUC = 0.69) and in women (AUC = 0.67), as well as in patients aged less than 75 years (AUC = 0.68) and in those aged 75 years or older (AUC = 0.65).
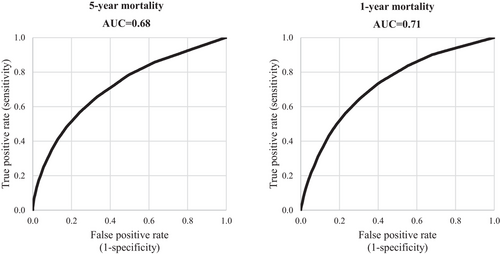
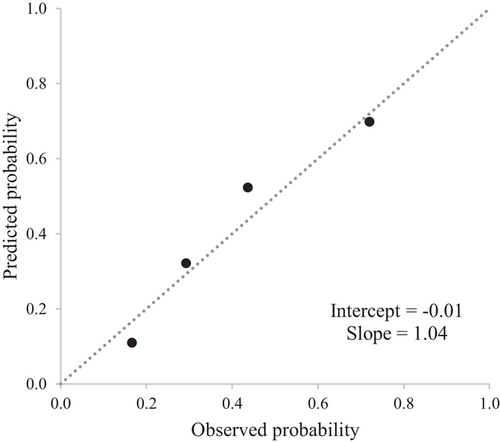
Figure 3 shows a good agreement between the observed and the predicted survival probabilities, with values of the calibration-in-the-large close to the ideal value of 0 (−0.01) and values of the recalibration slopes close to the ideal value of 1 (1.04). Adequate goodness-of-fit was also confirmed by the modified Hosmer-Lemeshow test, and the null hypothesis of agreement between observed and predicted frequencies could not be rejected.
A trend toward decreasing 5-year overall survival was observed with increasing CMS values (Figure 4). As compared to patients in the lowest CMS category, hazard ratios of death associated to increasing CMS category were 2.57 (95% CI 2.48–2.67), 3.87 (3.70–4.06), and 5.78 (5.44–6.14), respectively (p-value of trend < 0.001). Overall survival was 72%, 44%, 29%, and 17%, respectively, in patients from the lowest to the highest CMS category.
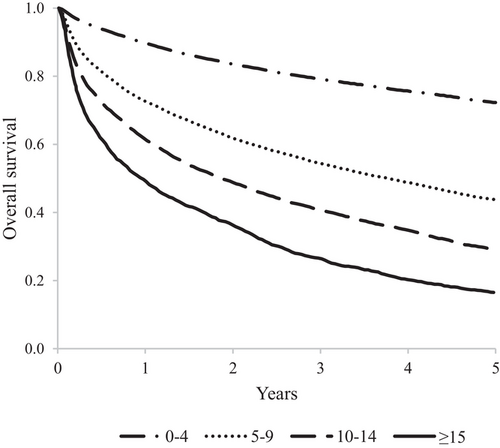
Figure S2 shows ROC curves and corresponding AUC values of the discriminant power of the CMS in patients with colorectal, prostate and breast cancer. AUC values associated to 5-year and 1-year survival were, respectively, 0.65 and 0.69 in colorectal cancer patients, 0.69 and 0.81 in prostate cancer patients, and 0.66 and 0.74 in breast cancer patient.
4 DISCUSSION
We developed and validated a new score predictive of mortality in elderly patients with solid tumors. This is based on hospital diagnosis and drug prescriptions retrieved from population-based administrative databases in Italy and can in principle be applied to several populations in which comparable information on disease diagnosis and drug prescription are available.
The CMS represents a useful tool both for epidemiologists, as a simple instrument for risk adjustment in clinical and epidemiological studies, for clinicians, for detecting and managing more vulnerable patients in everyday clinical practice, as well as for public health authorities to predict the burden of chronic conditions in elderly cancer patients. Our study showed that cancer patients with high CMS are associated to a poorer survival, as compared to those with low values of CMS.
Although the AUC associated with CMS was not totally satisfactory, the current score is able to predict mortality similarly or better than the commonly used Charlson Comorbidity Index (CCI).6 Indeed, the latter was associated in our data to an AUC of 0.61 when predicting 5-year mortality and of 0.63 when predicting 1-year mortality. Moreover, we compared this novel score to the already available Multisource Comorbidity Score (MCS) adapted to oncologic patients.15 The latter was associated to an AUC of 0.65 and 0.67 when predicting 5-year and 1-year mortality, respectively. Even though the MCS was developed by using Italian administrative databases as in this study, the observed slight differences in predicting mortality may be due to different inclusion criteria and a smaller list of candidate predictors as compared to the current study.
Our study has several strengths. First, it was developed and validated on a large and unselected population-based cohort including all patients with a hospital diagnosis of cancer during a 6-year recruitment period in the Italian Lombardy Region. Thus, our cohort is representative of the current Italian clinical practice, making the results generalizable. Second, the current score represents a new tool able to stratify elderly cancer patients with respect to their risk of both long- and short-term mortality. Third, as already mentioned, this score performs similarly or better than the widely and commonly used CCI. Although in the current study we could not validate the CMS externally (i.e. in other geographical area), we expect our score to perform similarly among different Italian regions, as previously shown for the MCS score.8 In addition, this score can be specifically used on cohorts of patients affected by the most common cancer sites, such as colorectal, prostate and breast cancer, showing, in some cases, a discriminatory ability of distinguish between low-risk and high-risk patient profile even better than that observed on the whole solid cancer cohort.
However, predictors only included those routinely collected by administrative databases in Lombardy Region. Disease severity, detailed clinical characteristics, and the functional patients’ status, which may be predictive of mortality, were not available. Moreover, our databases did not capture the likely small proportion of patients diagnosed with cancer in the outpatient setting.16, 17 Finally, because mortality is influenced by the nature and quality of healthcare systems,15 the application of the present score to other countries should be evaluated.
In conclusion, we developed and validated a prognostic score derived from data usually used for health system management of Lombardy, useful for predicting both long- and short-term mortality. This novel prognostic score represents a useful tool for identifying high-risk elderly cancer patients in everyday clinical practice.
CONFLICT OF INTEREST
Giovanni Corrao received research support from the European Community (EC), the Italian Agency of Drugs (AIFA), and the Italian Ministry for University and Research (MIUR). He took part in a variety of projects that were funded by pharmaceutical companies (i.e. Novartis, GSK, Roche, AMGEN and BMS). He also received honoraria as a member of the advisory board to Roche. The other authors declare that they have no conflict of interest to disclose.
AUTHOR CONTRIBUTIONS
Conceptualization: Carlo La Vecchia, Paolo Boffetta, and Giovanni Corrao. Methodology: Matteo Franchi, Federico Rea, and Claudia Santucci. Formal Analysis: Matteo Franchi, Federico Rea, and Claudia Santucci. Writing - Original Draft: Matteo Franchi and Giovanni Corrao. Writing - review and editing: Federico Rea, Claudia Santucci, Carlo La Vecchia, and Paolo Boffetta. Supervision: Paolo Boffetta. Funding Acquisition: Giovanni Corrao.
ACKNOWLEDGEMENTS
This study was supported by grants from the Italian Ministry of Health (‘Ricerca Finalizzata 2016′, NET- 2016–02363853). The funding sources had no role in the design of the study, the collection, analysis and interpretation of the data, or the decision to approve publication of the finished manuscript.
Open Research
DATA AVAILABILITY STATEMENT
The data that support the findings of this study are available from Lombardy Region, but restrictions apply to the availability of these data, which were used under license for the current study, and so are not publicly available. Data are however available from the Lombardy Region upon reasonable request.


